Do Bars Drive Spiral Density Waves?
Abstract
We present deep near-infrared -band AAT IRIS2 observations of a selected sample of nearby barred spiral galaxies, including some with the strongest known bars. The sample covers a range of Hubble types from SB0- to SBc. The goal is to determine if the torque strengths of the spirals correlate with those of the bars, which might be expected if the bars actually drive the spirals as has been predicted by theoretical studies. This issue has implications for interpreting bar and spiral fractions at high redshift. Analysis of previous samples suggested that such a correlation exists in the near-infrared, where effects of extinction and star formation are less important. However, the earlier samples had only a few excessively strong bars. Our new sample largely confirms our previous studies, but still any correlation is relatively weak. We find two galaxies, NGC 7513 and UGC 10862, where there is a only a weak spiral in the presence of a very strong bar. We suggest that some spirals probably are driven by their bars at the same pattern speed, but that this may be only when the bar is growing or if there is abundant gas and dissipation.
1 Introduction
The bar phenomenon is a pervasive and complex aspect of disk galaxies. A bar can be identified in 60% or more of present-epoch disk galaxies (Knapen et al. 2000; Laurikainen et al. 2004; Menendez-Delmestre et al. 2007; Marinova & Jogee 2007). Studies of galaxies in the GEMS and GOODS fields suggest that this fraction has been largely constant to at least =1 (Elmegreen et al. 2004; Jogee et al. 2004). Results from a larger sample in the COSMOS field indicates that the bar fraction is approximately constant out to =0.84 for the most massive galaxies only, and that smaller and less massive galaxies have a significantly declining bar fraction out to that redshift (Sheth et al. 2008). There is also a slight correlation between the presence of a bar and the presence of a prominent bulge among the high redshift galaxies; this is consistent with the massive galaxies having a constant bar fraction, since those galaxies tend to have a bulge (Sheth et al. 2008). Another issue is the effect of environment on bar fraction. Verley et al. (2007) showed that in a sample of isolated galaxies, a comparable fraction is barred as in samples not selected for isolation. Isolated barred galaxies also were found to have a comparable distribution of bar strengths to a non-isolation-selected sample.
An important question is how the strength of a bar impacts the features seen in a barred galaxy. We are particularly interested in the relation between the strength of a bar and the appearance or strength of a spiral. Is there a correlation between bar strength and spiral arm strength, as suggested by theoretical models? For example, Yuan & Kuo (1997; see also Kormendy & Norman 1979; Elmegreen & Elmegreen 1985) showed that stronger bars excited sharper gaseous density waves than weaker bars, although other parameters also affected the appearance of the waves. The fact that some strong observed bars join to a strong two-armed global spiral suggests that the bars and spirals are closely connected and that a bar strength-spiral strength correlation may be present. These global spirals are so tightly connected to the bar that it would seem the two features have the same pattern speed. Two-armed spirals around strong bars are rather common, representing 70% of typical field spirals, unlike non-barred field spirals where only 30% are two-armed (Elmegreen and Elmegreen 1982). We consider this bar-spiral correlation as evidence for interaction between the bar and the spiral, but do not know the nature of the interaction. It could be through various resonances, for example, and the exact resonances would determine the ratio of pattern speeds.
On the other hand, many bars are not connected to global two-armed spirals. There are bars with flocculent blue arms around them, galaxies with tiny bars and long irregular (swing amplified?) types of spirals around them, multiple-armed patterns, and old bars (SB0) with no spiral around them. It is clear that there is a wide variety in bar-disk interactions that do not include driving. There are no complete theoretical models which examine bar-driven density waves that consider both gas and stars.
We suspect that bars may drive spirals only when (a) the bar is young and growing in strength itself, or (b) there is ample gas in the bar-spiral system. Each of these situations provides an “arrow of time” for the spiral to know whether to be leading or trailing (Lynden-Bell & Ostriker 1967). Dissipation, growth, and interactions provide this but a steady state does not (e.g., Toomre 1969, 1981). Elmegreen & Elmegreen (1985) suggested that strong bars can grow to extend all the way to corotation and organize the gas clouds along strong outer spiral shocks. The issue of whether bars drive spirals is fundamental to our understanding of galaxy evolution because a close connection between bars and spirals should manifest itself in the fractions of such features seen at high .
Observationally, one way to evaluate these ideas is to use near-infrared -band images to infer the gravitational potential due to the dominant stellar backbone of galaxies. With such potentials, we can derive the relative importance of tangential forces due to bars and spirals. Near-infrared imaging is a necessity because optical images are confused by dust and star formation, whereas the -band emphasizes the mass distribution in the old disk (e.g., Block & Wainscoat 1991; Regan & Elmegreen 1997; Block et al. 1999).
In a recent study, Block et al. (2004) analyzed 2.2m images of 17 galaxies covering a range of bar strengths and Hubble types. A Fourier-based technique was used to separate the bars from their associated spirals and derive separate maximum relative torques (Buta, Block, & Knapen 2003). The bar and spiral strengths, and , are derived from the maximum ratio of the tangential force to the mean background radial force (Combes & Sanders 1981), as obtained after a Fourier decomposition of the galaxy image. To separate the bar and spiral arm components, the empirical fact that the Fourier amplitudes due to the bar increase with radius to a maximum in the same way as they decline past the maximum was used (the “symmetry assumption”). Alternatively, some Fourier profiles can be fitted with one or more gaussian components (Buta et al. 2005). With such representations, the bar can be extrapolated into the spiral region, and removed from the image. The net result is a “bar+disk” image and a “spiral+disk” image having the same total flux and identical =0 backgrounds. These separated images can then be analyzed for maximum relative torques due to the nonaxisymmetric features.
In Block et al. (2004), the sample was small and appeared to show a correlation between bar strength and spiral strength for galaxies having 0.3. A hint of the same correlation was also found by Buta et al. (2005) based on more than 100 galaxies in the Ohio State University Bright Galaxy Survey (OSUBGS, Eskridge et al. 2002). No galaxies in either study were found to have 0.6 and 0.2. The finding of such galaxies would seriously challenge the idea that bars in general drive spirals.
In this paper, we complement the Block et al. (2004) study by analyzing maximum relative torque strengths in 23 additional barred galaxies of relatively normal morphology and high luminosity. The main selection criterion was bar contrast, and we tried to include bars that were likely to turn out excessively strong when the near-IR image is converted into a gravitational potential. Because the new sample is not statistical in nature, we cannot determine an average bar driving strength for normal galaxies over the type range we have considered. Instead, our goal is to determine if bars drive spirals at all, even if only in a single case. For this we needed a highly selected sample, such as the one we chose, to focus on the most important physical processes that are involved.
The observations are described in section 2 while the images are discussed in section 3. Our analysis of the images involved 2D decompositions (section 4), image deprojection and bar-spiral separation (section 5), estimates of bar radii (section 6), followed by relative torque calculations (section 7). Descriptions of individual galaxies are provided in section 8. A discussion is provided in section 9 and conclusions in section 10.
2 Observations
To examine whether there might be weak spirals in the presence of extremely strong bars, we imaged the 23 galaxies in the -short () band using the Infrared Imager and Spectrograph (IRIS2) attached to the 3.9-m Anglo-Australian Telescope (AAT). The run took place from 2004 June 28 to July 5. IRIS2 has a pixel Rockwell HAWAII-1 HgCdTe detector mounted at the AAT’s Cassegrain focus, yielding a scale of 0.447 arcsec pix-1 and a field of view of 7.7 arcmin square. For the larger of our sample galaxies we imaged offset fields for subsequent sky subtraction of the galaxy images, while for the majority of our targets which were small enough we took series of 1 min images of the galaxy in alternate quadrants of the array. In either case, individual galaxy exposures were sky-subtracted and then combined into the final images, which have total equivalent on-source exposure times of around one hour in almost all cases and a spatial resolution of typically 1.5 arcsec (see Table 1 for details). This gave exceptional depth to the images because of our interest in measuring both bar and spiral torque strengths. The images were calibrated using Two-Micron All-Sky Survey (2MASS) data (see below), and depending on the size of the galaxy relative to the field of view, reach a level of 22-24 mag arcsec-2 in azimuthally-averaged profiles. For the subsequent analysis, we cleaned the images of foreground stars and subtracted any residual background, if the field of view was large enough.
3 Morphology
Our sample is morphologically diverse and has a range of properties. Tables 1 and 2 summarize some of these properties. Types are either from the de Vaucouleurs Atlas of Galaxies (Buta, Corwin, & Odewahn 2007, hereafter the deVA) or were estimated by RB from available -band images. These are generally consistent with types listed in the Third Reference Catalogue of Bright Galaxies (RC3, de Vaucouleurs et al. 1991). After standard processing with IRAF111IRAF is distributed by the National Optical Astronomy Observatories, which are operated by AURA, Inc., under cooperative agreement with the National Science Foundation. routines, all images were placed into the same units as the deVA, mag arcsec-2. The -band images were calibrated using 2MASS photometry within a 14′′ diameter aperture compiled on the NASA/IPAC Extragalactic Database (NED) website. The mean absolute blue magnitude is = 20.70.8 (s.d.) and the mean absolute -band magnitude is = 24.01.0 (s.d.). The galaxies are typical high luminosity systems.
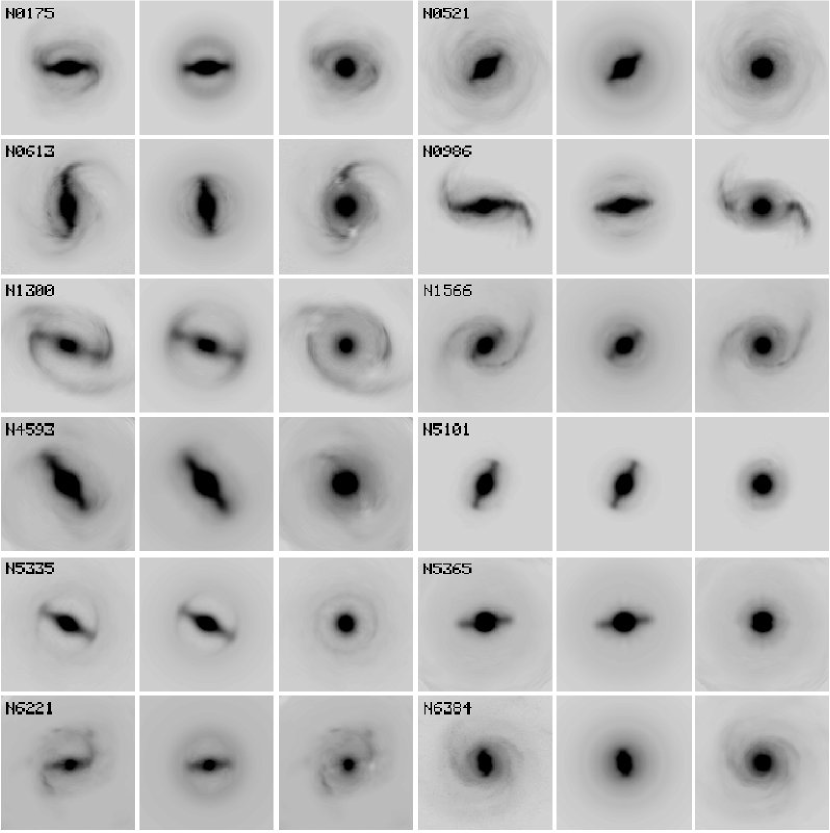
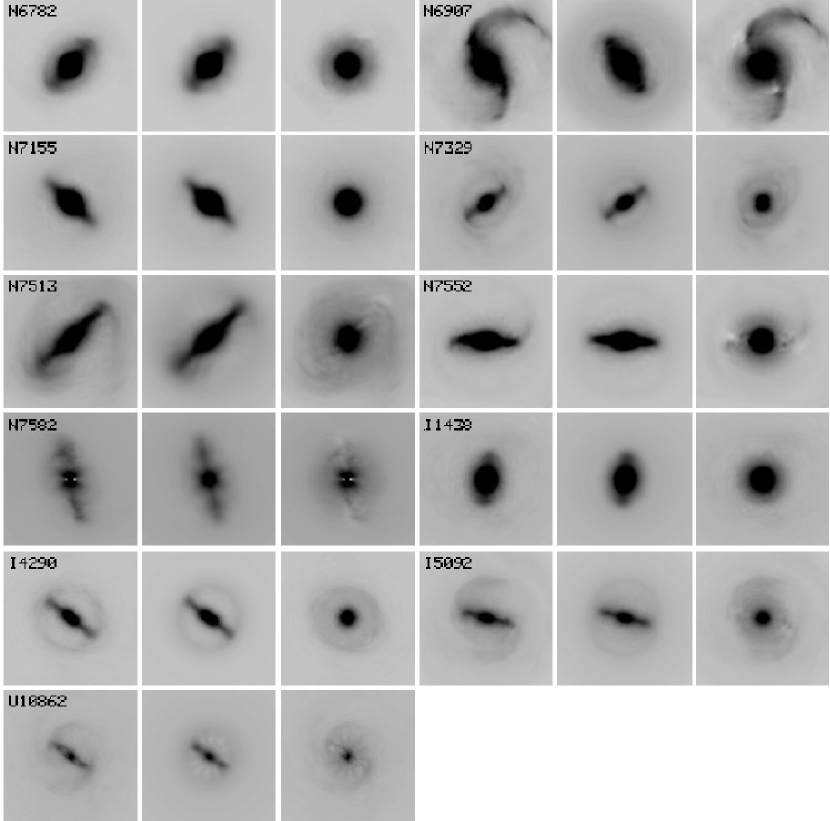
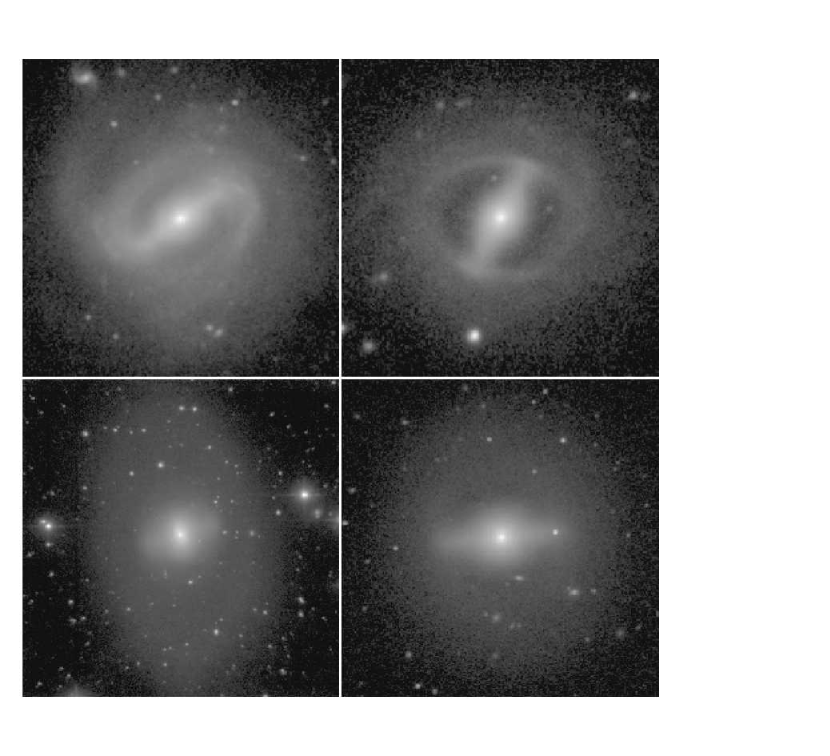
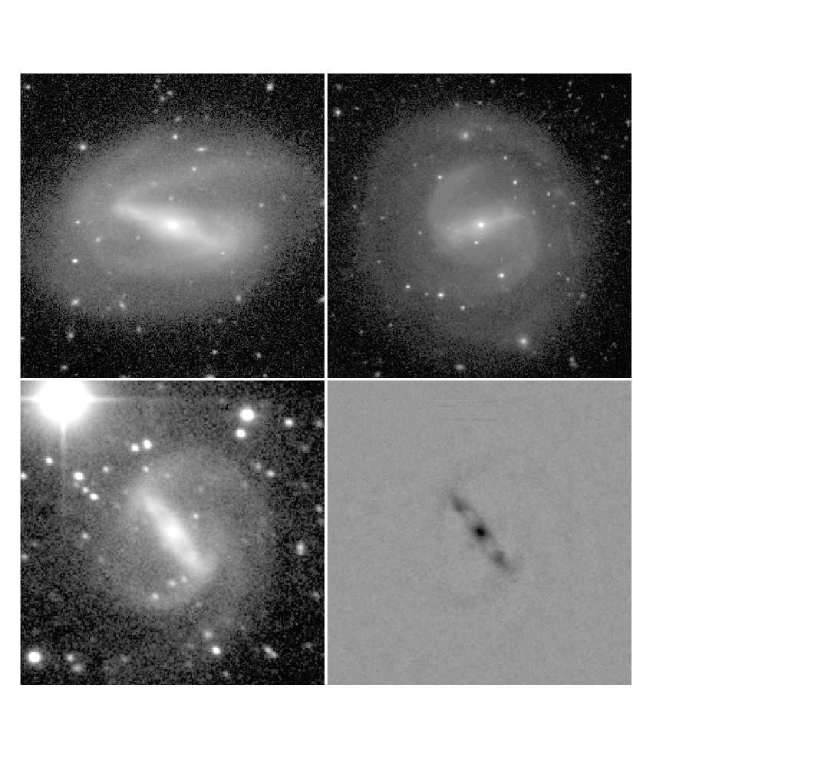
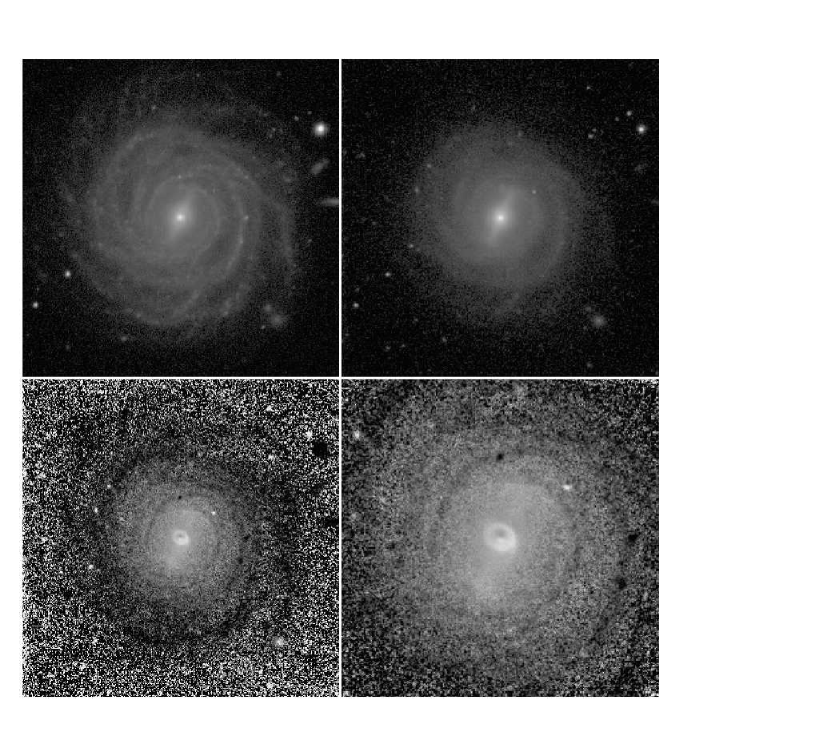
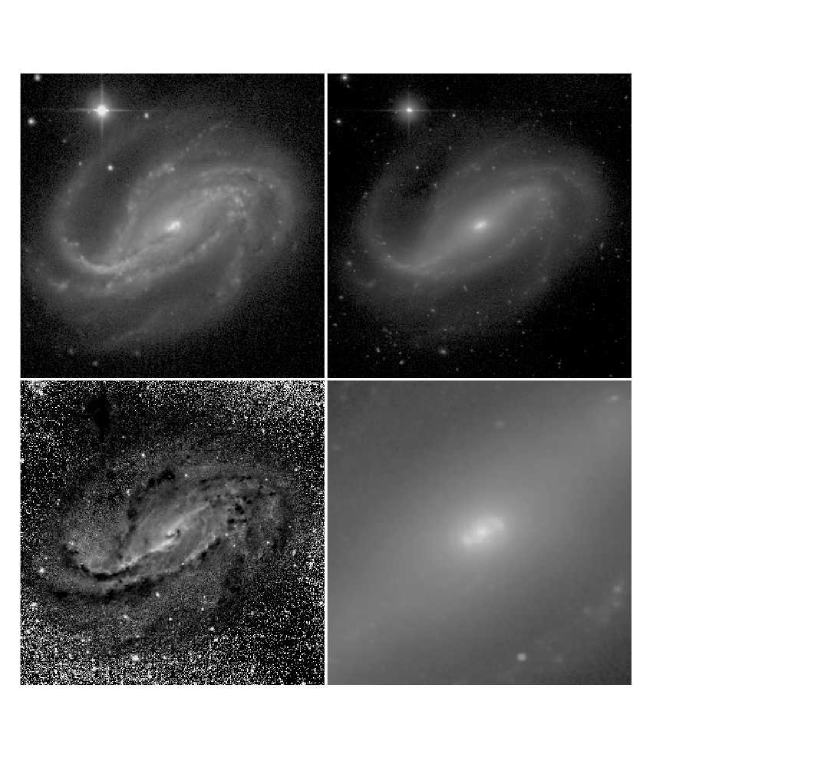
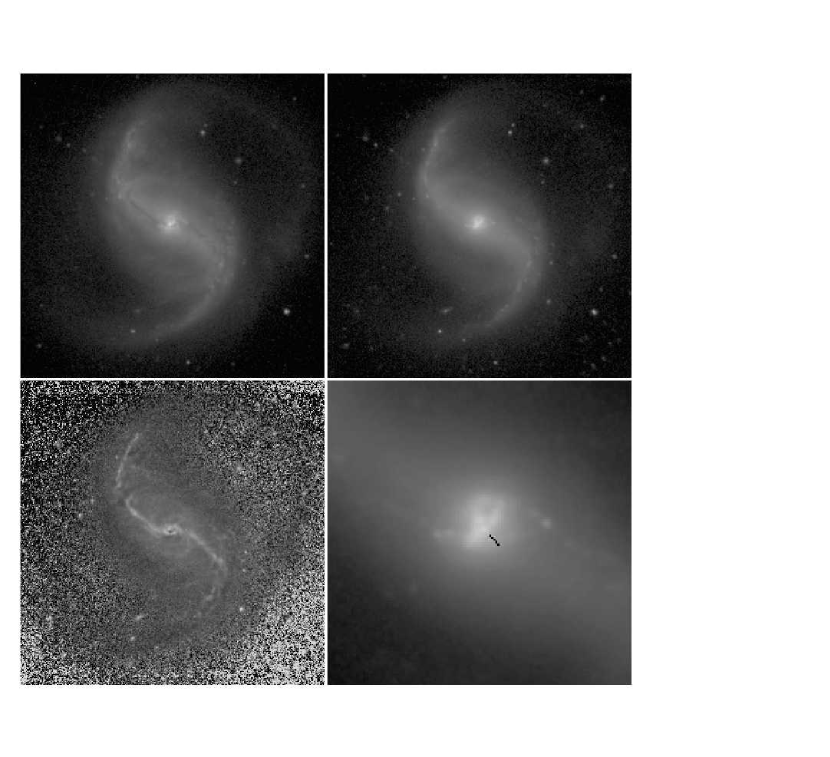
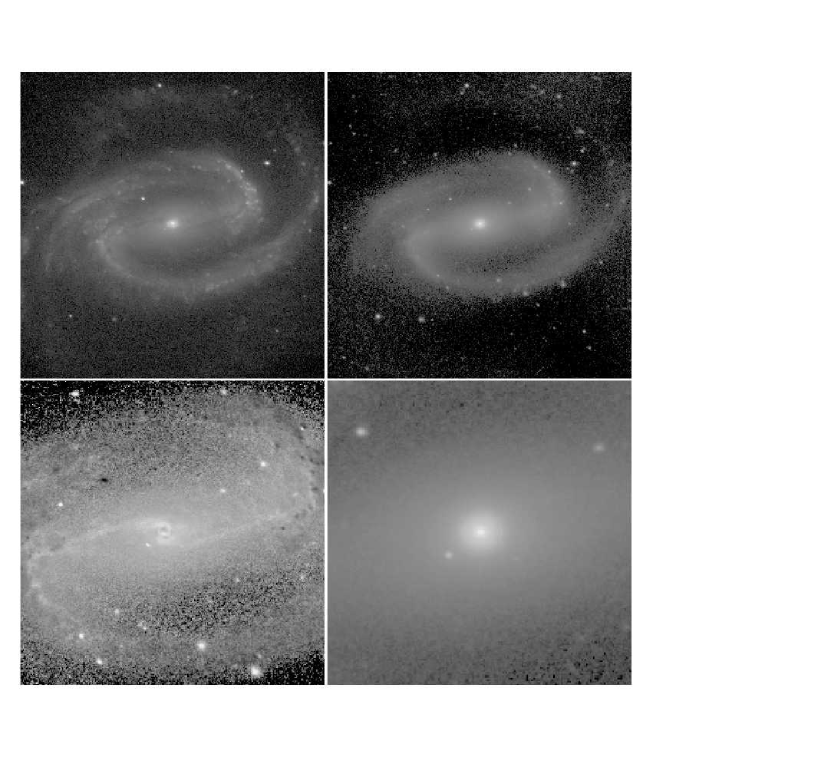
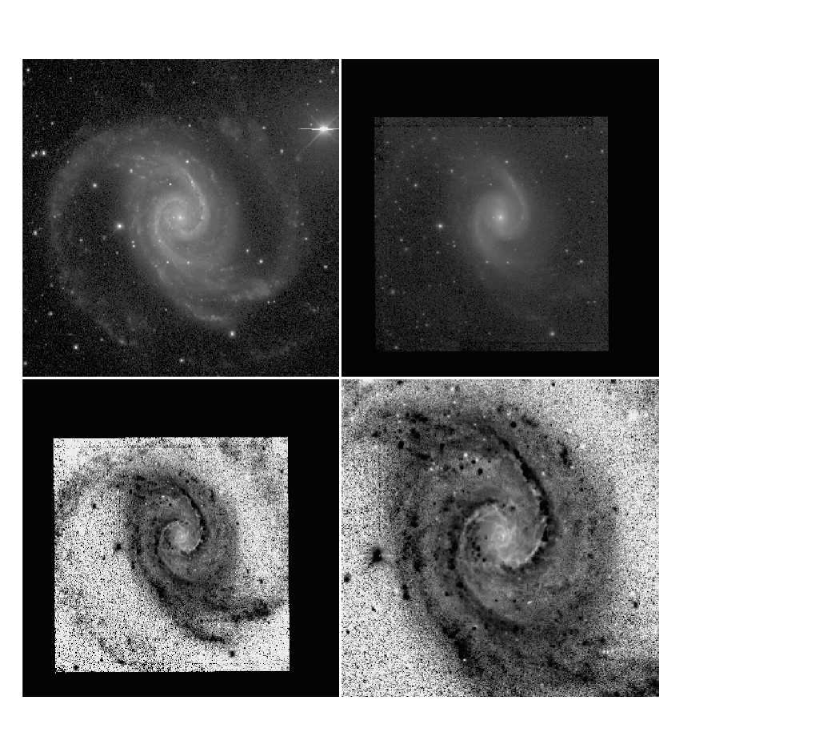
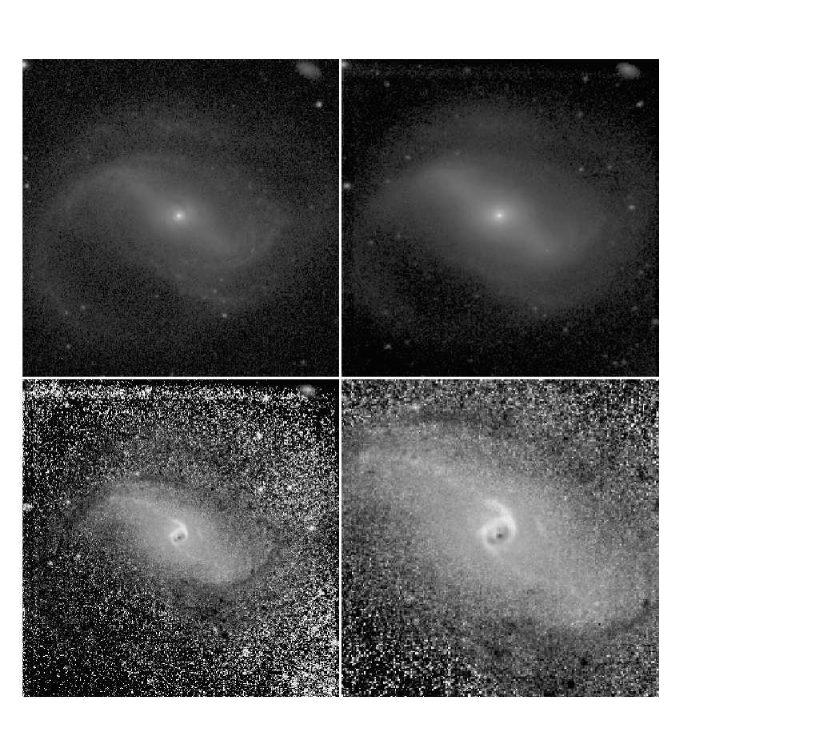
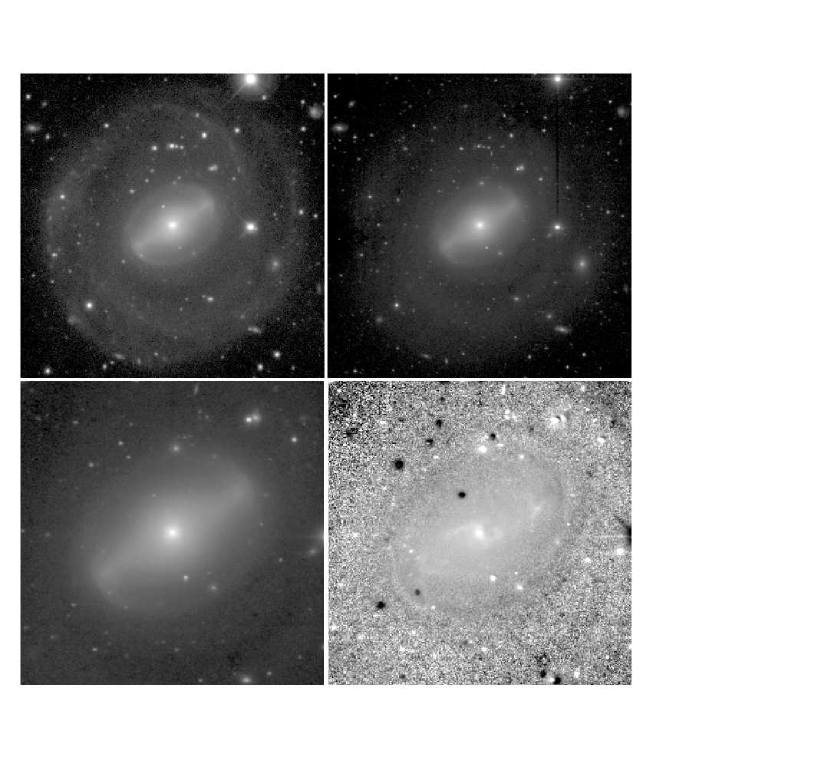
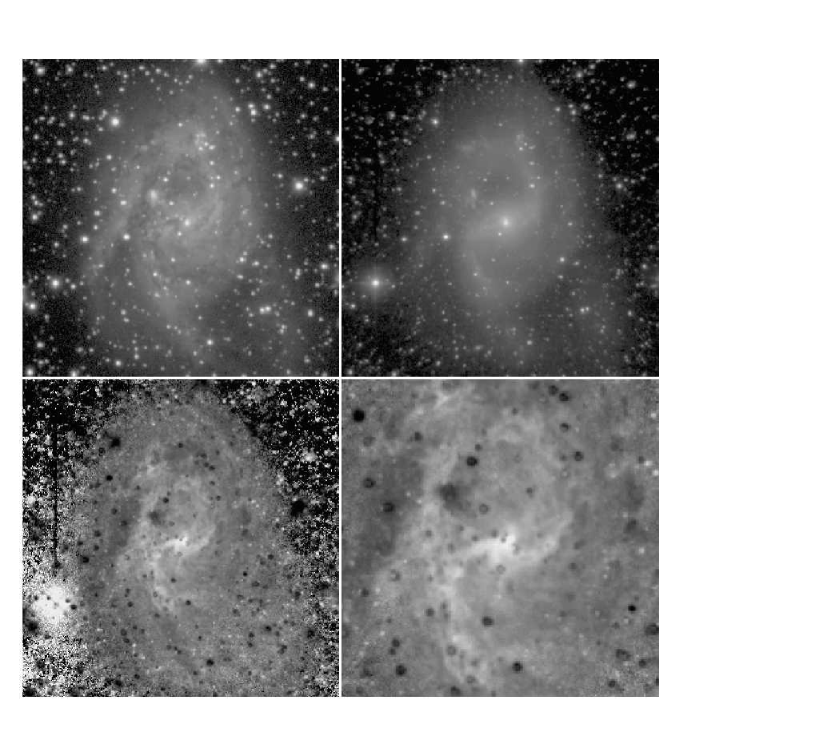
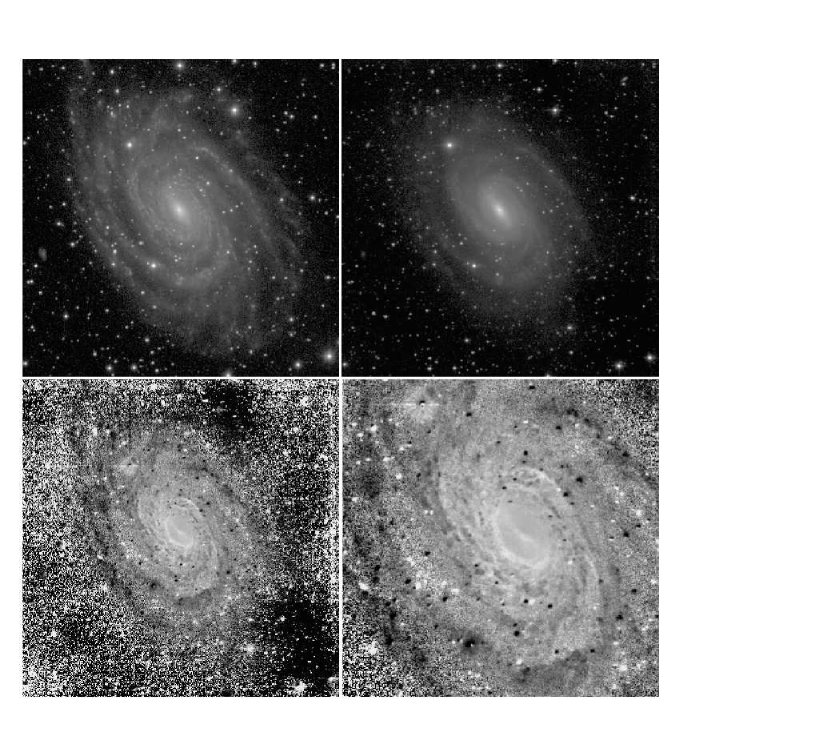
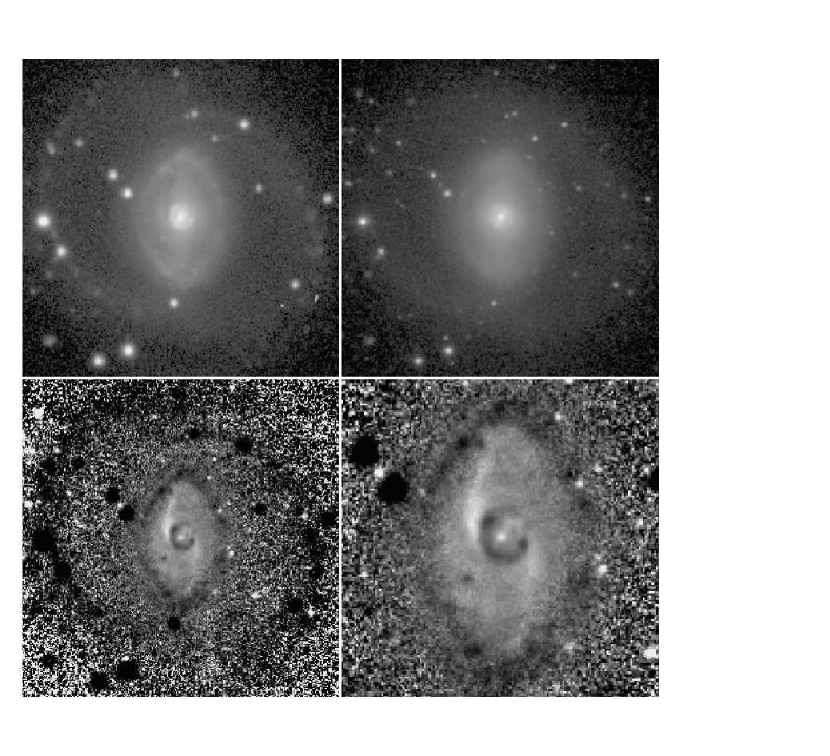
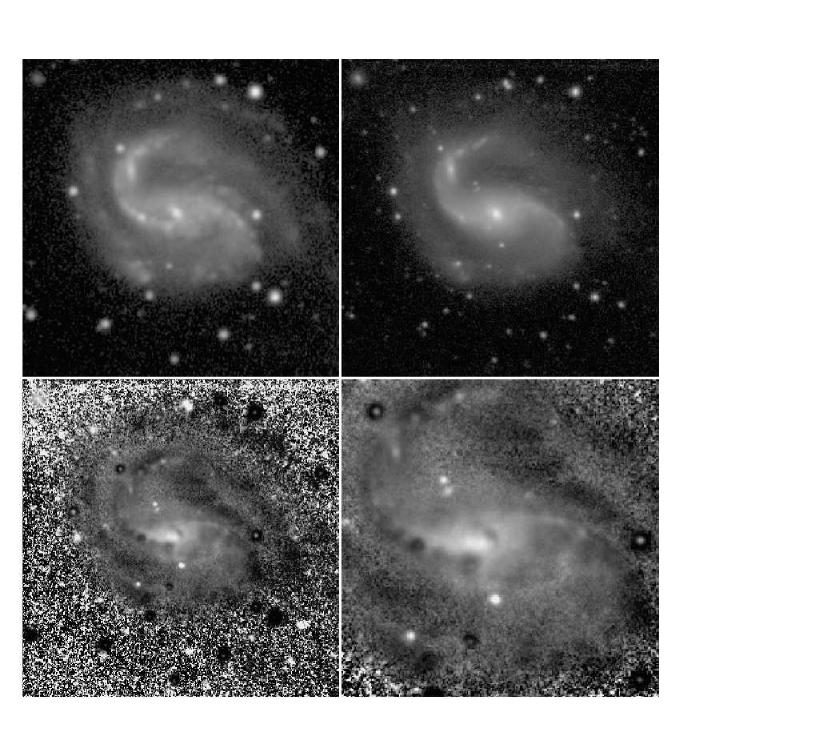
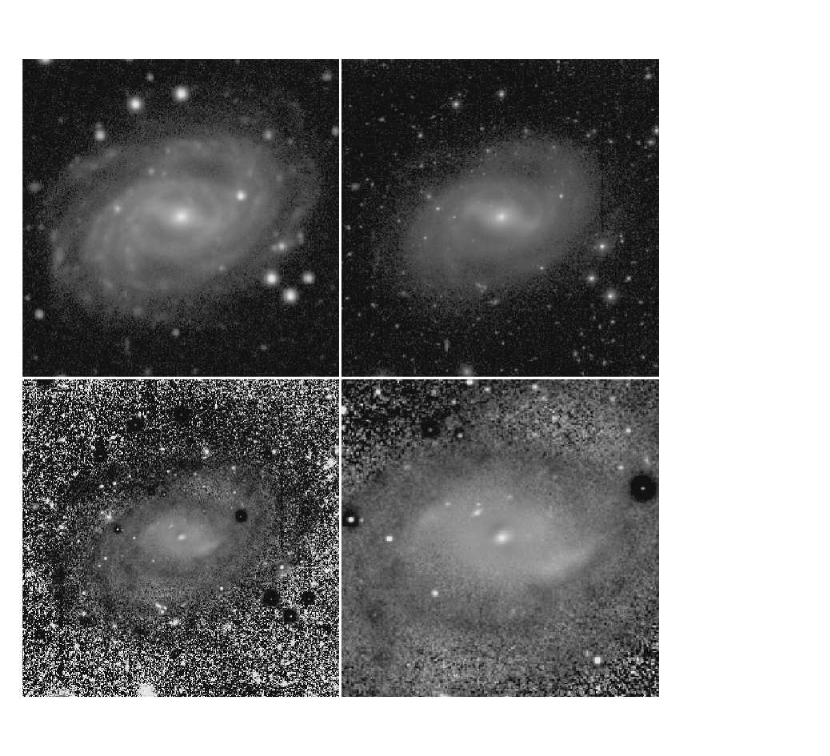
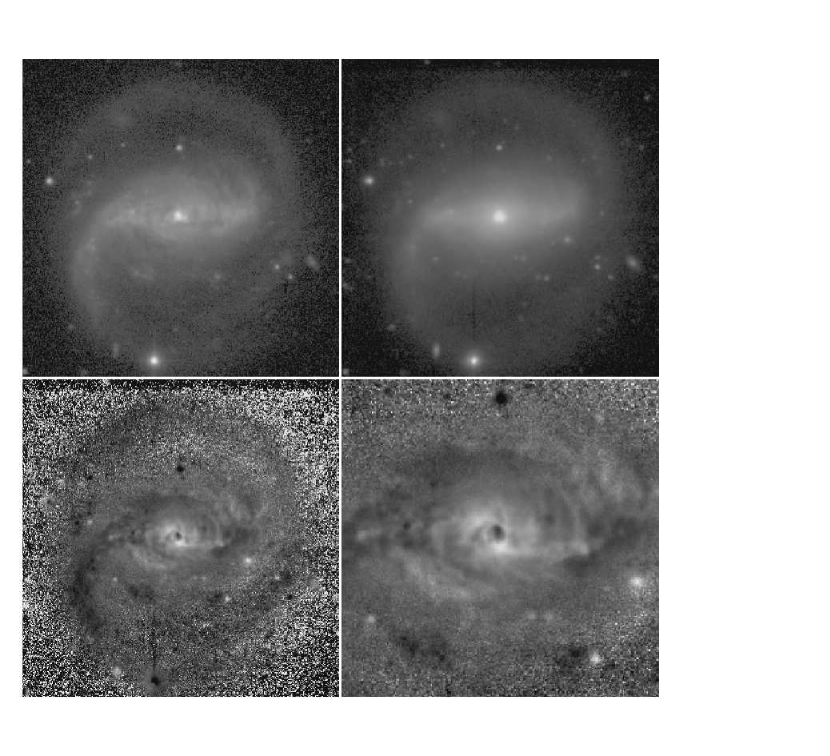
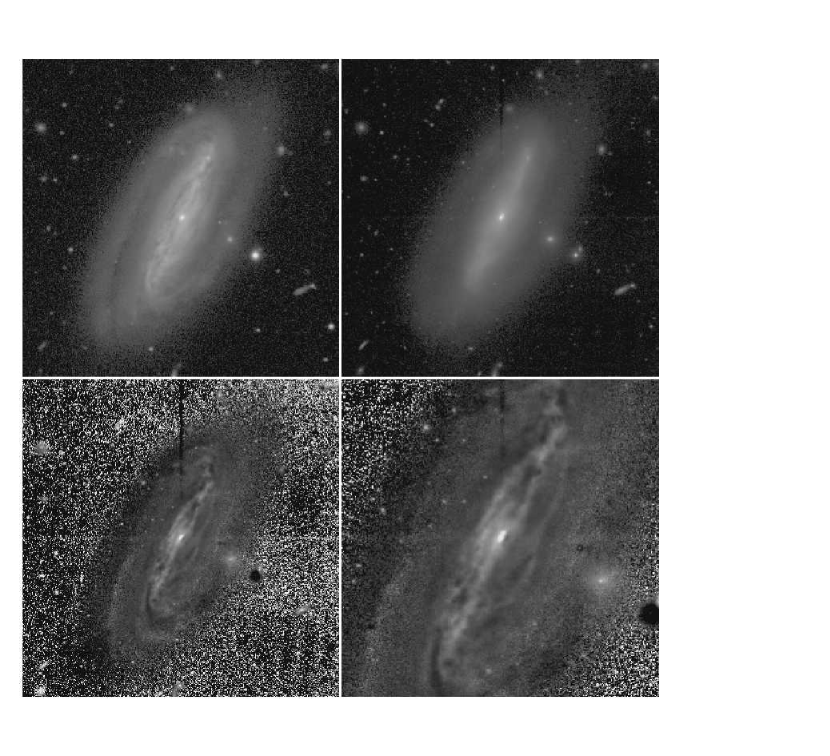
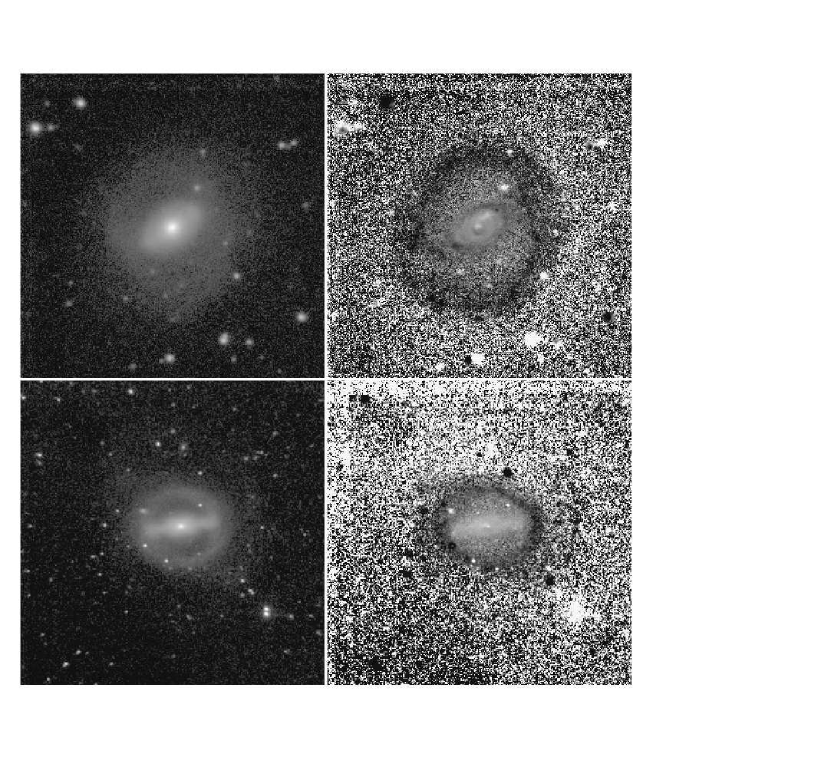
Figures 1- 17 show the de Vaucouleurs Atlas-style images of the 23 galaxies. For seven of the galaxies, only the -band images are shown. For the remaining 16 galaxies, optical images were used to derive color index maps which reveal the star formation and dust distribution in an especially discriminating manner. For several cases, we show the optical image and the color index map on two scales, as well as the -band image. The source of each optical image is indicated in the caption to each figure. These were calibrated using published photoelectric aperture photometry as described in the deVA.
4 Mean Orientation Parameters and Bulge-Disk Properties
To facilitate deprojection of the galaxy images, mean orientation parameters were derived from ellipse fits. The ellipticity and major axis position angle of isophotes at different surface brightness levels were derived by least-squares, and means at large radii were taken to represent the tilt of the disk. The derived values are collected in Table 1 as , the mean disk axis ratio, and , the mean major axis position angle. The table also lists the mean position angle of the bar, the range of radii used for and , as well as the full width at half maximum of the seeing profile.
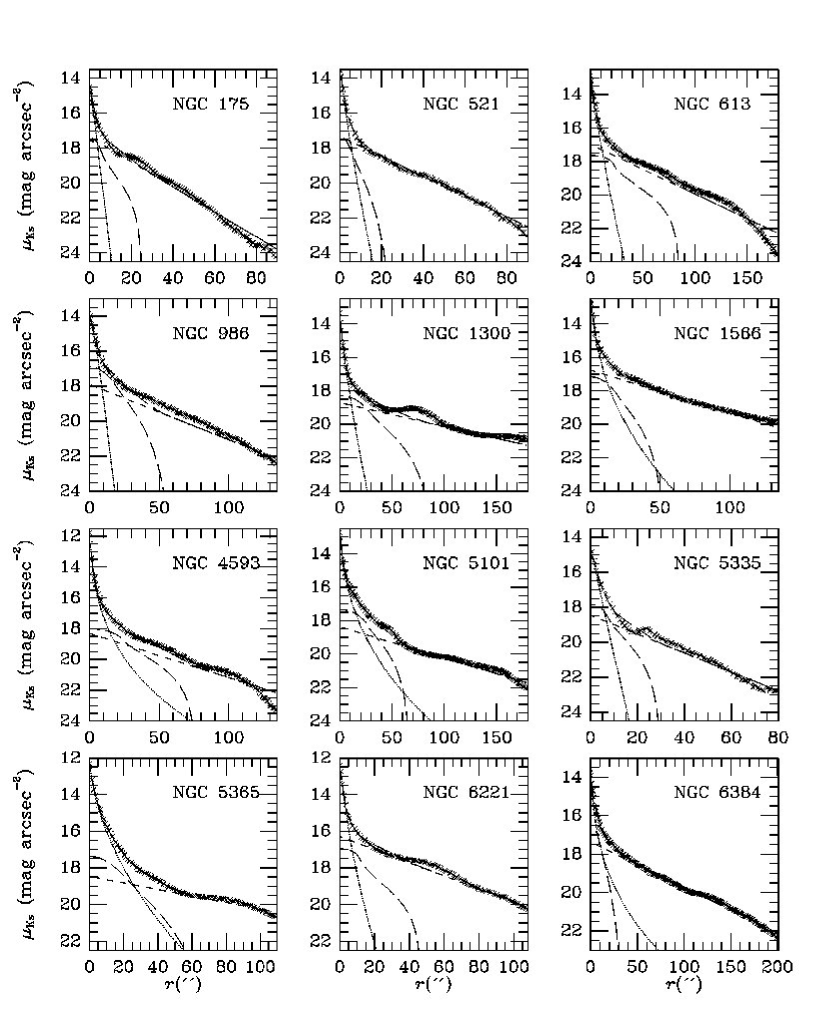
Deprojection involved rotating the image by and stretching it along the -axis by 1/. However, before we could do this, it was necessary to make some allowance for the shape of the bulge. For this purpose, we used the two-dimensional bulge/disk/bar decomposition technique of Laurikainen et al. (2004) to allow for the likely less flattened shape of the bulge. This uses an exponential disk defined by central surface brightness (0) and radial scale length ; a spherical Sersic (1968) bulge model defined by central surface brightness (0), characteristic radius , and radial exponent = 1/, where is the Sersic index; and a Ferrers bar defined by maximum radii and , central surface brightness (0), the angle of the bar relative to the line of nodes , and the bar exponent . The derived parameters are listed in Table 3, including the fractional contributions of the bulge and bar to the total luminosity. Figure 18 shows the quality of the decompositions using azimuthally-averaged surface brightness profiles. The actual fits were not made to such profiles, but to individual pixels. Generally, it was necessary to fix the bar semi-major axis radius, , to get a stable solution.
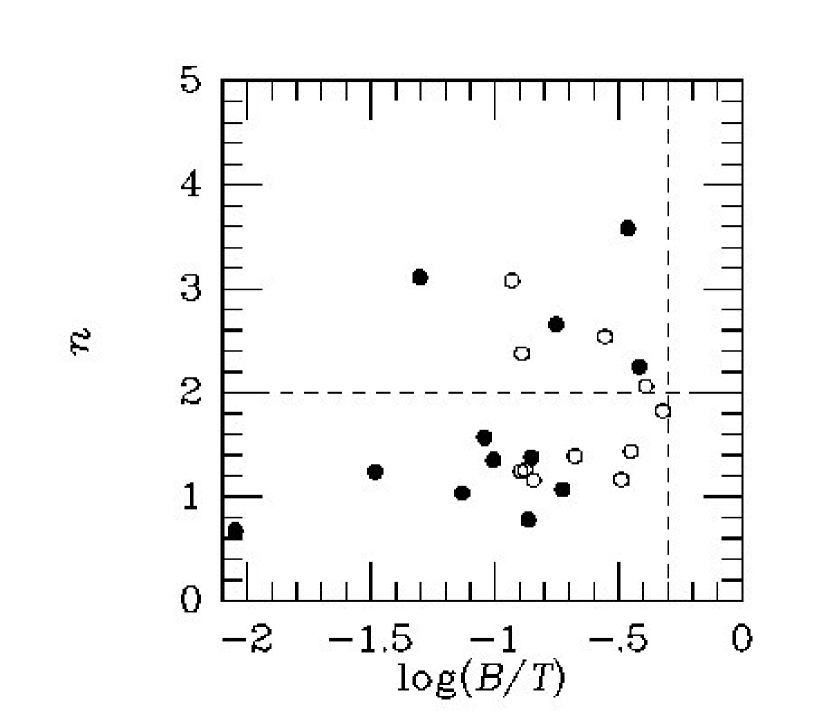
The most important parameters in these kinds of solutions are , , and . The typical uncertainties in these parameters were evaluated using synthetic data by Laurikainen et al. (2005), who showed that the components can be recovered with an accuracy of nearly 5% when a bulge, disk, and bar are fitted simultaneously. Adding extra components beyond these three could change the value further by 5% (Laurikainen et al. 2006). Although additional components, such as nuclear bars, could improve some of our solutions, we have preferred the simpler three-component models since our goal with the decompositions is mainly image deprojection. Nevertheless, it is interesting to examine the properties of the bulges in our sample. Figure 19 shows a graph of Sersic index versus the log of the bulge-to-total luminosity ratio. The vertical and horizontal dashed lines show limits considered by Kormendy and Kennicutt (2004) to distinguish classical bulges from “pseudobulges.” Any bulge having 0.5 was considered by them to be a classical bulge. However, galaxies having 0.5 and 2 were considered most likely to be pseudobulges. In our sample, 15 out of the 23 galaxies fall within this domain. This significant fraction is consistent with the findings of Laurikainen et al. (2007) for a much larger sample.
5 Deprojected Images and Relative Fourier Intensity Amplitudes
In order to derive bar strengths and other properties of the bars in our sample, we need to deproject the images. To eliminate or minimize bulge “deprojection stretch,” the artificial stretching of bulge isophotes due to the less flattened shape of the bulge, we first subtracted the bulge model from the total image as a spherical component. Next, the disk was deprojected using IRAF routine IMLINTRAN in flux-conserving mode, using the adopted orientation parameters in Table 1. The bulge was then added back. In some cases, the assumption of a spherical bulge is not a good approximation, and the process oversubtracts bulge light along the galaxy minor axis. This leads to “decomposition (or spherical bulge) pinch,” where the inner isophotes are pinched (rather than extended) perpendicular to the major axis. Note that both deprojection stretch and decomposition pinch can lead to artificial bar-like features, although these are generally weaker than the actual bars and can be easily distinguished.
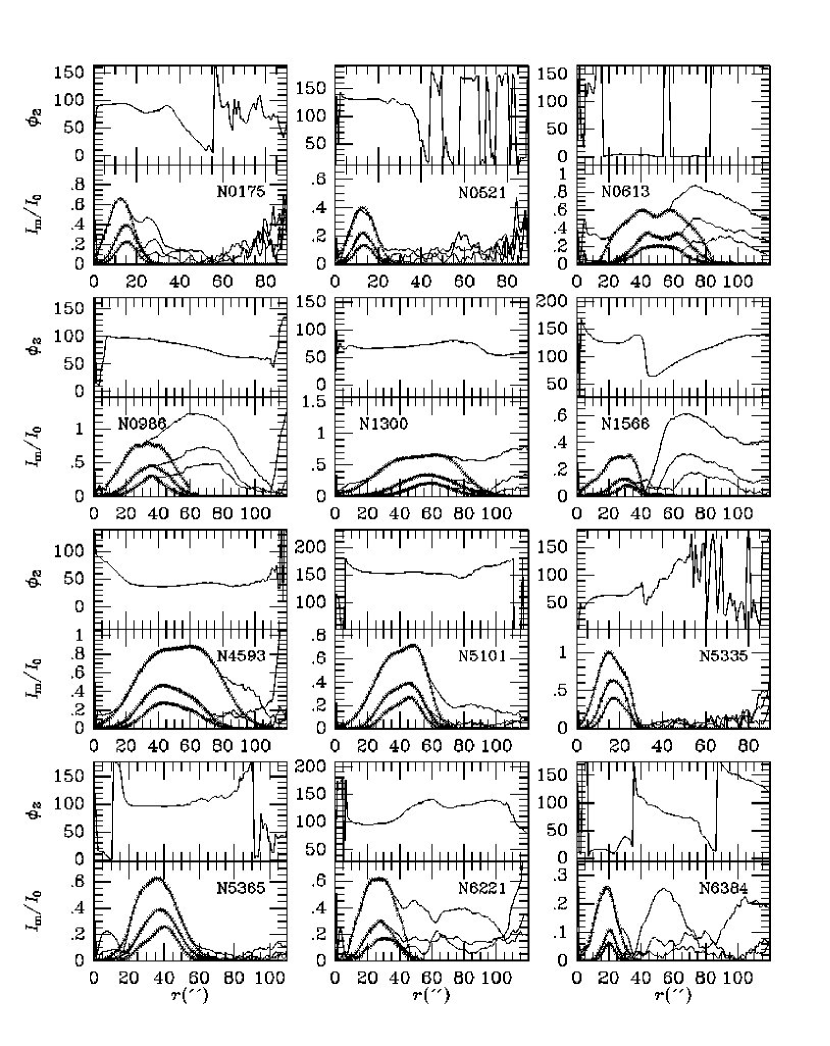
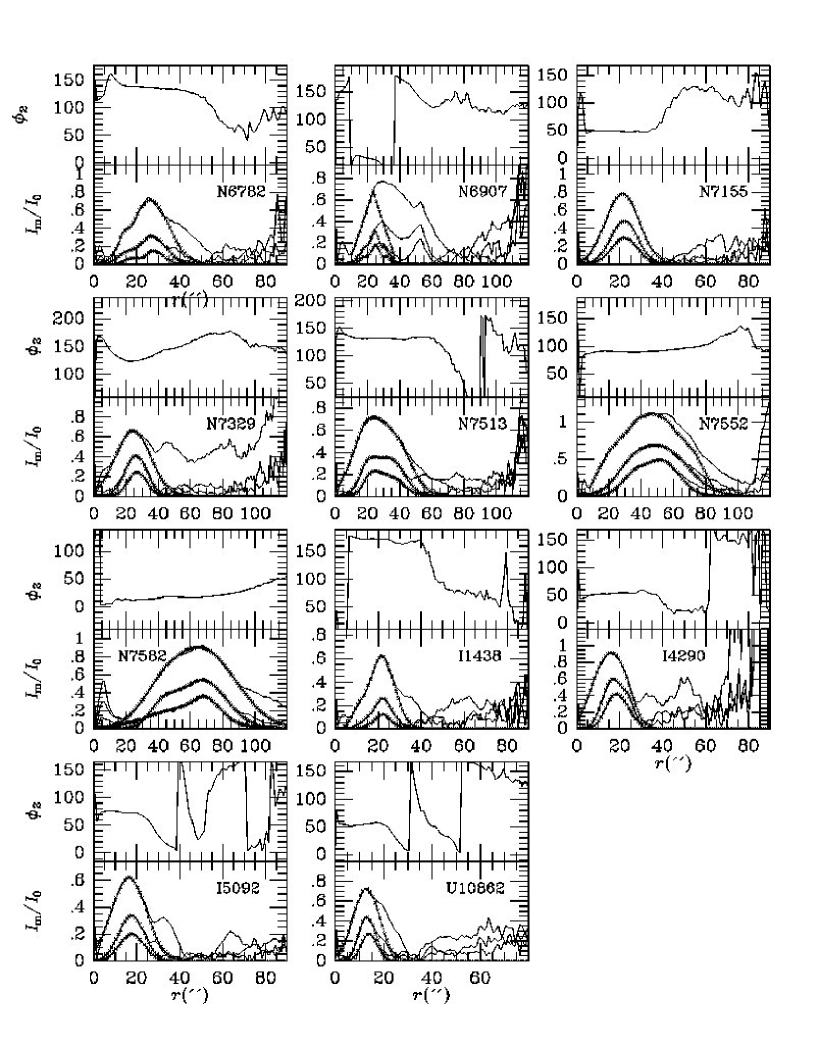
The relative Fourier intensity amplitudes of the galaxies were derived as a function of radius. In each case, we analyzed the amplitudes in the same manner as in Buta, Block, & Knapen (2003) and Buta et al. (2005). To separate the bars from the spirals, in some cases we used the “symmetry assumption” whereby the amplitudes are assumed to decline past a maximum in the same manner as they rose to that maximum. The assumption is based on studies of galaxies where there is little contamination of bar amplitudes by other features. In other cases, we were able to fit one or more gaussians to the amplitudes to allow for more complex features. The results of these analyses are summarized in Figure 20. Table 4 lists the maximum bar =2 and 4 relative amplitudes, and , based on the mappings in Figure 20. Table 5 summarizes gaussian fit parameters for those galaxies where this representation provided a good mapping of the bar. The separated bar and spiral images are shown in Figure 21. No uncertainties are given for the parameters in Tables 4 and 5 because the Fourier profiles are based on averages over many pixels and their statistical uncertainty in the bar regions is very small. Systematic uncertainties in the orientation parameters due, for example, to inaccurate assumptions about intrinsic disk shapes would generally lead to less than 10% uncertainty in the values of and for the average low inclination of 35o for our sample. Uncertainties in and would also generally be less than 10%.
6 Bar Radii
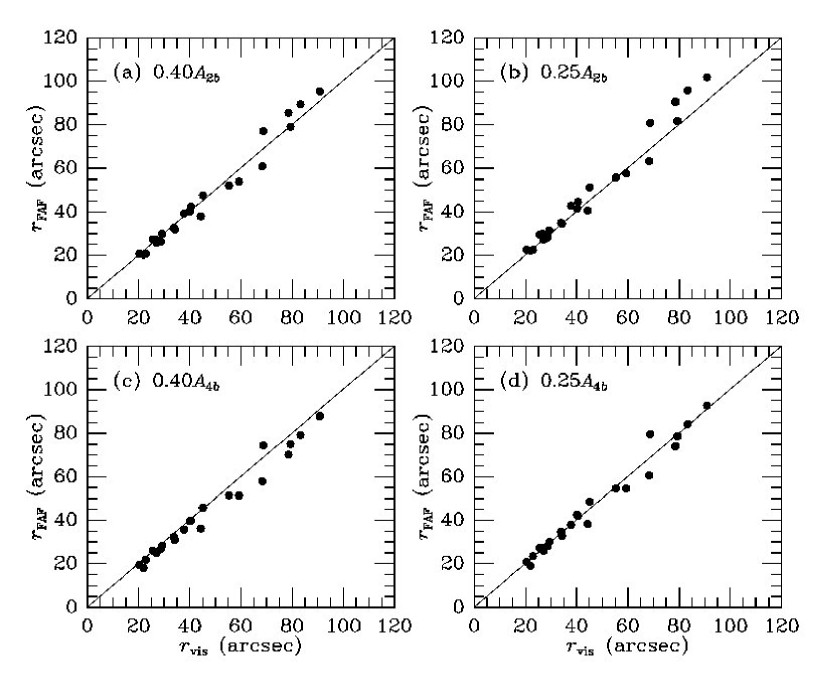
Erwin (2005) presented an analysis of bar radii and argued that bar size must be important because it determines how much of a galaxy is impacted by the bar itself. A variety of methods has been proposed to measure this parameter (see, for example, Athanassoula & Misiriotis 2007; Gadotti et al. 2007), but no single technique works consistently for all possible bars. To estimate bar major axis radii, Erwin used ellipse fits to isophotes which gave both lower and upper limits to bar size. The lower limit was taken as the radius of maximum bar ellipticity (see also Marinova & Jogee 2007). Also, if a bar crossed a ring or lens, he used the radius of the ring or lens as an estimate of the bar size. Here we use another approach: the Fourier mappings of the bars in Figure 20 show that bars do not simply end abruptly but decline smoothly to zero intensity. This suggests that bar radii might be estimated from fractions of the maximum Fourier amplitudes. We ask what fractions well-approximate what appears to be the bar radius from visual inspection of our -band images.
Table 6, column 6 summarizes our visual estimates, considered to be the maximum extents of the features as seen on the images deprojected using our Table 1 orientation parameters. A cursor was placed at each end of the bar on a monitor screen and the coordinates read into a file. The visual bar radius is half the distance between these cursor positions. Figure 22 shows comparisons between and four estimates based on fractions of the maximum Fourier amplitudes and for the bar mappings in Figure 20. These are called “Fourier amplitude fraction radii” in Figure 22. The bar mappings are well-defined for each of our sample galaxies, but often the profile involves more extrapolation than . We found that provides a very good approximation to the visual bar radius, matching over a range of radii from 20′′ to 100′′. However, gives radii somewhat larger than the visual bar radii. Instead, we found that provided a comparably good match to , while tended to slightly underestimate the bar radius. We adopt = as our best estimates, listed in column 5 of Table 6. Using the NED Galactic standard of rest (GSR) distances, the linear bar radii in column 7 of Table 6 were derived. The values are comparable to those estimated by Erwin (2005) for galaxies in the type range of our sample.
7 Bar and Spiral Torque Strengths
The strengths of the bars and spirals were derived by assuming that the -band light distribution traces the mass distribution. This seems reasonable for bar strength, but one might question whether the near-IR is the best choice for the spiral strength. One could argue that the -band would be best for the spiral because it is more sensitive to the cold component, which would be more reactive to the bar forcing. Nevertheless, the old stellar component is still the best tracer for the spiral arm strength. This would be the amplitude of the actual mode in the stellar disk, and would measure its dynamical significance. Note also that Elmegreen & Elmegreen (1985) showed that the arm-interarm contrast is essentially the same in the and bands in grand design spiral galaxies but is much stronger in than for flocculent galaxies. We expect any bar-driven spirals would be grand design.
As in Block et al. (2004), we used the Cartesian-coordinate method described by Quillen, Frogel, & Gonzalez (1994) to derive the gravitational potentials. An exponential density distribution is used for the vertical dimension with a type-dependent scale-height based on the work of de Grijs (1998). From these potentials, the radial and tangential forces were derived, and the bar and spiral strengths were estimated from maps of the ratio , where is the tangential force and is the mean radial (axisymmetric) force, all in the galaxy plane. From a quadrant analysis, the maximum values = were derived as a function of radius. For the bar plus disk images, the maximum of is at radius while for the spiral plus disk images, the maximum of is at radius . The total maximum relative gravitational torque is given by .
Table 7 summarizes the derived maxima. The uncertainties listed in Table 7 are based on the analysis of Buta, Block, & Knapen (2003) and are estimated as percentages of the values. For and , we used 10% for the orientation parameters (meaning 0.1 due to this effect, etc.), 10% for the vertical scale height, 4% for the bar extrapolations, and 10% for the spiral extrapolation, for an average sample galaxy inclined by 35∘. We also allowed for the scatter in the maxima in each quadrant due to asymmetries in the spiral pattern. Since these uncertainties are largely independent, we added them in quadrature. For the error bars on the spiral contrasts and , we used a similar procedure but without any effect of vertical scale height. The error bars are in any case only indicative. The uncertainties in the Table 7 parameters tend to be larger than those for the Tables 4-6 parameters because and involve an uncertain vertical scale-height and , , and are especially sensitive to the extrapolation of the bar. The bar in the present sample with the largest value of is found in UGC 10862, which has a very small bulge and near-IR ansae. These conspire to make the bar strong.
Note that if the forcing due to the dark matter halo is more important at larger radii than at smaller radii, then our values are likely to be more overestimated by ignoring the halo than would our values, since on average. Our analysis assumes a constant mass-to-light ratio. Buta, Laurikainen, & Salo (2004) show using a statistical approach how much the effect on can be for typical high luminosity galaxies. For galaxies of similar luminosities to those in our AAT sample, the inclusion of a halo reduced values by 6% on average. Even if the effect on is twice this amount, it would still be small and have little impact on our results.
The spiral maximum at radius in Table 7 in some cases refers to bright inner arms (e.g., NGC 175), while in others it refers to outer arms (e.g., NGC 521). This depends on how the arms combine with the declining background. In other cases, residual light of an extended oval may contribute to what we call (e.g., NGC 7155). The bar radius from Table 6 correlates well with the maximum radius in an impartial linear relation of the form , with a radius-dependent dispersion of =0.082.
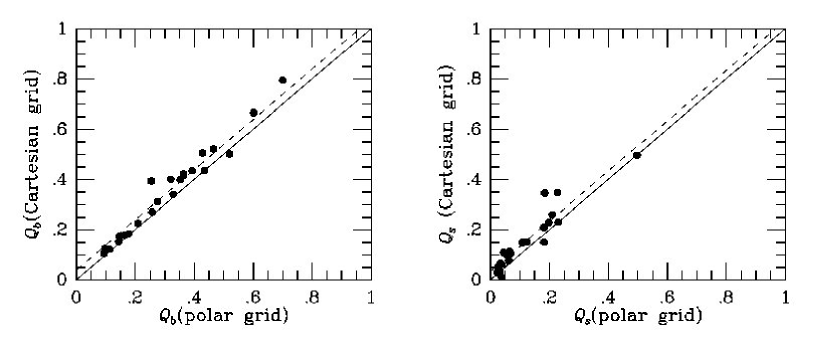
As a check on these results, we also derived the potentials (and the resulting , values) using the polar grid method of Laurikainen & Salo (2002). Figure 23 shows how well the two methods agree for our 23 galaxies. In general, the agreement is good but we find small average offsets: for , the Cartesian values are on average larger than the polar grid values by 0.038 while for they are larger by 0.033. These differences are not due to the integration method (Cartesian versus polar grid) but are likely due to slightly different treatments of the bulge and the vertical scale height in the two independent sets of programs. However, because the differences are virtually the same, they will have little or no effect on a possible correlation between and .
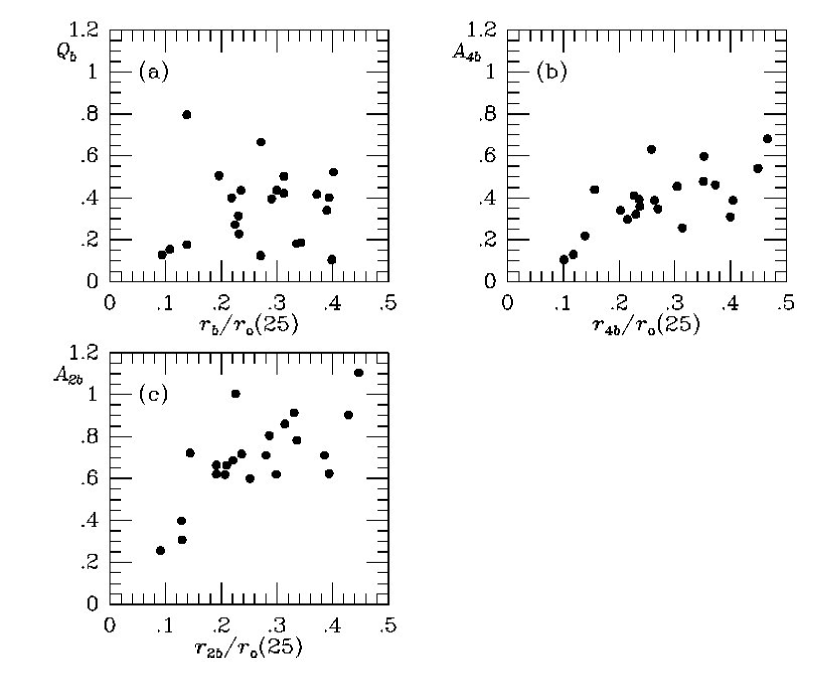
Figure 24 compares and the bar contrast parameters and with the relative radii of these maximum parameters. The radii are normalized to , where is the extinction-corrected isophotal diameter at =25.0 mag arcsec-2 from RC3. The values of and (and and ) are from Table 4, and are based on the same mappings (Figure 20) used to derive . There is little apparent correlation between and , but and do show some correlation. The correlation between and for this sample has already been discussed by Elmegreen et al. (2007). These authors argue that this contrast correlation, in addition to a correlation with central density, implies that bars grow in both length and contrast over a Hubble time through angular momentum transfer to the disk and halo.
Table 8 summarizes the mean values of several parameters from our analysis for those galaxies where single or double gaussians well-represented the relative Fourier profiles. Buta et al. (2006) showed that bars fitted by double gaussians were stronger than those fitted with single gaussians. In the present sample, the single and double gaussian bars have the same relative torque strength on average, while the contrasts are higher for the double gaussian features. The double gaussian features also have higher average values of , bulge-to-total luminosity ratio, and Sersic index, which may conspire to make the torque strengths similar to those of the single gaussian bars.
Laurikainen et al. (2007) noted that strong bars with thin and thick components have double-peaked profiles in all Fourier modes. But in galaxies where only the =2 profile (not the higher Fourier modes) of the bar is double-peaked, the amplitude is most probably contaminated by an inner or outer oval/lens.
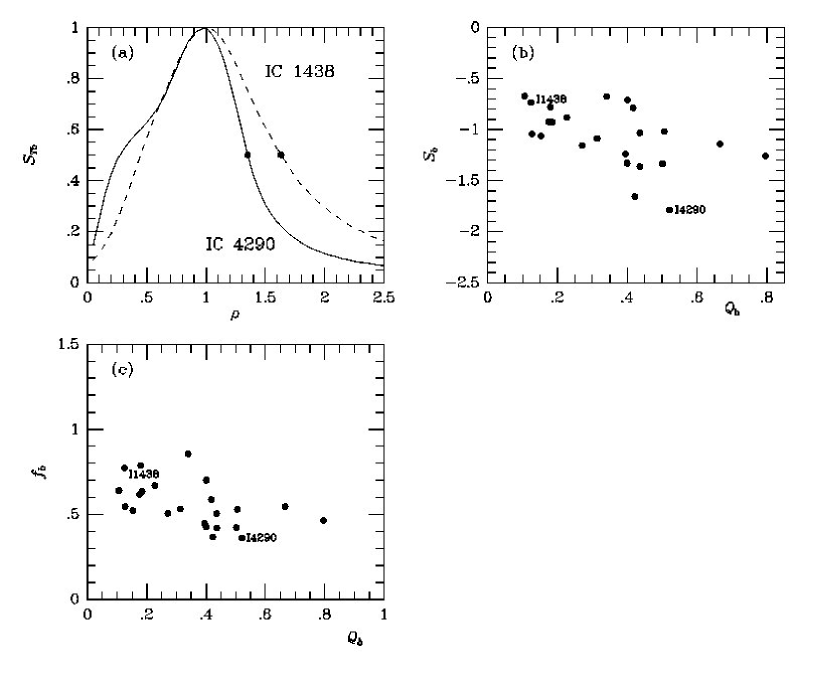
One issue we can examine with our new dataset is the steepness with which the bar declines near its ends. More evolved, stronger bars should have more steeply falling amplitude profiles because their orbits are pushed right up against the resonances. Non-circular orbits and random stellar motions should broaden the bar’s edge. We examine this issue using forcing profiles, rather than the Fourier luminosity profiles, because these most reliably trace how rapidly the significance of the bar declines. Only the maxima of the profiles are compiled in Table 7, which also gives . To remove the effects of distance and scale, we normalize the profiles as versus . Figure 25a shows the normalized profiles for IC 1438 and IC 4290, the former having =0.12 and the latter having =0.52. The curves show that the strong bar in IC 4290 has the more steeply declining normalized bar torque profile. We measure the steepness of the bar on its declining edge as the slope at the point on the profile where drops to 0.5 (filled circles in Figure 25a). Figure 25b shows that, for our 23 galaxies, generally declines with increasing , although with considerable scatter. On average, the bar torque profiles do decline more steeply past the end of the bar for stronger bars than for weaker bars, for our small sample.
We also define the relative bar-end drop-off distance as
where is the radius where the profile drops to 75% of the maximum value, is the radius where the profile drops to 25% of its maximum value, and is again the radius of the maximum from Table 7. This fraction is plotted versus in Figure 25c. The plot shows that like , declines slightly with increasing , which is also consistent with the stronger bars having a steeper decline past the maximum, relative to the bar radius.
We also examined whether and correlated with any other quantities, such as , , , and , but no other significant correlations were found.
8 Description of Individual Galaxies
In this section, bar and spiral strength classes are defined as in Buta & Block (2001) and Buta et al. (2005). Class 0 refers to values less than 0.05, class 1 to values ranging from 0.05 to 0.15, class 2 to values 0.15-0.25, etc.
NGC 175 - The near-IR morphology of this galaxy (Figure 1) is almost as structured as its blue light morphology in the Hubble Atlas (Sandage 1961). The inner pseudoring has a diameter of 13.6 kpc, comparable to the average for SB inner rings as derived by de Vaucouleurs & Buta (1980), after adjustment for distance scale. The 2D decomposition gave an exponential bulge including 7.4% of the total luminosity. Figures 20 and 21 show that a single gaussian component well-represents the bar. Removal of this bar representation from the image leaves an elongated inner pseudoring that is slightly misaligned with the bar axis. This suggests that the bar and spiral in this case have a different pattern speed, because alignment is the normal rule for inner rings and pseudorings (Buta 1995). The bar is strong and corresponds to bar class 4, while the spiral class is 2.
NGC 521 - Figure 3 shows that the - and -band morphologies are similar except that the outermost spiral features are much weaker in . The bar is enveloped by a conspicuous inner pseudoring in the -band that is much weaker in . The deprojected -band diameter of the ring is 14.9 kpc using the NED GSR distance of 69.6 Mpc. The deprojected axis ratio is 0.95. In addition to the inner pseudoring, the color index map in Figure 3 shows a very well-defined, red nuclear ring. In the -band, the ring is a clear dust feature with no recent star formation evident. A visual mapping of the ring in the color index map gives an axis ratio of 0.82 and a diameter of 15.′′4 or 5.2 kpc, unusually large for a nuclear ring. These are close to the face-on values since the galaxy is only slightly inclined. There are no prominent bar dust lanes.
The fitted bulge model is nearly exponential, and corresponds to a Sersic index of =1.26. A single gaussian component well-represents the -band relative Fourier intensity amplitudes, with only a slight departure of the peak =2 amplitude from the gaussian fit. In spite of the conspicuousness of the bar, it is a relatively weak feature and has a bar class of 1 and a “ family” (Buta et al. 2005) of only SAB. The spiral class is 1.
NGC 613 - A complicated object with at least 5 spiral arms, all of which are still prominent in the -band. After deprojection, the inner pseudoring has an axis ratio of 0.67 and a diameter of 2.′46 or 6.3 kpc, and is aligned almost exactly parallel to the bar. The color index map in Figure 4 shows strong leading dust lanes in the bar. The -band image shows a small spiral in the center that in the -band is either a nuclear ansae bar or a nuclear ring highly elongated along the main bar (Böker et al. 2008). This feature is shown in the lower right panel of Figure 4. The projected diameter of the feature is 9.′′8 (0.94 kpc). Peeples & Martini (2006) show a structure map of this same area, illustrating fine details of the dust distribution.
The decomposition yielded a nearly exponential bulge with a flux contribution of 14.4%. However, this is probably an overestimate due to the nuclear bar/ring. The relative Fourier intensities show a bar that is not easily interpreted in terms of single or double gaussians. The double-humped profiles in Figure 20 are a symmetry-assumption mapping that was needed to get the maximum extent of the bar but which fails to account for the significant asymmetry in that feature that is apparent in the spiral plus disk image in Figure 21. After separation, we find that NGC 613 is bar class 4 and spiral class 3.
NGC 986 - This galaxy is characterized by apparently strong bar and spiral patterns. The bar and spiral are closely connected, such that the bar smoothly changes into the spiral. The color index map (Figure 5) shows very well-defined dust lanes on the leading edges of the bar as well as strong red features in the inner parts of the spiral arms. The nuclear region is complicated in both and , and appears to include a small nuclear dust ring 9.′′6 (1.2 kpc) in projected diameter. The short black line in the lower right panel of Figure 5 points to the object we have taken to be the nucleus of the galaxy. From the color index map, this object has blue colors.
The 2D decomposition gave a large value of , 1.277, and a rather large value of bulge-to-total luminosity ratio, 13.7%. The bulge region of NGC 986 is not very smooth and it is likely these values are unreliable. Bar-spiral separation is also not clean in NGC 986 because the bar blends so smoothly with the spiral. In our final analysis, we assumed what little bulge might be present in this galaxy to be as flat as the disk. The bar mapping in Figure 20 does a reasonable job of separation. Conversion of the separated images to a potential gives a bar class of 4 and a spiral class of 5. By this measure, NGC 986 has the strongest spiral of the sample.
Kohno et al. (2008) recently observed NGC 986 in CO(3-2), and found the galaxy’s bar to be rich in dense molecular gas. These authors have suggested that the complex central region of the galaxy is in a growing phase, being fueled by the significant gas in the bar.
NGC 1300 - The bar and spiral pattern in this galaxy are strong and well-defined (Figure 6). The color index map reveals strong leading dust lanes in the bar. Buta et al (2007) show a color index map that reveals a small blue nuclear ring. In the -band, this feature is a smooth, almost circular lens-like feature of projected diameter 9.′′4 (0.9 kpc; see Figure 6, lower right panel). The 2D decomposition gave a nearly exponential bulge including 9.9% of the total -band luminosity.
The bar representation in Figure 20 is a double-gaussian mapping that is somewhat uncertain. Figure 21 shows that this mapping does a reasonable job of separating the bar from the spiral. With this separation, the galaxy is bar class 5 and spiral class 2.
NGC 1566 - The bar lies inside the inner termination points of the bright spiral (Figure 7), as first shown by Hackwell & Schweizer (1983). The 2D decomposition (Figure 18) gave a bulge having Sersic index =2.4 and including 12.9% of the total luminosity. The relative Fourier amplitudes in Figure 20 show an asymmetric =2 profile inside =40′′ that is associated with the inner bar. The symmetry assumption could be applied to all higher order terms but =2. Although within the broad definitions of the classes this galaxy is both bar and spiral class 2, it is the second case in our sample where the spiral is stronger than the bar.
NGC 4593 - Except for the obvious leading bar dust lanes and a nuclear dust ring, the and -band images of this galaxy are very similar. The nuclear dust ring seen in the color index map has a projected diameter of 11.′′0 (1.9 kpc). The 2D decomposition shown in Figure 18 has a Sersic index of 3.6 and a bulge-to-total -band luminosity ratio of 34.5%, providing a possible classical bulge. The relative Fourier intensity amplitudes shown in Figure 20 are well-fitted by double gaussians in all terms; this representation does a reasonable job with the bar-spiral separation (Figure 21). With these images, the bar class is 3 and the spiral class is 1.
NGC 5101 - The and -band images are similar, but the exceptional image quality on the -band image reveals short spiral arcs around the ends of the bar (see lower left panel of Figure 9). The color index map reveals only a weak trace of leading bar dust lanes, in addition to a tightly wrapped pattern of spiral arms that wrap around the bar and which have slightly enhanced blue colors.
The 2D decomposition gave a Sersic index of 2.5 and a bulge contribution of 28%. The relative Fourier amplitudes of the bar are well-represented by double gaussians to =12, while for 12, a single gaussian describes these amplitudes. In the -band, the spiral structure in NGC 5101 is very weak. The derived bar class is 2 and the spiral class is 0.
NGC 5335 - The morphology is characterized by a strong apparent bar and a conspicuous inner ring that is weak near its projected major axis (Figure 1). A visual mapping of the ring in the deprojected image in Figure 21 gives an axis ratio of 0.89 and an alignment nearly perpendicular to the bar, very unusual for an SB inner ring (Buta 1995). The ring also has an enormous linear diameter, 16.8 kpc (54.′′8), also unusual for such features (de Vaucouleurs & Buta 1980).
The 2D decomposition gave an exponential bulge and a bulge-to-total luminosity ratio of 18.8%. The bar is the dominant feature in the relative Fourier amplitudes and is well-fitted by a double gaussian in all even terms to =20 at least. The spiral structure is weak in the -band, and we obtain a bar class of 4 and a spiral class of 0.
NGC 5365 - The -band image in Figure 1 shows a well-defined early-type barred S0 with an extended disk and a trace of an outer ring. A clear secondary bar aligned nearly perpendicular to the primary bar is seen in this image, a feature already noted by Mulchaey et al. (1997; see also Erwin 2004). The 2D decomposition gave a Sersic index of =1.8 and a bulge-to-total luminosity ratio of 0.48, the latter a likely overestimate since the secondary bar was not fitted separately.
A double-gaussian was needed to represent the even Fourier terms in the primary bar of NGC 5365. Only the secondary bar provides any additional significant amplitude. In spite of the apparent strength of the bar, the significant bulge leads to a bar class of only 1.
NGC 6221 - Both the bar and spiral arms in this galaxy show considerable dust content in the color index map in Figure 10. The outer spiral pattern is disturbed and the galaxy is likely interacting, possibly with neighbor NGC 6215 (Koribalski & Dickey 2004). The azimuthally-averaged profile in Figure 18 smooths out much of this structure. The 2D decomposition gave a Sersic index of =1.6 and a B/T ratio of 9.1%. A symmetry-assumption mapping of the relative Fourier intensity profiles of the bar was adopted in Figure 20. The spiral plus disk image in Figure 21 highlights some asymmetry in the bar not accounted for by this mapping.
NGC 6384 - The multi-armed nature of the spiral pattern in the -band is less evident in the -band, where two arms seem to dominate (Figure 11). In the -band image, a weak inner ring surrounds a relatively weak-looking bar. In the color index map, the inner ring surprisingly appears as a red feature. After visually mapping the feature, we find that the blue light inner ring has a projected diameter of 6.6 kpc, an axis ratio of 0.69, and a major axis position angle of 29∘, while the red inner ring has a diameter of 5.2 kpc, an axis ratio of 0.65, and a major axis position angle of 39∘. The dust ring is largely confined to the inner edge of the inner ring and is enhanced on the near side, east of the center. The -band inner ring is not prominent in the color index map.
The 2D decomposition gave a bulge with Sersic index =3.1 and including 11.8% of the total -band luminosity. The 2D decomposition left some decomposition pinch in the deprojected image of NGC 6384. After removing this area, we find that the bar of NGC 6384 is largely a single gaussian type.
NGC 6782 - NGC 6782 is an exceptional ringed barred spiral. Although spiral structure is clearly evident in the -band image in Figure 12, the appearance of the galaxy in the -band is as a late S0, or type (R)SB(r)0+. The object is well-known as a double-barred and triple-ringed system, and was recently interpreted as type (R1R)SB(r)a by Buta et al. (2007). The color index map shows the strong leading dust lanes and nearly circular blue star-forming nuclear ring. The galaxy was the subject of a dynamical study by Lin et al. (2008), who interpreted the main features in terms of orbit resonances with the primary bar.
The 2D decomposition shown in Figure 18 gave a Sersic index =2.1 and a B/T of 40.8%. The latter is likely to be an overestimate because we have not taken into account the secondary bar. The bar of NGC 6782 is well-represented by a double-gaussian, although this does not include all of the light of an extended oval which fills the deprojected minor axis of the outer ring. Bar-spiral separation gives a bar class of 2 and a spiral class of 0. The family of NGC 6782 is SAB.
NGC 6907 - The deprojected -band image in Figure 13 shows what could be interpreted as a bar in the inner regions, but the feature blends so smoothly with the spiral that the relative Fourier amplitudes do not clearly distinguish it and the phase of the =2 component is only approximately constant in the apparent bar region. The bar mapping in Figure 20 is imprecise since there is considerable asymmetry in the apparent bar, but nevertheless it provides a reasonable separation. The resulting bar and spiral classes are 3, with the spiral stronger than the bar.
The color index map in Figure 13 shows that red colors permeate the apparent bar region. The red arm which breaks from the west end of the bar twists sharply eastward and is unusual.
The 2D decomposition gave a nearly exponential bulge having a B/T of 12.7%.
NGC 7155 - The -band image in Figure 1 shows a well-defined SB0 galaxy with a prominent bar. The image also shows no evidence for a secondary bar. There is a faint trace of a diffuse inner ring.
The 2D decomposition gave a Sersic index of =1.4 and a B/T of 35.6%. Figure 20 shows that a single gaussian well-represents the relative Fourier amplitudes of the bar in NGC 7155. The bar class is 2 and there is no significant spiral.
NGC 7329 - The images in Figure 14 show a well-developed intermediate type spiral where only the inner arms are prominent in the -band. The color index map shows mostly red colors in the bar region, but the map is uncertain because the seeing on the -band image is much poorer than on the -band image. The 2D decomposition gave a Sersic index of =1.4 and a B/T of 21.1%. The deprojected -band image shows some decomposition pinch in the inner parts of the bar. This is smoothed over in the bar plus disk image, but appears as a vertically-oriented oval in the spiral plus disk image. We found that a single gaussian well-represents the relative Fourier profiles of the bar, although the =2 term is complicated by both the significant spiral structure and the decomposition pinch. The separated images gave a bar class of 3 and a spiral class of 1.
NGC 7513 - The -band image in Figure 2 shows a well-defined bar and faint spiral arms. The 2D decomposition (Figure 18) gave an approximately exponential bulge with a of only 3.3%. The bar was found to be well-represented by a double-gaussian for all even Fourier terms to =20 (Figure 20). However, we found that including only even Fourier terms provided a poor mapping of the bar. Our analysis in this case includes extrapolations of odd Fourier terms in the same manner as the even terms. Figure 21 shows that there is little residual asymmetry in the bar when we account for such terms. From the separated images, NGC 7513 is found to have a very strong bar with a bar class of 7 and a spiral class of 1. It has the weakest known spiral in the presence of one of the strongest known bars.
NGC 7552 - The images in Figure 15 show a strong bar and conspicuous spiral pattern in a relatively face-on disk. The bar shows strong dust absorption, and there is a blue nucleus. The 2D decomposition gave a Sersic index of =2.2 and a of 38.4%. The relative Fourier amplitudes (Figure 20) show a dominant bar that is best represented by the symmetry assumption for =2 and a double gaussian by all even terms having 2. The residual spiral plus disk image in Figure 21 shows some asymmetry in the bar region. From the separated images, the bar class is 4 while the spiral class is 1.
NGC 7582 - Except for a higher inclination, this galaxy is very similar to NGC 7552. The bar is very dusty and the spiral is fairly conspicuous in the -band (Figure 16). The 2D decomposition gave a Sersic index of =2.7 and a of 17.8%. The relative Fourier amplitudes (Figure 20) are well-fitted by double-gaussians in all even terms to =20. After deprojection, the images show strong decomposition pinch in the inner regions, and some asymmetry in the bar region is highlighted in the spiral plus disk image (Figure 21). The separated images gave a bar class of 4 and a spiral class of 1.
IC 1438 - The -band image in Figure 17 shows a nearly face-on, weakly-barred galaxy with a faint outer ring. The color index map shows enhanced star formation in nuclear, inner, and outer rings/pseudorings. The 2D decomposition (Figure 18) gave a nearly exponential bulge and a of 32.5%. The mapping of the bar in Figure 20 required no special treatment (either gaussian or symmetry assumption) since the Fourier amplitudes decline to zero near the ends of the bar for each term. The =2 term is more complicated than =4 and 6 because the primary bar is imbedded within a clear oval that contributes mainly to =2. From the separated images in Figure 21, the galaxy is bar class 1 and spiral class 1 with the bar stronger than the spiral.
IC 4290 - The bar and inner ring are the most conspicuous features seen in the -band image (Figure 17). Both features are also seen in the color index map. The galaxy is relatively face-on and a visual mapping of the deprojected inner ring gave a diameter of 18.4 kpc, an axis ratio of 0.89, and (within 8∘) an alignment nearly parallel to the bar. The bar itself has a strong inner boxy zone noted in previous studies by Buta & Crocker (1991) and Buta et al. (1998). The 2D decomposition gave a nearly exponential bulge and a of 14.1%. The relative Fourier amplitudes in the bar are well-represented by double gaussians for all even terms to =18 (Figure 20). The separated images (Figure 21) gave a bar class of 5 and a spiral class of 1.
IC 5092 - The -band morphology of this galaxy is in the unusual form of an s-shaped barred spiral encompassed by a conspicuous outer ring (Figure 2). The 2D decomposition gave a Sersic index of =3.1 and a of 5.0% (Figure 18). A single gaussian was adopted for the bar mapping in Figure 20. The separated images (Figure 21) gave a bar class of 5 and a spiral class of 2.
UGC 10862 - The bar in this late-type spiral is unusual: it appears in the form of a highly elongated ring with ansae. This character is shown best in the unsharp mask image in Figure 2. We have no optical images of this galaxy that can be used to determine the colors of the bar features. The 2D decomposition gave a bulge with a Sersic index of =0.68 and a of 0.9%. The bulge is weak and the solution may not be reliable. The bar mapping in Figure 20 uses a single gaussian representation and the separated images in Figure 21 gave a bar class of 8 and a spiral class of 2, the strongest bar in the sample.
9 Discussion: Do the Stronger Bars Have Stronger Spirals?
We investigate this issue not only using as a measure of spiral strength, but also the =2 and 4 spiral contrasts. The reason for including the spiral contrasts is because these can be considered the response to the spiral driver, the bar torque. The spiral torque is not the same as the response amplitude, but is diluted by the inner bulge and the bar radial force.
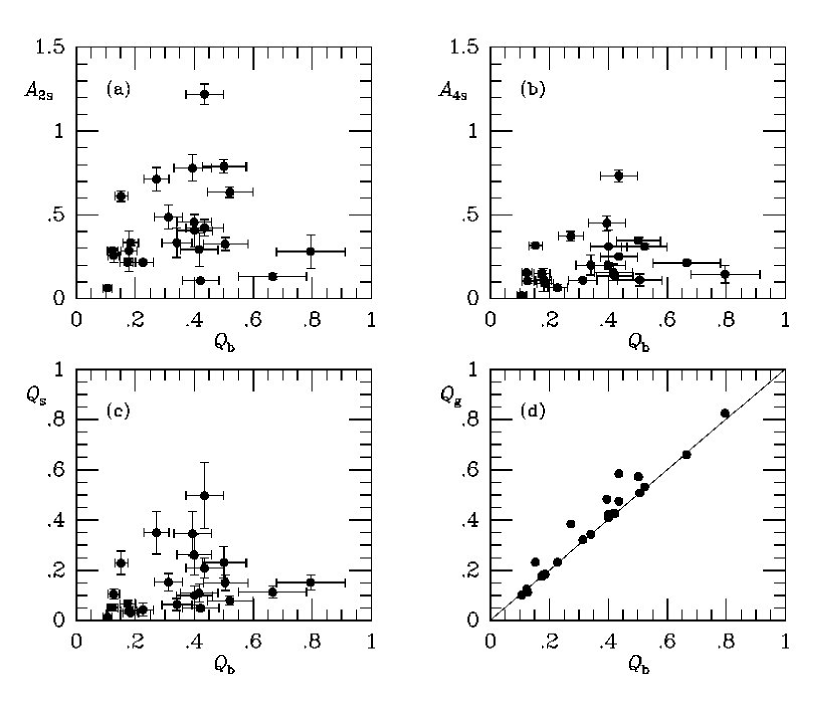
Figure 26 shows graphs of spiral contrast, spiral strength, and total maximum relative non-axisymmetric torque strength versus bar strength , parameters all listed in Table 7. The versus plot is shown only to highlight that for a sample like ours, is also a good indicator of bar strength. The spiral contrasts and were estimated from the spiral plus disk images after separation of the bar. Note that the radii of these maxima (also listed in Table 7) are often comparable but can differ considerably.
Figure 26 shows that the spiral parameters , , and all have little correlation with . (We note that the strongest spiral occurs for intermediate values of .) We can nevertheless quantify the correlations with a few statistical tests using programs from Press et al. (1986). For the 23 galaxies, the linear correlation coefficient for the plot is =0.26 and the null hypothesis of zero correlation is disproved only at the 22.5% significance level. The Spearman rank-order correlation coefficient is =0.41 with a significance level of 5%, while the Kendall Tau rank coefficient is =0.27 with a significance level of 7%. Similar parameters for the plot are =0.16 ( 47%), =0.24 ( 27%), and =0.16 ( 29%). Similar parameters for the plot are =0.27 ( 22%), =0.39 ( 7%), and =0.25 ( 10%). For versus , the non-parametric rank-order coefficients don’t completely rule out some correlation, but any correlation is weak. This is certainly partly due to the small number of galaxies in our present sample.
On the other hand, (and to some extent also and ) will have an inverse correlation with due to the nature of bar-spiral separation. In a reliable separation, the radial profiles of the torques for the bar and spiral must lie wholly within the curve for the total torque. This leads to correlated uncertainties in and : if the bar is overestimated, then the spiral is underestimated and vice versa. In principle, this could weaken a real positive correlation between and if the radial torque curves for the bar and the spiral significantly overlap. However, for 19 of the 23 galaxies in our sample, the curves for the bar and the spiral (or other outer components) do not greatly overlap. The worst cases are NGC 613, 986, 1300, and 6907 (see Figure 21). Also, Buta, Block, & Knapen (2003) showed that a 10% uncertainty in for the bar Fourier mapping would move a galaxy like NGC 6951 (=0.28, =0.21) along a line having / =0.044/0.021 =2.1. Thus, the correlated uncertainties may spread the points out more in than in . Since NGC 6951 is a very typical case of significant overlap between the bar and the spiral (see Figure 2 of Buta, Block, & Knapen 2003), and the effect is still small, we conclude that correlated uncertainties between and are not causing a significant false correlation, nor masking completely a real one, between and over all the data points in our sample.
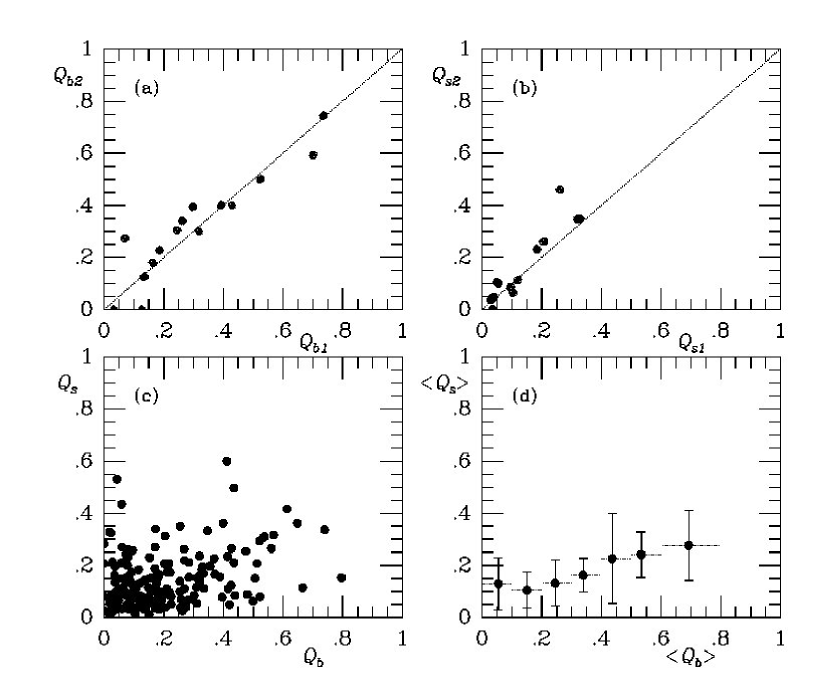
In Figure 27c, we have combined our 23 galaxies with previous studies of bar and spiral strengths. This graph shows versus for 177 galaxies including the samples of Buta et al. (2005), Block et al. (2004), and six early-type spirals from Buta (2004), in addition to the AAT sample galaxies. For 15 galaxies having two sources of parameters, the values were averaged so that only a single point is plotted. The agreement between duplicate values, which involves calculations either from OSUBGS -band images (the and values) or from images (the and values), is shown in Figure 27a,b. No error bars are indicated on the individual points in Figure 27c, but the errors would be similar to those shown in Figure 26c. Figure 27d shows means of in bins of indicated by the dotted horizontal lines. The correlation analysis for this sample gives =0.35, =0.31, and =0.22, all fairly low values but with probabilities indicating a significant correlation. We see in panel (b) that the means of do increase slightly with increasing . However, there is little correlation for 0.3. The most interesting case added by the AAT sample is NGC 7513 which, as we have noted, is a class 7 bar accompanied by only a weak class 1 spiral.
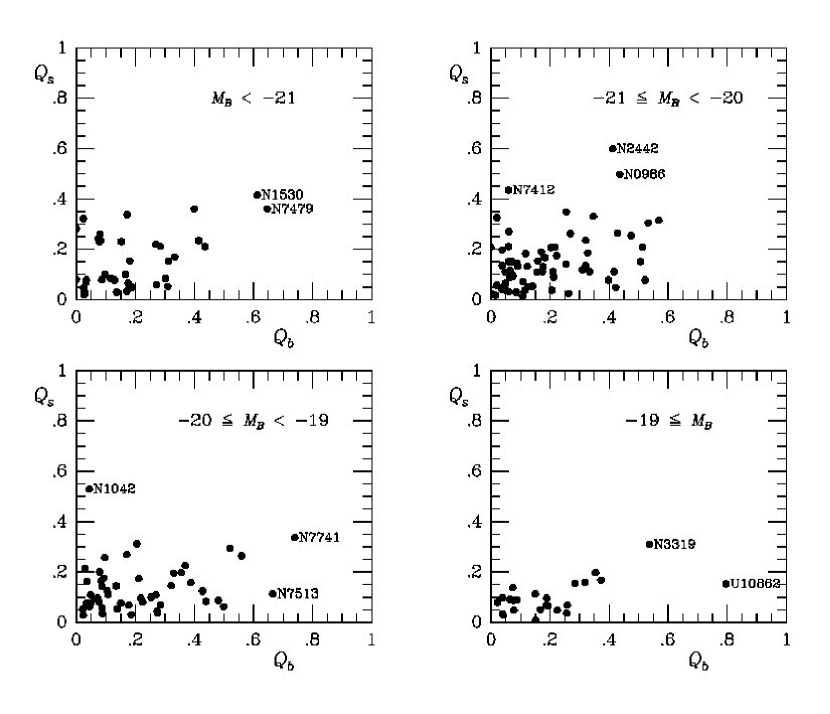
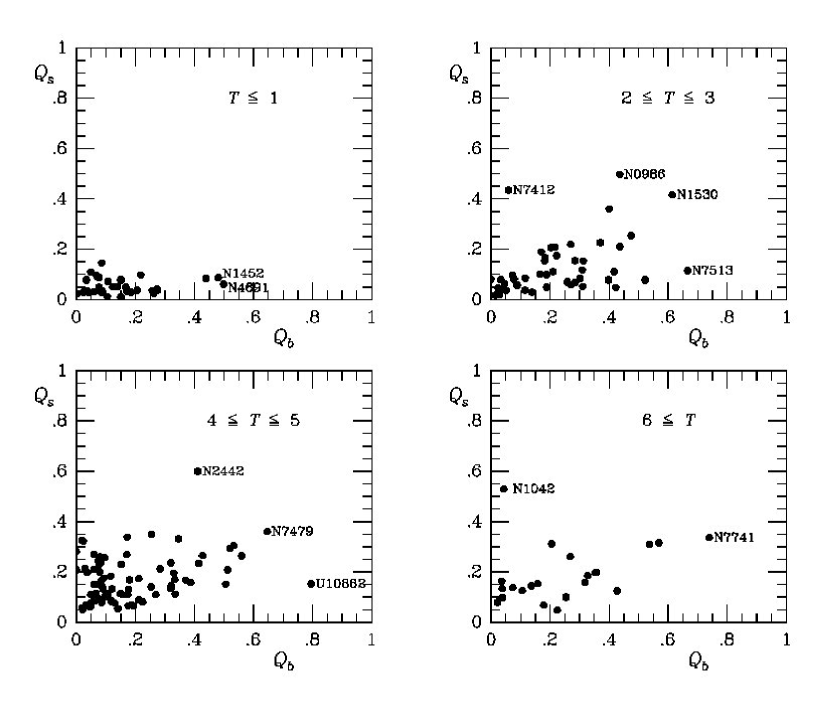
Figures 28 and 29 show plots of versus for the combined sample of 177 galaxies, but subdivided according to absolute blue magnitude and RC3 numerical stage (type) index. Several individual galaxies are labeled for reference. These plots reveal in a more convincing way that some correlation between and is indeed present. Among the more luminous galaxies, the strongest bars have the strongest spirals (NGC 1530, 7479). Among intermediate luminosity galaxies, NGC 1042 and 7412 stand out as spiral outliers at low , although they appear to be relatively normal late-types. NGC 1042 is classified as type SAB and NGC 7412 as type SB in RC3, yet only weak bars were detected in the near-infrared. These galaxies are also outliers in the rightmost panels in Figure 29. Only weak trends are evident in most of the panels, in the sense of a slow increase in spiral strength with increasing bar strength. Two of the strongest bars with the weakest spirals that we added, NGC 7513 and UGC 10862, are of lower luminosity than cases like NGC 986, 1530, and 7479 which have very strong spirals. The most significant-looking correlations appear for later types.
On the basis of 17 spirals, Block et al. (2004) found a correlation between and and suggested that this implies that bars and spirals grow together and have the same pattern speed. Our comparably-sized AAT sample also supports this finding but shows in addition that some very strong bars can have rather weak near-infrared spirals.
These results suggest that some spirals probably are driven responses to a strong bar, although we may need more information to decide which ones. We suggest that cases like NGC 986, 1530, and 7479 are in this category. All three of these objects have been analyzed using the potential-density phase-shift method (Zhang & Buta 2007), and all three show phase-shift distributions consistent with a single pattern speed of the main bar and spiral. Zhang & Buta (2007) discuss NGC 1530, while Buta & Zhang (2008) will provide the information on NGC 7479. We will show the phase-shift results for NGC 986 in a separate paper, where we will also show that NGC 175 has a phase-shift distribution consistent with a decoupling between the spiral and the bar.
We suggested in section 1 that bars may drive spirals only when the bar is growing or if there is gaseous dissipation. We suspect that there could be a saturated state where there is a bar but it cannot do much to drive a spiral. An example of such saturation is an SB0 galaxy. All the stars are in steady orbits, and nothing is growing fast enough or dissipating fast enough to be a significant source of direction. A large galaxy with a small inner bar is also not likely to have a bar-driven spiral. A variety of factors undoubtedly conspire to make the scatter significant in a plot of versus .
10 Conclusions
We have analyzed near-infrared images of 23 barred galaxies covering a wide range of types and apparent bar strengths. Using Fourier techniques, we have separated the bars from the spirals and have derived maximum relative bar and spiral torque strengths. Our results are as follows:
1. The sample is morphologically diverse and includes strong two-armed barred spirals as well as multi-armed barred spirals.
2. As in previous studies (e.g, Buta et al. 2005, 2006), the relative Fourier intensity amplitudes of some of the bars in this sample can be mapped with single and double gaussian representations. Others can be mapped with the symmetry assumption (Buta, Block, & Knapen 2003).
3. We showed that Fourier amplitude fractions from =2 and 4 bar Fourier profiles could be a useful way to define bar radii.
4. We showed that stronger bars have relatively sharper ends. This could mean that the orbits crowd an outer resonance, as if the volume in phase space that contains bar-reinforcing orbits is nearly filled.
5. In answer to our main question, we find weak but definite indications that stronger spirals are associated with stronger bars. This is consistent with our previous findings, but two of the galaxies in our present sample, NGC 7513 and UGC 10862, show that exceptionally strong bars can have weak near-infrared spirals. Some galaxies with strong bars, like NGC 986, do have strong spirals. Because spirals having bars with 0.4 are very rare, our study is still affected by small number statistics at the strong bar end.
Thus, our main conclusion of this study is similar to that of Block et al. (2004): some bars and spirals probably grow together in a global disk instability, leading to the average increase of with for 0.3. For 0.3, bars and spirals may be more independent features in general. Cases where the strength of the bar and the spiral are comparably large, as in NGC 986, could be genuine “bar-driven” spirals. Nevertheless, the existence of cases like NGC 7513 and UGC 10862, which lie in what was previously an empty region in the , plot, shows that other factors probably complicate the relationship between bar and spiral torque strengths.
Although our analysis did not provide a definitive answer to the question posed in the title of this paper, owing in part to the limitations of our samples as well as the depth and quality of some of the near-IR images used, this situation will change soon with the Spitzer Survey of Stellar Structure in Galaxies (S4G) (Sheth et al. 2009). This survey will provide a nearly complete sample of 2300 galaxies of all types within 40Mpc to a depth that would be very difficult to achieve in the -band from the ground. With such a large sample, we can improve the statistics in all regions of the , diagram and further examine the questions we have raised here.
We thank Emma Allard for help during the observations and with the data reduction, Stuart Ryder for his support during the observing run at the AAT, and the anonymous referee for helpful comments. RB acknowledges the support of NSF Grant AST 05-07140 to the University of Alabama. JHK acknowledges support through IAC project 3I/2407. DME acknowledges publication support from the Vassar College Research Committee. HS and EL acknowledge the support from the Academy of Finland. IP acknowledges support from the Mexican foundation CONACyT under project 35947-E. DLB warmly thanks the Board of Trustees of the Anglo-American Chairman’s Fund for their financial support. This research has made use of the NASA/IPAC Extragalactic Database (NED), which is operated by the Jet Propulsion Laboratory, California Institute of Technology, under contract with NASA.
REFERENCES
Athanassoula, E. & Misiriotis, A. 2002, MNRAS, 330, 35
Block, D. L. & Wainscoat, R. J. 1991, Nature, 353, 48
Block, D. L., Puerari, I., Frogel, J. A., Eskridge, P. B., Stockton, A., Fuchs, B. 1999, Ap&SS, 269, 5
Block, D. L., Buta, R., Knapen, J. H., Elmegreen, D. M., Elmegreen, B. G., & Puerari, I. 2004, AJ, 128, 183
Böker, T., Falcón-Barroso, J., Schinnerer, E., Knapen, J. H., & Ryder, S. 2008, AJ, 135, 479
Buta, R. 1995, ApJS, 96, 39
Buta, R. 2004, Astrophysics and Space Science Library, 319, 101
Buta, R., Block, D. L., and Knapen, J. H. 2003, AJ, 126, 1148
Buta, R. J., Corwin, H. G., & Odewahn, S. C. 2007, The de Vaucouleurs Atlas of Galaxies, Cambridge: Cambridge U. Press (deVA)
Buta, R. & Crocker, D. A. 1991, AJ, 102, 1715
Buta, R., Alpert, A., Cobb, M. L., et al. 1998, AJ, 116, 1142
Buta, R., Vasylyev, S., Salo, H., and Laurikainen, E. 2005, AJ, 130, 506
Buta, R. & Zhang, X. 2008, in preparation
Combes, F. & Sanders, R. H. 1981, A&A, 96, 164
de Grijs, R. 1998, MNRAS, 299, 595
de Vaucouleurs, G. and Buta, R. 1980, ApJS, 44, 451
de Vaucouleurs, G., de Vaucouleurs, A., Corwin, H. G., Buta, R. J., Paturel, G., & Fouque, P. 1991, Third Reference Catalog of Bright Galaxies (New York: Springer) (RC3)
Elmegreen, B. G. & Elmegreen, D. M. 1985, ApJ, 288, 438
Elmegreen, B. G., Elmegreen, D. M., & Hirst, A. C. 2004, ApJ, 612, 191
Elmegreen, B. G., Elmegreen, D. M., Knapen, J. H., Buta, R. J., Block, D. L., & Puerari, I. 2007, ApJ, 670, L97
Elmegreen, D. M. & Elmegreen, B. G. 1982, MNRAS, 201, 1021
Erwin, P. 2004, A&A, 415, 941
Erwin, P. 2005, MNRAS, 364, 283
Eskridge, P. B., Frogel, J. A., Pogge, R. W., et al. 2002, ApJS, 143, 73
Gadotti, D, Athanassoula, E., Carrasco, L., Bosma, A., de Souza, R. E., Recillas, E. 2007, MNRAS, 381, 943
Galaz, G., Villalobos, A., Infante, L., & Donzelli, C. 2006, AJ, 131, 2035
Hackwell, J. A. and Schweizer, F. 1983, ApJ, 265, 643
Hameed, S. & Devereaux, N. 1999, AJ, 118, 730
Jogee, S. et al. 2004, ApJ, 615, 105
Kennicutt, R. C. et al. 2003, PASP, 115, 928
Knapen, J. H., Shlosman, I., & Peletier, R. F. 2000, ApJ, 529, 93
Kohno, K. et al. 2008, PASJ, 60, 457
Koribalski, B. & Dickey, J. M. 2004, MNRAS, 348, 1255
Kormendy, J. & Norman, C. A. 1979, ApJ, 233, 539
Kormendy, J. and Kennicutt, R. 2004, ARAA, 42, 603
Laurikainen, E. & Salo, H. 2002, MNRAS, 337, 1118
Laurikainen, E., Salo, H., & Buta, R. 2004, ApJ, 607, 103
Laurikainen, E., Salo, H., & Buta, R. 2005, MNRAS, 362, 1319
Laurikainen, E., Salo, H., Buta, R., Knapen, J., Speltincx, T., & Block, D. L. 2006, MNRAS, 132, 2634
Laurikainen, E., Salo, H., Buta, R., & Knapen, J. H. 2007, MNRAS, 381, 401
Lin, L.-H., Yuan, C., & Buta, R. 2008, arXiv0805.3613
Lynden-Bell, D. & Ostriker, J. P. 1967, MNRAS, 136, 293
Marinova, I. & Jogee, S. 2007, ApJ, 659, 1176
Menendez-Delmestre, K., Sheth, K., Schinnerer, E., Jarrett, T., & Scoville, N. 2007, ApJ, 657, 790
Mulchaey, J. S., Regan, M. W., & Kundu, A. 1997, ApJS, 110, 299
Peeples, M. S. & Martini, P. 2006, ApJ, 652, 1097
Press, W. H. et al. 1986, Numerical Recipes
Regan, M. & Elmegreen, D. 1997, AJ, 114, 965
Quillen, A. C., Frogel, J. A., & González, R. A. 1994, ApJ, 437, 162
Sersic, J. L. 1968, Atlas de galaxias Australes, Cordoba, Argentina: Observatorio Astronomico
Sheth, K. et al. 2008, ApJ, 675, 1141
Sheth, K. et al. 2009, Spitzer Proposal ID #60007
Toomre, A., 1969, ApJ, 158, 899
Toomre, A., 1981, in The Structure and Evolution of Normal Galaxies, S. M. Fall, ed., Cambridge, Cambridge University press, p. 111
Verley, S., Combes, F., Verdes-Montenegro, L., Bergond, G., & Leon, S. 2007, A&A, 474, 43
Yuan, C. & Kuo, C.-L. 1997, ApJ, 486, 750
Zhang, X. & Buta, R. 2007, AJ, 133, 2584
| Galaxy | Type | range | FWHM | Ori. | |||
|---|---|---|---|---|---|---|---|
| disk | disk | bar | (′′) | (pix) | pars. | ||
| 1 | 2 | 3 | 4 | 5 | 6 | 7 | 8 |
| NGC 175 | SB(s)ab | 0.9650.002 | 32.51.5 | 125.1 | 54- 74 | 3.06 | |
| NGC 521 | SB(s)bc | 0.9800.002 | 25.87.3 | 157.3 | 94-111 | 2.47 | |
| NGC 613 | SB(rs)bc | 0.7490.003 | 121.50.4 | 122.8 | 150-205 | 2.59 | |
| NGC 986 | (R)SB(rs)b | 0.8220.001 | 141.62.0 | 54.8 | 111-123 | 2.98 | |
| NGC 1300 | SB(s)b | 0.8490.019 | 117.21.2 | 106.6 | 185-195 | 2.85 | |
| NGC 1566 | (R)SAB(s)bc | 0.8870.004 | 49.20.8 | 17.2, 2.7 | 117-153 | 3.29 | |
| NGC 4593 | (R′)SB(rs)ab | 0.7370.004 | 99.50.5 | 54.2 | 117-127 | 3.21 | |
| NGC 5101 | (R1R)SB(s)a | 0.9290.003 | 145.00.5 | 121.4 | 164-184 | 2.95 | |
| NGC 5335 | SB(r)b | 0.8440.003 | 95.40.6 | 152.7 | 51- 67 | 3.76 | |
| NGC 5365 | (R)SB0- | 0.5830.002 | 6.80.4 | 112.0 | 85-105 | 2.60 | |
| NGC 6221 | SB(s)bc pec | 0.6650.009 | 12.40.3 | 113.9 | 110-164 | 2.64 | |
| NGC 6384 | SAB(r)bc | 0.6050.003 | 30.60.3 | 35.9 | 230-261 | 2.72 | |
| NGC 6782 | (R1R)SB(r)a | 0.8940.002 | 34.30.5 | 177.9 | 70 -89 | 2.63 | |
| NGC 6907 | SAB(s)bc | 0.8370.003 | 69.50.6 | 93.8 | 87-106 | 4.10 | |
| NGC 7155 | SB(r)0o | 0.9500.006 | 49.95.3 | 95.9 | 77- 88 | 2.78 | |
| NGC 7329 | SB(r)b | 0.7750.001 | 119.00.1 | 76.0 | 132-140 | 2.51 | |
| NGC 7513 | SB(s)b | 0.6750.020 | 104.60.3 | 70.8 | 74-104 | 2.80 | |
| NGC 7552 | (R)SB(s)ab | 0.9100.008 | 184.73.5 | 92.9 | 102-124 | 4.31 | |
| NGC 7582 | (R)SB(s)ab | 0.4460.002 | 150.40.1 | 156.1 | 189-219 | 3.18 | |
| IC 1438 | (R1R)SAB(r)a | 0.8620.002 | 128.60.9 | 123.0 | 90-100 | 4.83 | opt |
| IC 4290bbOrientation parameters from Buta et al. 1998, AJ, 116 1142. | (R′)SB(r)a | 0.906 | 48.4 | 97.6 | 2.45 | opt, kin | |
| IC 5092 | (R)SB(s)c | 0.9060.004 | 32.30.7 | 106.3 | 73 -88 | 2.62 | |
| UGC 10862 | SB(rs)c | 0.9200.003 | 164.92.0 | 35.8 | 82 -92 | 3.28 |
| Galaxy | |||||
|---|---|---|---|---|---|
| (′′) | |||||
| 1 | 2 | 3 | 4 | 5 | 6 |
| NGC 175 | 33.66 | 9.21 | 24.5 | 21.0 | 65.6 |
| NGC 521 | 34.21 | 8.57 | 25.6 | 21.9 | 97.1 |
| NGC 613 | 31.48 | 7.02 | 24.5 | 21.0 | 164.9 |
| NGC 986 | 32.05 | 7.77 | 24.3 | 20.6 | 116.7 |
| NGC 1300 | 31.57 | 7.55 | 24.0 | 20.8 | 189.3 |
| NGC 1566 | 31.30 | 6.88 | 24.4 | 21.1 | 249.5 |
| NGC 4593 | 32.75 | 7.98 | 24.8 | 21.3 | 116.7 |
| NGC 5101 | 31.88 | 7.13 | 24.8 | 20.7 | 172.6 |
| NGC 5335 | 34.00 | 10.08 | 23.9 | 20.7 | 64.1 |
| NGC 5365 | 32.50 | 7.89 | 24.6 | 20.5 | 92.7 |
| NGC 6221 | 31.40 | 7.06 | 24.3 | 21.6 | 128.0 |
| NGC 6384 | 31.94 | 7.48 | 24.5 | 21.3 | 202.8 |
| NGC 6782 | 33.61 | 8.85 | 24.8 | 21.4 | 68.7 |
| NGC 6907 | 33.25 | 8.28 | 25.0 | 21.9 | 106.4 |
| NGC 7155 | 32.13 | 8.96 | 23.2 | 19.2 | 64.1 |
| NGC 7329 | 33.17 | 8.86 | 24.3 | 21.1 | 116.7 |
| NGC 7513 | 31.70 | 8.94 | 22.8 | 19.4 | 99.3 |
| NGC 7552 | 31.68 | 7.53 | 24.1 | 20.5 | 104.0 |
| NGC 7582 | 31.64 | 7.31 | 24.3 | 20.8 | 150.4 |
| IC 1438 | 32.82 | 9.28 | 23.5 | 20.4 | 72.0 |
| IC 4290 | 34.04 | 10.31 | 23.7 | 20.2 | 49.8 |
| IC 5092 | 33.18 | 9.40 | 23.8 | 20.6 | 86.5 |
| UGC 10862 | 31.97 | 11.66 | 20.3 | 18.9 | 86.5 |
| Galaxy | (0) | (0) | ||||||||||
|---|---|---|---|---|---|---|---|---|---|---|---|---|
| bulge | ′′ | disk | ′′ | ′′ | ′′ | bar | deg | |||||
| 1 | 2 | 3 | 4 | 5 | 6 | 7 | 8 | 9 | 10 | 11 | 12 | 13 |
| NGC 175 | 14.10 | 0.99 | 0.966 | 17.35 | 15.2 | 25.0 | 5.9 | 17.62 | 182.4 | 0.25 | 0.074 | 0.118 |
| NGC 521 | 13.06 | 0.81 | 0.796 | 17.32 | 18.8 | 26.8 | 8.8 | 17.30 | 40.5 | 3.14 | 0.133 | 0.062 |
| NGC 613 | 12.85 | 1.82 | 0.861 | 17.30 | 36.8 | 84.9 | 22.0 | 17.96 | 92.5 | 0.00 | 0.144 | 0.178 |
| NGC 986 | 13.93 | 2.78 | 1.277 | 18.12 | 34.5 | 59.9 | 23.9 | 17.11 | 4.8 | 2.00 | 0.137 | 0.282 |
| NGC1300 | 12.97 | 1.03 | 0.736 | 18.89 | 76.8 | 89.4 | 30.8 | 18.47 | 71.3 | 1.00 | 0.099 | 0.153 |
| NGC1566 | 10.83 | 0.15 | 0.421 | 16.89 | 42.5 | 53.6 | 21.3 | 17.30 | 38.4 | 1.25 | 0.129 | 0.076 |
| NGC4593 | 8.06 | 0.00 | 0.279 | 18.65 | 38.1 | 76.0 | 24.5 | 18.35 | 38.1 | 0.30 | 0.345 | 0.232 |
| NGC5101 | 11.10 | 0.16 | 0.394 | 18.46 | 58.2 | 67.1 | 28.1 | 17.41 | 64.2 | 0.71 | 0.280 | 0.210 |
| NGC5335 | 14.33 | 1.34 | 0.930 | 18.64 | 20.1 | 29.9 | 8.0 | 18.02 | 152.2 | 0.56 | 0.188 | 0.177 |
| NGC5365 | 11.61 | 0.59 | 0.547 | 19.07 | 61.3 | 78.0 | 28.7 | 17.99 | 186.8 | 2.98 | 0.480 | 0.131 |
| NGC6221 | 11.40 | 0.43 | 0.636 | 16.75 | 30.5 | 46.9 | 11.7 | 17.39 | 7.2 | 0.10 | 0.091 | 0.096 |
| NGC6384 | 11.37 | 0.04 | 0.325 | 17.91 | 45.9 | 39.8 | 17.3 | 17.02 | 100.5 | 4.00 | 0.118 | 0.059 |
| NGC6782 | 11.86 | 0.28 | 0.485 | 18.35 | 22.0 | 31.3 | 14.6 | 18.16 | 47.2 | 0.00 | 0.408 | 0.171 |
| NGC6907 | 13.57 | 1.25 | 0.803 | 17.71 | 25.1 | 63.7 | 25.1 | 17.71 | 102.7 | 2.19 | 0.127 | 0.236 |
| NGC7155 | 12.70 | 0.85 | 0.695 | 18.29 | 21.0 | 44.7 | 15.9 | 17.51 | 137.8 | 2.56 | 0.356 | 0.196 |
| NGC7329 | 12.92 | 0.82 | 0.718 | 18.23 | 26.2 | 38.0 | 11.0 | 18.40 | 38.0 | 0.00 | 0.211 | 0.121 |
| NGC7513 | 15.19 | 1.12 | 0.806 | 17.81 | 25.6 | 38.0 | 7.5 | 18.28 | 43.4 | 0.00 | 0.033 | 0.088 |
| NGC7552 | 10.51 | 0.19 | 0.445 | 18.32 | 37.3 | 62.6 | 20.4 | 17.45 | 0.8 | 0.12 | 0.384 | 0.272 |
| NGC7582 | 7.81 | 0.02 | 0.376 | 17.46 | 34.4 | 80.5 | 24.0 | 17.96 | 105.1 | 0.00 | 0.178 | 0.215 |
| IC 1438 | 13.21 | 1.26 | 0.857 | 19.11 | 29.0 | 29.1 | 19.7 | 17.98 | 81.5 | 0.72 | 0.325 | 0.235 |
| IC 4290 | 14.43 | 0.64 | 0.724 | 19.34 | 19.7 | 31.3 | 8.7 | 18.46 | 142.9 | 0.45 | 0.141 | 0.264 |
| IC 5092 | 9.35 | 0.00 | 0.321 | 18.32 | 24.5 | 31.3 | 8.5 | 18.22 | 164.4 | 0.68 | 0.050 | 0.107 |
| UGC10862 | 17.98 | 1.70 | 1.468 | 19.20 | 23.5 | 26.8 | 7.0 | 18.76 | -36.2 | 0.49 | 0.009 | 0.125 |
| Galaxy | ||||||
|---|---|---|---|---|---|---|
| (′′) | (′′) | |||||
| 1 | 2 | 3 | 4 | 5 | 6 | 7 |
| NGC 175 | 0.664 | 12.5 | 0.191 | 0.394 | 15.5 | 0.236 |
| NGC 521 | 0.398 | 12.5 | 0.129 | 0.218 | 13.5 | 0.139 |
| NGC 613 | 0.598 | 57.5 | 0.349 | 0.347 | 62.5 | 0.379 |
| NGC 986 | 0.805 | 33.5 | 0.287 | 0.454 | 35.5 | 0.304 |
| NGC1300 | 0.861 | 59.5 | 0.314 | 0.455 | 57.5 | 0.304 |
| NGC1566 | 0.308 | 32.5 | 0.130 | 0.129 | 29.5 | 0.118 |
| NGC4593 | 0.876 | 60.5 | 0.518 | 0.462 | 43.5 | 0.373 |
| NGC5101 | 0.711 | 48.5 | 0.281 | 0.388 | 45.5 | 0.264 |
| NGC5335 | 1.003 | 14.5 | 0.226 | 0.630 | 16.5 | 0.258 |
| NGC5365 | 0.623 | 36.5 | 0.394 | 0.389 | 37.5 | 0.405 |
| NGC6221 | 0.618 | 26.5 | 0.207 | 0.297 | 27.5 | 0.215 |
| NGC6384 | 0.257 | 18.5 | 0.091 | 0.106 | 20.5 | 0.101 |
| NGC6782 | 0.711 | 26.5 | 0.386 | 0.308 | 27.5 | 0.400 |
| NGC6907 | 0.687 | 23.5 | 0.221 | 0.322 | 24.5 | 0.230 |
| NGC7155 | 0.783 | 21.5 | 0.336 | 0.478 | 22.5 | 0.351 |
| NGC7329 | 0.663 | 24.5 | 0.210 | 0.411 | 26.5 | 0.227 |
| NGC7513 | 0.717 | 23.5 | 0.237 | 0.360 | 23.5 | 0.237 |
| NGC7552 | 1.104 | 46.5 | 0.447 | 0.682 | 48.5 | 0.466 |
| NGC7582 | 0.902 | 64.5 | 0.429 | 0.539 | 67.5 | 0.449 |
| IC 1438 | 0.620 | 21.5 | 0.299 | 0.256 | 22.5 | 0.313 |
| IC 4290 | 0.912 | 16.5 | 0.331 | 0.596 | 17.5 | 0.352 |
| IC 5092 | 0.621 | 16.5 | 0.191 | 0.340 | 17.5 | 0.202 |
| UGC 10862 | 0.722 | 12.5 | 0.145 | 0.440 | 13.5 | 0.156 |
.
| Galaxy | ||||||||||||
|---|---|---|---|---|---|---|---|---|---|---|---|---|
| 1 | 2 | 3 | 4 | 5 | 6 | 7 | 8 | 9 | 10 | 11 | 12 | 13 |
| NGC 175 | 0.66 | 0.40 | 0.23 | 0.14 | 12.5 | 15.1 | 15.4 | 15.3 | 5.9 | 5.0 | 4.5 | 4.0 |
| NGC 521 | 0.40 | 0.22 | 0.14 | 0.09 | 12.8 | 13.1 | 13.4 | 13.5 | 5.7 | 4.6 | 4.2 | 3.4 |
| NGC 1300-1 | 0.34 | 0.46 | 0.28 | 0.16 | 34.3 | 57.3 | 58.8 | 59.1 | 11.2 | 16.2 | 12.2 | 12.8 |
| NGC 1300-2 | 0.84 | 0.00 | 0.00 | 0.00 | 62.4 | 0.0 | 0.0 | 0.0 | 20.3 | 0.0 | 0.0 | 0.0 |
| NGC 4593-1 | 0.69 | 0.44 | 0.24 | 0.14 | 37.3 | 41.0 | 40.4 | 40.1 | 14.4 | 11.9 | 9.5 | 8.1 |
| NGC 4593-2 | 0.76 | 0.23 | 0.17 | 0.13 | 67.1 | 62.4 | 59.1 | 58.3 | 14.7 | 9.5 | 10.1 | 8.6 |
| NGC 5101-1 | 0.62 | 0.22 | 0.13 | 0.17 | 36.3 | 31.7 | 33.4 | 43.7 | 12.6 | 7.0 | 6.0 | 8.7 |
| NGC 5101-2 | 0.39 | 0.37 | 0.25 | 0.00 | 52.7 | 47.2 | 47.2 | 0.0 | 6.7 | 8.2 | 6.7 | 0.0 |
| NGC 5335-1 | 1.00 | 0.61 | 0.36 | 0.25 | 14.9 | 16.0 | 16.2 | 18.5 | 5.7 | 4.5 | 3.7 | 4.2 |
| NGC 5335-2 | 0.35 | 0.25 | 0.19 | 0.06 | 23.7 | 22.3 | 22.8 | 25.7 | 2.6 | 2.6 | 3.5 | 1.2 |
| NGC 5365-1 | 0.11 | 0.01 | 0.08 | 0.04 | 25.3 | 25.1 | 27.0 | 27.0 | 3.9 | 3.8 | 4.6 | 4.7 |
| NGC 5365-2 | 0.62 | 0.39 | 0.25 | 0.16 | 36.8 | 37.8 | 40.5 | 41.2 | 11.3 | 10.1 | 7.2 | 8.0 |
| NGC 6384 | 0.26 | 0.11 | 0.06 | 0.03 | 18.4 | 20.6 | 20.1 | 19.9 | 6.6 | 4.0 | 3.3 | 3.3 |
| NGC 6782-1 | 0.12 | 0.09 | 0.06 | 0.03 | 13.5 | 14.1 | 17.4 | 17.5 | 2.2 | 3.5 | 3.0 | 2.9 |
| NGC 6782-2 | 0.71 | 0.31 | 0.15 | 0.07 | 26.5 | 27.3 | 28.3 | 28.4 | 8.5 | 6.6 | 4.4 | 4.2 |
| NGC 7155 | 0.78 | 0.48 | 0.29 | 0.18 | 21.4 | 22.2 | 22.3 | 22.9 | 7.9 | 6.4 | 6.1 | 6.1 |
| NGC 7329-1 | 0.66 | 0.41 | 0.25 | 0.13 | 24.6 | 26.3 | 27.1 | 28.1 | 10.9 | 6.9 | 5.9 | 5.4 |
| NGC 7329-2 | 0.00 | 0.00 | 0.00 | 0.00 | 0.0 | 0.0 | 0.0 | 0.0 | 0.0 | 0.0 | 0.0 | 0.0 |
| NGC 7513-1 | 0.57 | 0.24 | 0.11 | 0.12 | 19.5 | 20.3 | 22.2 | 24.0 | 9.2 | 5.6 | 4.2 | 5.4 |
| NGC 7513-2 | 0.49 | 0.34 | 0.19 | 0.11 | 37.0 | 34.3 | 32.1 | 35.3 | 10.2 | 8.7 | 9.5 | 7.3 |
| NGC 7552-1 | 0.00 | 0.18 | 0.23 | 0.18 | 0.0 | 33.2 | 34.9 | 36.5 | 0.0 | 9.0 | 7.8 | 7.4 |
| NGC 7552-2 | 0.00 | 0.66 | 0.47 | 0.31 | 0.0 | 52.2 | 53.2 | 53.2 | 0.0 | 16.7 | 10.7 | 9.2 |
| NGC 7582-1 | 0.21 | 0.21 | 0.22 | 0.08 | 41.5 | 42.5 | 54.8 | 46.3 | 12.4 | 7.9 | 21.1 | 10.6 |
| NGC 7582-2 | 0.87 | 0.54 | 0.18 | 0.23 | 67.6 | 67.4 | 70.3 | 69.0 | 20.9 | 15.1 | 8.0 | 9.8 |
| IC 1438-1 | 0.62 | 0.26 | 0.12 | 0.05 | 21.7 | 22.2 | 22.3 | 21.9 | 5.9 | 4.6 | 3.9 | 3.4 |
| IC 1438-2 | 0.11 | 0.03 | 0.01 | 0.01 | 10.2 | 12.9 | 16.6 | 12.0 | 2.8 | 3.1 | 5.7 | 3.8 |
| IC 4290-1 | 0.82 | 0.58 | 0.29 | 0.21 | 13.8 | 16.5 | 16.2 | 16.5 | 6.8 | 4.5 | 3.7 | 3.4 |
| IC 4290-2 | 0.33 | 0.27 | 0.26 | 0.16 | 22.3 | 24.2 | 22.2 | 22.7 | 4.8 | 3.1 | 4.1 | 3.7 |
| IC 5092 | 0.62 | 0.34 | 0.20 | 0.11 | 16.5 | 17.6 | 17.8 | 18.1 | 8.0 | 5.9 | 5.6 | 6.0 |
| UGC 10862 | 0.72 | 0.44 | 0.27 | 0.17 | 12.9 | 13.2 | 14.0 | 14.4 | 5.5 | 3.5 | 3.2 | 3.0 |
| Galaxy | ||||||
|---|---|---|---|---|---|---|
| (′′) | (′′) | (′′) | (′′) | (′′) | (kpc) | |
| 1 | 2 | 3 | 4 | 5 | 6 | 7 |
| NGC 175 | 20.5 | 22.4 | 21.9 | 23.4 | 22.9 | 6.1 |
| NGC 521 | 20.6 | 22.4 | 19.4 | 20.8 | 20.4 | 7.0 |
| NGC 613 | 79.1 | 81.7 | 75.1 | 78.7 | 79.4 | 7.6 |
| NGC 986 | 53.9 | 57.6 | 51.3 | 54.6 | 59.3 | 6.8 |
| NGC 1300 | 89.5 | 95.8 | 79.3 | 84.3 | 83.3 | 8.4 |
| NGC 1566 | 40.2 | 41.3 | 39.6 | 42.6 | 40.2 | 3.8 |
| NGC 4593 | 85.6 | 90.5 | 70.2 | 74.2 | 78.6 | 12.8 |
| NGC 5101 | 60.8 | 63.3 | 58.0 | 60.6 | 68.4 | 7.0 |
| NGC 5335 | 25.8 | 27.1 | 24.8 | 25.9 | 27.1 | 7.9 |
| NGC 5365 | 52.1 | 55.7 | 51.5 | 54.6 | 55.3 | 8.4 |
| NGC 6221 | 42.3 | 44.6 | 39.8 | 42.1 | 40.6 | 3.9 |
| NGC 6384 | 27.3 | 29.4 | 26.0 | 27.3 | 25.6 | 3.2 |
| NGC 6782 | 38.0 | 40.6 | 36.2 | 38.2 | 44.4 | 9.7 |
| NGC 6907 | 32.5 | 34.9 | 32.3 | 34.7 | 33.9 | 7.5 |
| NGC 7155 | 32.0 | 34.5 | 30.8 | 32.8 | 34.3 | 4.2 |
| NGC 7329 | 39.3 | 42.7 | 35.7 | 37.9 | 37.9 | 7.9 |
| NGC 7513 | 47.6 | 51.4 | 45.7 | 48.5 | 45.2 | 5.1 |
| NGC 7552 | 77.1 | 81.0 | 74.4 | 79.7 | 68.8 | 8.4 |
| NGC 7582 | 95.3 | 101.9 | 87.8 | 92.6 | 90.9 | 9.6 |
| IC 1438 | 29.7 | 31.5 | 28.4 | 29.9 | 29.3 | 5.3 |
| IC 4290 | 26.4 | 28.3 | 26.7 | 28.0 | 28.7 | 8.7 |
| IC 5092 | 27.3 | 29.8 | 25.5 | 27.3 | 26.6 | 5.7 |
| UGC 10862 | 20.3 | 22.0 | 18.0 | 19.1 | 21.9 | 2.3 |
| Galaxy | ||||||||||
|---|---|---|---|---|---|---|---|---|---|---|
| 1 | 2 | 3 | 4 | 5 | 6 | 7 | 8 | 9 | 10 | 11 |
| NGC 175 | 0.475 | 0.436 | 0.210 | 0.422 | 0.249 | 16.0 | 15.5 | 26.0 | 26.5 | 28.5 |
| 0.073 | 0.064 | 0.040 | 0.050 | 0.010 | ||||||
| NGC 521 | 0.176 | 0.175 | 0.067 | 0.218 | 0.149 | 13.0 | 13.5 | 54.0 | 57.5 | 66.5 |
| 0.025 | 0.026 | 0.013 | 0.020 | 0.020 | ||||||
| NGC 613 | 0.483 | 0.395 | 0.346 | 0.780 | 0.449 | 63.0 | 48.0 | 75.0 | 88.5 | 81.5 |
| 0.096 | 0.064 | 0.089 | 0.078 | 0.045 | ||||||
| NGC 986 | 0.586 | 0.436 | 0.497 | 1.220 | 0.733 | 46.5 | 35.0 | 63.0 | 62.5 | 63.5 |
| 0.106 | 0.064 | 0.132 | 0.061 | 0.037 | ||||||
| NGC 1300 | 0.573 | 0.502 | 0.232 | 0.789 | 0.346 | 60.5 | 59.0 | 123.5 | 117.5 | 118.5 |
| 0.090 | 0.074 | 0.063 | 0.039 | 0.017 | ||||||
| NGC 1566 | 0.234 | 0.153 | 0.230 | 0.611 | 0.316 | 75.0 | 27.0 | 74.5 | 68.0 | 66.5 |
| 0.041 | 0.022 | 0.046 | 0.031 | 0.016 | ||||||
| NGC 4593 | 0.343 | 0.341 | 0.064 | 0.332 | 0.200 | 45.5 | 45.5 | 60.0 | 98.5 | 75.5 |
| 0.055 | 0.051 | 0.024 | 0.088 | 0.059 | ||||||
| NGC 5101 | 0.233 | 0.227 | 0.043 | 0.216 | 0.066 | 40.0 | 40.0 | 100.0 | 84.5 | 59.5 |
| 0.033 | 0.033 | 0.026 | 0.011 | 0.017 | ||||||
| NGC 5335 | 0.425 | 0.422 | 0.049 | 0.107 | 0.136 | 20.0 | 20.0 | 46.5 | 47.5 | 47.5 |
| 0.061 | 0.062 | 0.010 | 0.005 | 0.007 | ||||||
| NGC 5365 | 0.102 | 0.106 | 0.013 | 0.063 | 0.018 | 38.0 | 37.0 | 43.0 | 67.5 | 65.5 |
| 0.015 | 0.016 | 0.005 | 0.015 | 0.018 | ||||||
| NGC 6221 | 0.421 | 0.400 | 0.261 | 0.455 | 0.197 | 28.0 | 28.0 | 48.0 | 49.5 | 66.5 |
| 0.076 | 0.059 | 0.080 | 0.046 | 0.020 | ||||||
| NGC 6384 | 0.112 | 0.127 | 0.106 | 0.255 | 0.106 | 18.5 | 19.0 | 50.0 | 53.5 | 79.5 |
| 0.019 | 0.020 | 0.019 | 0.038 | 0.016 | ||||||
| NGC 6782 | 0.183 | 0.180 | 0.037 | 0.283 | 0.112 | 23.0 | 23.0 | 57.0 | 42.5 | 38.5 |
| 0.026 | 0.027 | 0.009 | 0.119 | 0.068 | ||||||
| NGC 6907 | 0.384 | 0.272 | 0.349 | 0.714 | 0.371 | 27.0 | 24.0 | 44.5 | 37.5 | 32.5 |
| 0.084 | 0.042 | 0.085 | 0.070 | 0.029 | ||||||
| NGC 7155 | 0.185 | 0.185 | 0.031 | 0.333 | 0.089 | 22.0 | 22.0 | 61.0 | 67.5 | 54.5 |
| 0.027 | 0.027 | 0.009 | 0.017 | 0.004 | ||||||
| NGC 7329 | 0.322 | 0.313 | 0.153 | 0.486 | 0.109 | 27.0 | 27.0 | 55.5 | 84.5 | 72.5 |
| 0.049 | 0.048 | 0.035 | 0.073 | 0.011 | ||||||
| NGC 7513 | 0.660 | 0.666 | 0.114 | 0.132 | 0.214 | 27.0 | 27.0 | 43.5 | 63.5 | 75.5 |
| 0.117 | 0.115 | 0.023 | 0.017 | 0.011 | ||||||
| NGC 7552 | 0.409 | 0.401 | 0.100 | 0.406 | 0.309 | 41.5 | 41.0 | 62.0 | 85.5 | 73.5 |
| 0.065 | 0.062 | 0.037 | 0.100 | 0.100 | ||||||
| NGC 7582 | 0.427 | 0.417 | 0.110 | 0.291 | 0.157 | 57.0 | 56.0 | 69.0 | 108.0 | 83.5 |
| 0.069 | 0.064 | 0.036 | 0.100 | 0.050 | ||||||
| IC 1438 | 0.125 | 0.124 | 0.052 | 0.285 | 0.156 | 19.5 | 19.5 | 74.0 | 62.5 | 64.5 |
| 0.018 | 0.018 | 0.014 | 0.014 | 0.008 | ||||||
| IC 4290 | 0.532 | 0.522 | 0.079 | 0.635 | 0.309 | 20.0 | 20.0 | 50.0 | 51.5 | 56.5 |
| 0.077 | 0.077 | 0.018 | 0.032 | 0.015 | ||||||
| IC 5092 | 0.508 | 0.506 | 0.151 | 0.324 | 0.111 | 17.0 | 17.0 | 27.5 | 32.5 | 29.5 |
| 0.086 | 0.075 | 0.031 | 0.039 | 0.036 | ||||||
| UGC 10862 | 0.826 | 0.796 | 0.152 | 0.279 | 0.145 | 12.0 | 12.0 | 17.0 | 23.5 | 20.5 |
| 0.117 | 0.117 | 0.030 | 0.098 | 0.052 |
| Parameter | SG | DG |
|---|---|---|
| 1 | 2 | 3 |
| 0.590.07 | 0.820.05 | |
| 0.340.05 | 0.460.04 | |
| 0.340.09 | 0.340.05 | |
| 0.320.08 | 0.320.05 | |
| 1.170.14 | 1.560.17 | |
| 0.140.05 | 0.260.04 | |
| 1.710.37 | 1.920.24 | |
| No. of galaxies | 7 | 11 |
![[Uncaptioned image]](/html/0903.2008/assets/x19.png)