The Extreme Star Formation Activity of Arp 299 Revealed by Spitzer IRS Spectral Mapping88affiliation: Based on observations obtained with the Spitzer Space Telescope, which is operated by the Jet Propulsion Laboratory, California Institute of Technology, under NASA contract 1407
Abstract
We present Spitzer/IRS spectral mapping observations of the luminous infrared galaxy (LIRG) Arp 299 (IC 694 + NGC 3690) covering the central . The integrated mid-IR spectrum of Arp 299 is similar to that of local starbursts despite its strongly interacting nature and high infrared luminosity, . This is explained because the star formation (probed by e.g. high [NeIII]m/[NeII]m line ratios) is spread across at least 6-8 kpc. Moreover, a large fraction of this star formation is taking place in young regions of moderate mid-IR optical depths such as the C+C′ complex in the overlap region between the two galaxies and in H ii regions in the disks of the galaxies. It is only source A, the nuclear region of IC 694, that shows the typical mid-IR characteristics of ultraluminous infrared galaxies (ULIRGs, ), that is, very compact (less than 1 kpc) and dust-enshrouded star formation resulting in a deep silicate feature and moderate equivalent widths of the PAHs. The nuclear region of NGC 3690, known as source B1, hosts a low-luminosity AGN and is surrounded by regions of star formation. Although the high excitation [NeV]m line typical of AGN is not detected in B1, its upper limit is consistent with the value expected from the X-ray luminosity. The AGN emission is detected in the form of a strong hot dust component that accounts for of the m luminosity of B1. The similarity between the Arp 299 integrated mid-IR spectrum and those of high- ULIRGs suggests that Arp 299 may represent a local example, albeit with lower IR luminosity and possibly higher metallicity, of the star-formation processes occurring at high-.
Subject headings:
galaxies: evolution — galaxies: nuclei — galaxies: Seyfert — galaxies: structure — infrared: galaxies — galaxies: individual: Arp2991. Introduction
Luminous Infrared (IR) Galaxies (LIRGs, , see Sanders & Mirabel 1996 for a review) are an important cosmological class as they are the main contributors to the co-moving star formation rate density of the universe at (Elbaz et al. 2002; Le Floc’h et al. 2005; Pérez-González et al. 2005; Caputi et al. 2007). At higher redshifts () LIRGs and Ultra Luminous Infrared Galaxies (ULIRGs, ) have comparable contributions. Moreover, a large fraction of massive galaxies at high redshift are LIRGs and ULIRGs, indicating that a phase of intense star formation and/or AGN activity dominated the energy output of these massive galaxies and was more common in the past than now (Caputi et al. 2006).
| Target | RA | Dec | IRS | Map | Plate | PA | Ramp | Number | Program |
|---|---|---|---|---|---|---|---|---|---|
| Module | Size | Scale | Duration | Cycles | ID | ||||
| (1) | (2) | (3) | (4) | (5) | (6) | (7) | (8) | (9) | (10) |
| Arp 299 | 11h28m32.8s | +58d33m42s | SL1 + SL2 | 1.85 | 56.82 | 14s | 2 | 21 | |
| LL1 + LL2 | 5.08 | 14s | 2 | 21 | |||||
| IC 694 | 11h28m33.7s | +58d33m46s | SH | 2.26 | 157.38 | 30s | 2 | 30577 | |
| LH | 4.46 | 72.58 | 60s | 4 | 30577 | ||||
| NGC 3690 | 11h28m30.7s | +58d33m43s | SH | 2.26 | 157.31 | 30s | 2 | 30577 | |
| LH | 4.46 | 72.51 | 60s | 4 | 30577 |
Recent results with the Infrared Spectrograph (IRS) instrument (Houck et al. 2004) on Spitzer are now showing that the mid-IR spectra of star-forming galaxies with high IR luminosities (in the ULIRG class, or even more luminous) appear to be more consistent with those of local starbursts and LIRGs, rather than local ULIRGs (Rigby et al. 2008; Farrah et al. 2008). In particular these high- IR galaxies have similar PAH features to those of local ULIRGs, but substantially shallower m absorption features. This may be due to lower optical depths, perhaps because star formation in ULIRGs was more spatially extended at high- than now, and/or metallicity effects. Therefore, local LIRGs play a fundamental role for understanding their more distant and luminous counterparts. To characterize fully the mid-IR properties of local LIRGs, we have started a program to obtain IRS spectral mapping of a sample of local LIRGs from Alonso-Herrero et al. (2006). In this paper we present the first results for Arp 299 (IC 694 + NGC 3690), a LIRG with , using the IRAS fluxes from Sanders et al. (2003) and a distance of Mpc ().
Arp 299 has long been recognized as an extremely interesting system: an interacting galaxy (Arp 1966); a non-Seyfert111but see García-Marín et al. 2006 for the optical identification of the AGN in NGC 3690 galaxy with bright emission lines (Weedman 1972); a luminous mid-IR source (Rieke & Low 1972); and a highly powerful starburst (Gehrz, Sramek, & Weedman 1983). The bright sources in this system probe a full range of distinct and well-characterized physical conditions that can be used as a benchmark for different mid-IR indicators for LIRGs. In brief, the properties of the nuclear region of IC 694, referred to as A (see Gehrz et al. 1983), are dominated by a relatively extended and evolved period of star formation, whereas the C+C′ complex in the overlap region between the two galaxies, contains powerful and young starbursts. The nuclear region of NGC 3690, referred to as B1, hosts an obscured AGN and is also surrounded by regions of star formation. §5, 6, and 7 discuss the properties of these sources. Prior to that discussion, §2 presents the observations and data reduction, whereas §3 presents the analysis of the data. In §4 we describe the overall morphological mid-IR properties of the system. Finally, §8 puts the mid-IR properties of Arp 299 in the context of local and high- IR-bright galaxies, and §9 gives the conclusions.
2. Observations
2.1. IRS Spectral Mapping Observations
The observations of the interacting system Arp 299 were obtained with IRS using all four modules: Short-High (SH; m), Long-High (LH; m), Short-Low (SL1; m and SL2; m) and Long-Low (LL1; m and LL2; m). The low resolution modules contain two subslits, one for the first order (SL1 and LL1) and the other for the second order (SL2 and LL2). The high resolution modules are cross dispersed so that ten orders fall on the array (see Houck et al. 2004 for full details). The IRS high () spectral resolution data (SH and LH modules) were obtained in Cycle 3 as part of a larger GTO program (P.I.: G. H. Rieke) aimed at obtaining Spitzer/IRS spectral mapping of a representative number of local LIRGs from the volume-limited sample described by Alonso-Herrero et al. (2006). The spectral mapping data in low () spectral resolution (SL and LL modules) were taken from the Spitzer archive and were part of a different GTO program (P.I.: J. R. Houck) observed in Cycle 1.
The observing strategy of both programs used the IRS spectral mapping capability. In this observing mode the telescope is moved perpendicular to the long axis of the slit with a step of one-half the slit width until the appropriate region is covered. This strategy produced a map redundancy of 2 for the SL, LL, and LH modules, and of 4 for the SH module. The two galaxies of Arp 299 were observed as separate targets with the SH and LH modules, whereas in low resolution they were observed with one pointing. Table 1 gives details of the IRS spectral mapping observations, including the ramp integration times, number of cycles, and final sizes of the data cubes.
Since the SL and LL slits are longer than the extent of the galaxy, no separate background observations were needed. For the LH module we obtained dedicated background observations with a single slit (staring mode) observation at a region about 2 arcminutes away from the galaxy. No backgrounds were observed for the SH module. We found however, that even for the LH module where the background is higher than for the SH module, the nuclei are so bright that the background subtraction had little effect.
The data were processed using the Spitzer IRS pipeline version S15.3. The typical uncertainties of the wavelength calibration are m for SL1, m for SL2, m for LL1, m for LL2, m for SH, and m for LH. The uncertainty of the absolute photometric calibration is less than . The observations are diffraction limited above m, so the spatial resolution depends on the wavelength of the observation and it is generally pixels/spatial resolution element (see IRS Handbook, version 3.1). Our own estimates of the angular resolution (FWHM) of the data cubes are typically for SL2, for SL1, and for SH (see Pereira-Santaella et al. 2009, in preparation). For the assumed distance to Arp 299 these correspond to angular resolutios of 0.8 kpc, 1 kpc, and 1.1 kpc for the SL2, SL1, and SH spectral maps, respectively.
The data cubes were assembled using cubism (the CUbe Builder for IRS Spectra Maps, Smith et al. 2007b) from the individual Basic Calibrated Data (BCD) spectral images. Full error cubes are also built alongside the data cubes by standard error propagation, using, for the input uncertainty, the BCD-level uncertainty estimates produced by the IRS pipeline from deviations of the fitted ramp slope fits for each pixel. These uncertainties are used to provide error estimates for extracted spectra, and constructed line and continuum maps (see Smith et al. 2007b for full details). These errors together with the additional systematic uncertainties arising from calibration effects and pointing errors bring the error budget to typically .
2.2. IRS Staring Spectroscopy
Additional IRS staring mode spectroscopy with the SH and LH modules of the two nuclei of Arp 299 was obtained from the Spitzer archive. These observations were observed as part of Program 21, and had no associated background observations. We downloaded the BCD processed by the Spitzer IRS pipeline (version S15.3 for SH and S17.2 for LH). After removing rogue pixels with IRSCLEAN, we extracted a spectrum from each BCD using SPICE. In doing so, SPICE integrates the flux from the entire slit and performs an aperture correction, which is dependent on the wavelength. We assumed point source flux calibration for the extraction. The final step was to median combine all the spectra for each of the two nuclei and to correct for fringing using IRSFRINGE.
3. Analysis
3.1. Spectral Maps
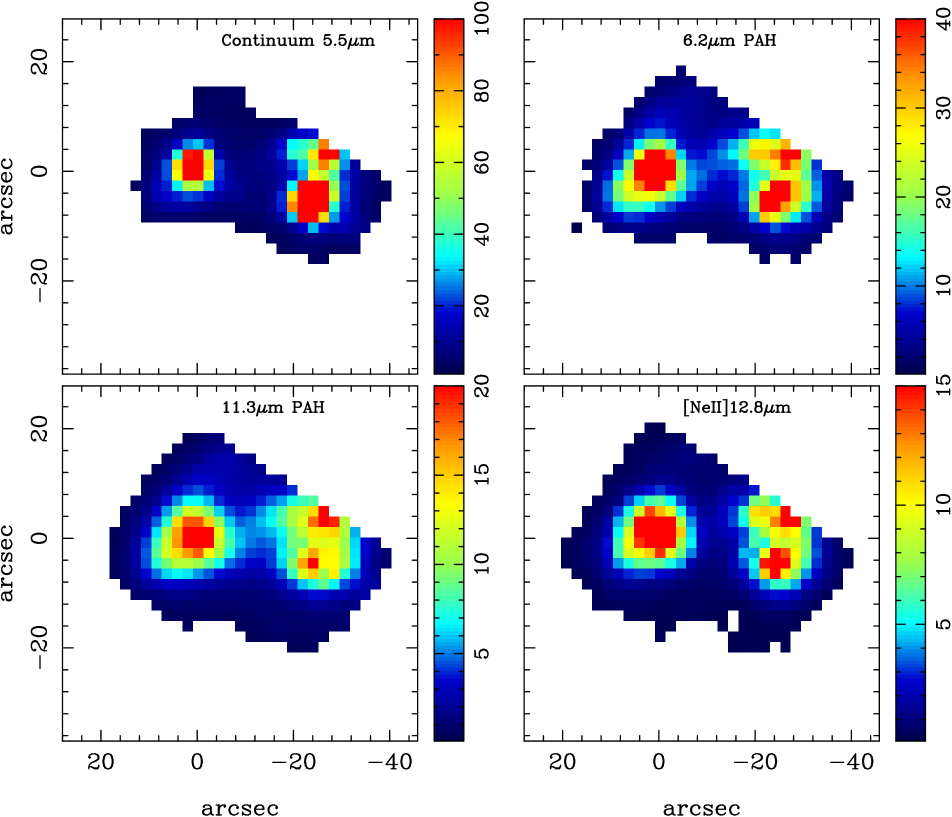
For the SL data cubes we used cubism to construct spectral maps of the m aromatic (hereafter PAH) feature and the m PAH complex (m PAHs), the [Ne ii]m emission line, as well as the continuum at m. The integrated line flux maps are computed by integrating the line flux over the user-defined emission line regions with an average continuum removed. The m continuum map was constructed as the mean flux over a bandpass covering the spectral range of m. The map of the m PAH feature was constructed by integrating the feature in the m range and fitting the continuum between 5.3 and m, whereas the m PAH feature was integrated between 11.1 and m and the corresponding continuum was fitted between and m. Finally the [Ne ii] emission line was integrated between and m, and the continuum was fitted between 12.2 and m. All these wavelengths are observed values.
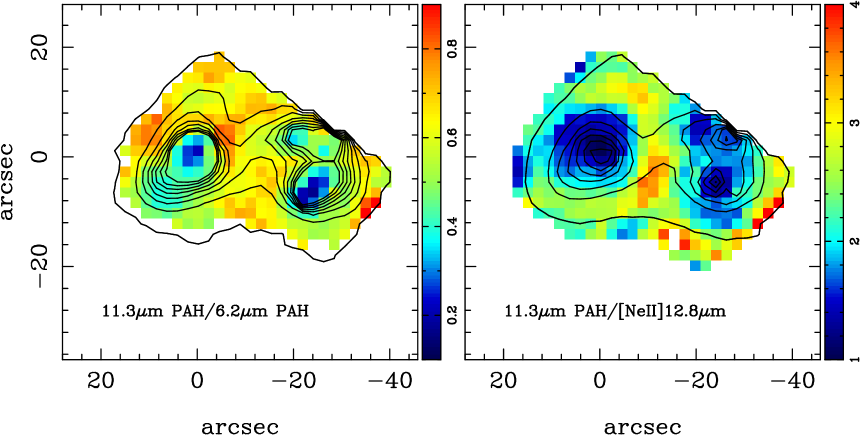
Since cubism does not fit or deblend emission lines, the SL [Ne ii]m map includes some contribution from the m PAH feature complex. The SL spectral maps were then trimmed to the galaxy field of view (FOV) and rotated to the usual orientation of north up, east to the left. As discussed in §2.1 cubism produces both emission line and uncertainty maps. These spectral maps, not corrected for extinction, are shown in Fig. 1. In addition, we constructed maps of the observed m to m PAH ratio and the m PAH to [Ne ii]m ratio (see Fig. 2). Before constructing the line ratio maps the individual images were clipped to those regions with relative errors of (or S/N), where and are the integrated line flux and associated uncertainty, respectively, as derived by cubism. The typical S/N of the bright nuclei in the SL maps are between 400 and 700 per pixel.
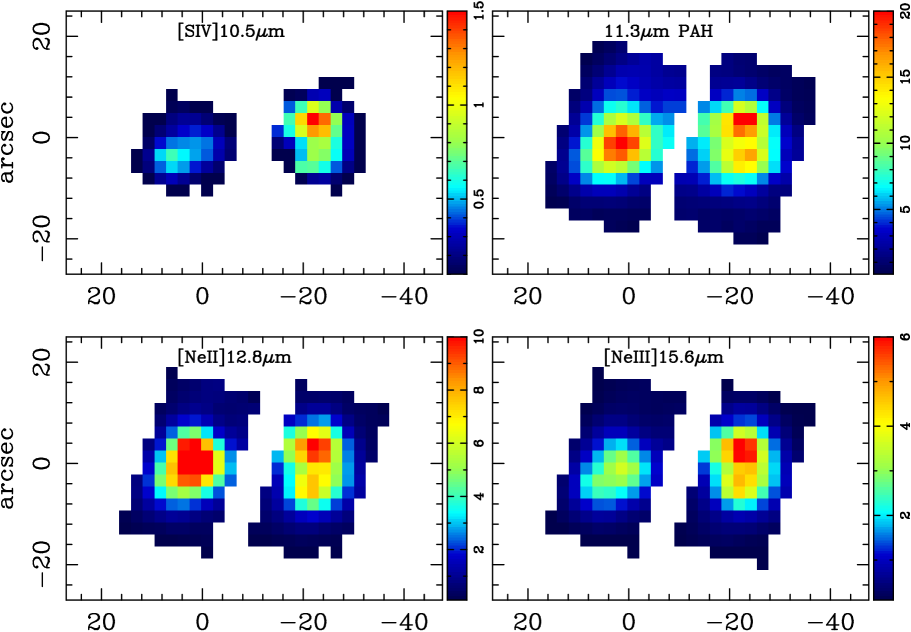
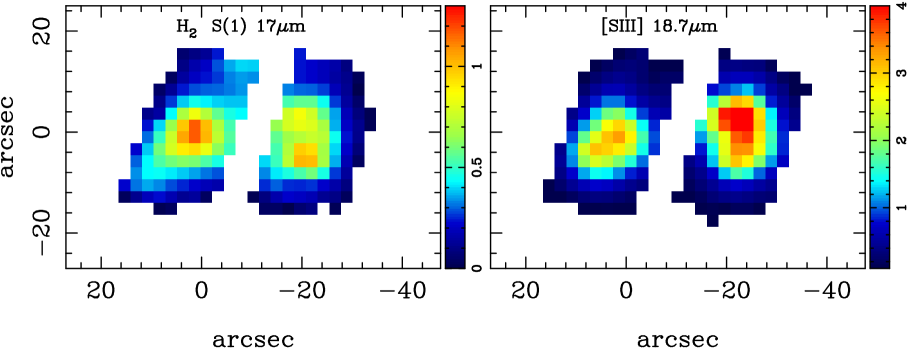
For the bright emission lines present in the SH data cubes ([S iv]m, [Ne ii]m, [Ne iii]m, [S iii]m, and the H2 S(1) line at m), we developed our own idl routines to produce spectral maps. Briefly, we first automatically extracted 1D spectra in boxes, by moving pixel by pixel along columns and rows until the entire FOV was covered. Each emission line was fitted with a Gaussian, and the continuum was fitted from adjacent spectral regions. In the case of the [Ne ii]m line we used two Gaussians, the second one to account for the nearby m PAH feature. The lines were only fitted when the peak of the emission line was above the local continuum, where is the standard deviation of the local continuum. If this requirement was not met, the pixel or pixels were masked out in the final spectral map. Since the m PAH feature is not well reproduced with a Gaussian function, we used cubism instead, as described for the SL data cubes, to construct the spectral maps. In this case, the m PAH feature was integrated between 11.2 and m, and the continuum was fitted between 10.7 and m.
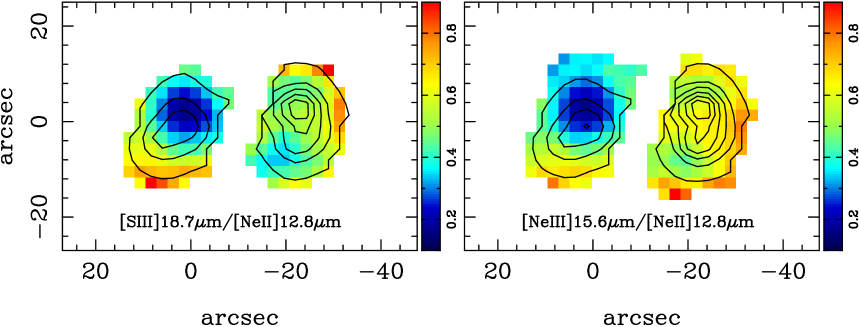
After rotation of the SH spectral maps, we constructed mosaics with the two pointings (Table 1) obtained for the system as shown in Fig. 3. We also constructed maps of the [S iii]m/[Ne ii]m and [Ne iii]m/[Ne ii]m line ratios. We imposed a further restriction to include a given pixel in the map that the line errors of each emission line were less than 25%. The maps of the two line ratios are shown in Fig. 4.
3.2. Extraction of the 1D Spectra
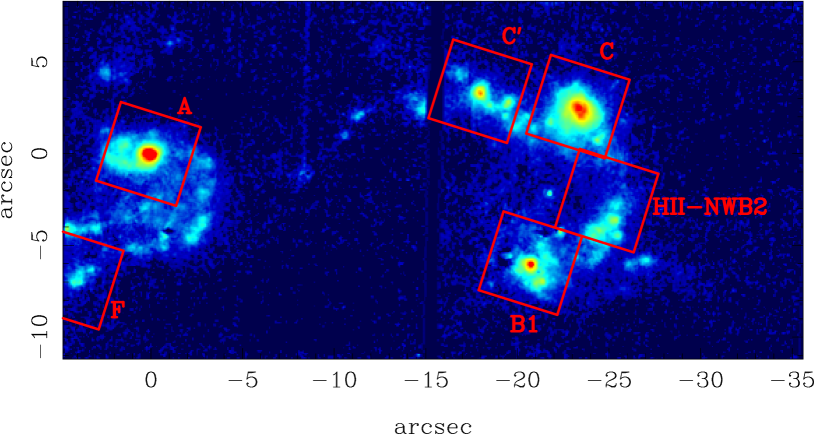
For the two short wavelength IRS modules we first used cubism with the smallest ( pixel) possible extraction apertures on the data cubes before rotation. We extracted 1D SH and SL spectra for the brightest sources of Arp 299, namely A, B1, C, and C′ (see Fig. 5). The optical nucleus B2 is known to be faint in the mid-IR (Keto et al. 1997; Soifer et al. 2001), so we expect its contribution to the mid-IR spectrum of B1 to be minimal. However, there are H ii regions around B1 (see Fig. 5) that contribute to the SH and SL mid-IR spectra.
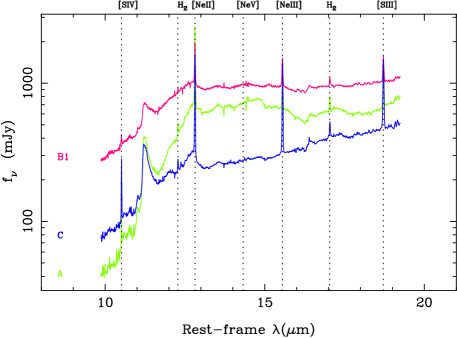
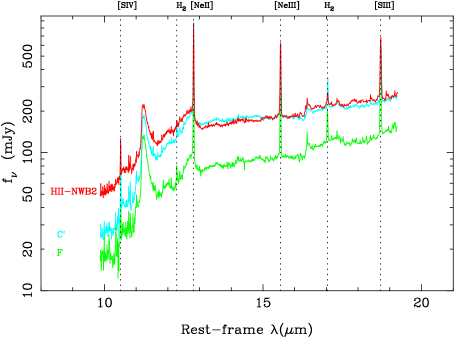
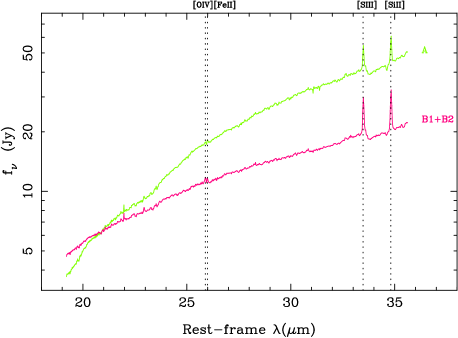
Additionally we extracted SH spectra for two bright H ii complexes. The first is in the southern spiral arm of IC 694, about 7″ southeast of the nucleus, and it is clearly seen in the [Ne iii]m, [S iii]m, and [S iv]m emission line maps in Fig. 3. The location of this region corresponds approximately to source F identified in H by García-Marín et al. (2006) as one of the youngest H ii regions in IC 694, based on the equivalent width (EW) of H. This region was also detected in the radio H92 emission line by Zhao et al. (1997). The second complex is located in NGC 3690, about 3″ northwest from B2. In Fig. 5 the approximate locations of the SH extraction apertures are shown superimposed on the HST/NICMOS continuum-subtracted Pa image of Alonso-Herrero et al. (2000, AAH00 hereafter). The SH spectra for a aperture of all these sources are shown in Fig. 6 (top and middle panels). The LH spectra of the three brightest regions A, B1+B2, and C+C′ were extracted with a aperture. We used cubism to extract matching SH spectra so that the full m spectral range was covered. The staring mode LH spectra of A and B1+B2 are shown in the lower panel of Fig. 6.
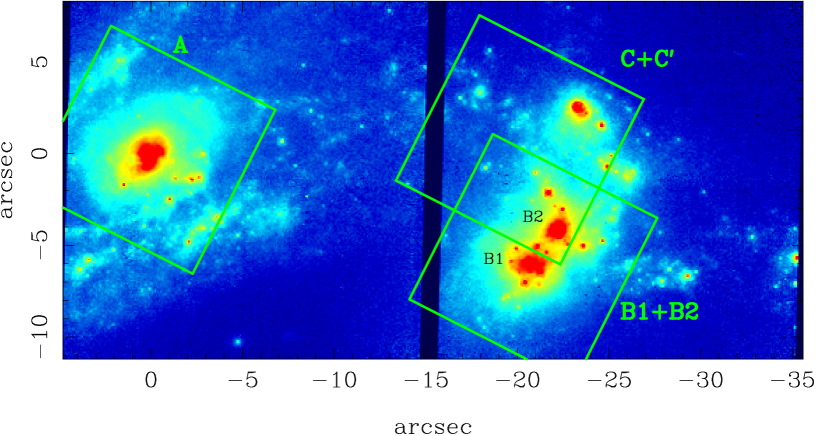
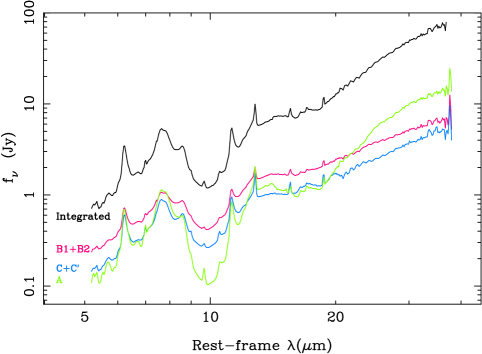
Similarly, LL spectra with apertures were obtained for the brightest sources of Arp 299 (see Fig. 5), together with matching SL spectra so full m low-resolution spectra of A, B1+B2, and C+C′ were obtained, although there is some overlap between the B1+B2, and the C+C′ extraction apertures. Finally, we extracted a 1D low-resolution (SL+LL) spectra covering approximately the whole system using an LL aperture (before rotation) of pixel (). All the SL+LL spectra are shown in Fig. 7.
3.3. Spectral features in the low-resolution spectra
The low-resolution spectra (Fig. 7) for the three main components of the system (A, B1+B2, and C+C′) as well as the integrated spectrum were fitted with pahfit (Smith et al. 2007a). pahfit uses a simple, physically-motivated model that incorporates starlight, thermal dust continuum in a small number of fixed temperature bins, resolved dust features and feature blends, and prominent emission lines, plus fully-mixed or screen dust extinction, including the silicate absorption bands at 9.7 and m. pahfit is designed to work with the low spectral resolution data, and provides the best results when the full m spectral range is used.
In Table 2 we give the pahfit results for the brightest emission line ratios (corrected for extinction), for the EW of the m PAH feature, and for the optical depth of the m silicate feature from the two dust configurations. The mid-IR extinction law used by pahfit can be found in Smith et al. (20071), The optical depth can be converted to optical extinction () using the conversion from Rieke & Lebofsky (1985). The two dust geometries provide fits of similar quality (see Table 2), with the screen model having lower silicate depths (between 2 and 3) than the fully-mixed model. This behavior is similar to that found by Smith et al. (2007a) for the SINGS galaxies. Unlike the majority of the SINGS galaxies, the Arp 299 spectra are fitted with high values of extinction, going from to mag (screen model geometry) for the different components of the system (see Table 2).
3.4. Spectral features in the SH and LH spectra
The fluxes of the brightest emission lines in the SH and LH spectra were measured using splot within the iraf noao environment. For all the emission lines the continuum was estimated from regions adjacent to the line. Most of the lines are well separated in the SH module, except for the [Ne ii]m line. In this case, to get a good estimate of the line fluxes and the local continuum, we fitted simultaneously three Gaussians to the H2 S(2) line at m, the m PAH complex and the [Ne ii] line.
The observed (not corrected for extinction) small-aperture SH line ratios in the six bright components described in §3.2 are listed in Table 3. We also give in this table the [Ne ii]m line fluxes and errors, because it is the line with the largest errors as it is blended with the broad m PAH feature. Additional uncertainties in the fluxes and line ratios are due to centering errors and possible aperture corrections. As an example of the latter issue, in the notes to this table we also give the [Ne ii] and [Ne iii] fluxes for the nuclear region A of IC 694 measured with the SH module through a slightly larger extraction aperture (). The fluxes are about a factor of 1.6 larger indicating that some flux is missing from the aperture, although the Pa emission (Fig. 5), radio continuum and line nuclear emissions (Aalto et al. 1997; Zhao et al. 1997) appear to be coming from a region less than 5″ in diameter.
The observed line ratios and [Ne ii] line fluxes measured from the SH+LH spectra through apertures are given in Table 4 for the three main components of the system. The fluxes and line ratios for IC 694-A, and the sum of NGC-3690-B1+B2 and NGC-3690-C+C′ are in good agreement with those reported by Verma et al. (2003) from ISO large-aperture spectroscopy. We also note that the line ratios given in Table 4 are consistent within the uncertainties with those from the SL+LL data (Table 2) if they are corrected for extinction as derived from pahfit and the dust screen model.
4. Overall morphological properties
In this section we describe the overall morphology of the different mid-IR spectral features, as well as the general physical and excitation conditions in Arp 299.
4.1. Mid-IR continuum and fine-structure lines
Figures 1 and 3 show that there is bright mid-IR continuum and line emission from the two nuclei of the system (A and B1), as well as from the C+C′ complex in the overlap region between the two galaxies. There is also emission in the spiral arms of IC 694 (especially in the southeast spiral arm), as well as in regions west of B1 and B2 in NGC 3690. These results are in agreement with previous work using optical, near-IR, mid-IR, millimeter, and radio continuum and emission lines (e.g., Gehrz et al. 1983; Aalto et al. 1997; Zhao et al. 1997; Satyapal et al. 1999; Sugai et al. 1999; AAH00; Soifer et al. 2001; Gallais et al. 2004; García-Marín et al. 2006; Imanishi & Nakanishi 2006).
In particular, the morphology of the fine-structure mid-IR [Ne iii]m and [S iii]m emission lines as well as the relative brightnesses from source to source resemble that of the HST/NICMOS Pa emission line (Fig. 5, and AAH00) and other near-IR hydrogen recombination lines (Sugai et al. 1999; Satyapal et al. 1999). The hydrogen recombination lines are tracers of the young ionizing stellar populations. The [S iv]m line shows an overall morphology that is similar to Pa, but it is more affected by extinction, especially toward the nuclear region of IC 694 as we shall see in §7.1.
| Source | EW | |||||||||
|---|---|---|---|---|---|---|---|---|---|---|
| m PAH | ||||||||||
| Screen Model | ||||||||||
| A | 2.04 | 0.06 | 1.46 | 0.47 | 0.54 | 0.37 | 0.27 | 1.36 | 1.5 | 1535 |
| B1+B2 | 0.91 | 0.32 | 3.00 | 0.03 | 0.99 | 0.04 | 0.57 | 0.22 | 1.8 | 1012 |
| C+C′ | 0.78 | 0.34 | 1.56 | 0.32 | 1.16 | 0.46 | 0.40 | 0.50 | 1.6 | 670 |
| Integrated | 1.09 | 0.36 | 1.57 | 0.15 | 1.35 | 0.38 | 0.48 | 0.65 | 1.5 | 1418 |
| Mixed Model | ||||||||||
| A | 8.75 | 0.05 | 1.65 | 0.35 | 0.25 | 0.33 | 0.39 | 1.85 | 1.2 | 1139 |
| B1+B2 | 2.42 | 0.32 | 3.68 | 0.06 | 0.86 | 0.12 | 0.62 | 0.22 | 1.6 | 823 |
| C+C′ | 1.98 | 0.34 | 1.68 | 0.35 | 1.07 | 0.49 | 0.43 | 0.50 | 1.5 | 627 |
| Integrated | 2.98 | 0.34 | 1.84 | 0.20 | 1.23 | 0.45 | 0.54 | 0.65 | 1.4 | 1170 |
4.2. The PAH Emission
The PAH emission shows some morphological differences when compared to the mid-IR fine structure lines, as can be seen from Figs. 1 and 3. In addition to the aforementioned bright sources in this system, there is diffuse bright PAH emission at 6.2 and m (Fig. 1) in the interface region connecting the two galaxies, southeast of C+C′. There is relatively bright PAH diffuse emission in the interface region where there is very little Pa emission (Fig. 5), possibly indicating that some PAH emission is not associated with the ionizing young stellar populations.
Theoretical models predict that the relative strengths of the different PAH features depend on the properties of the dust grains, the charging conditions, as well as the starlight intensity (Draine & Li 2001). In particular, neutral PAHs are expected to show large m to m ratios, whereas ionized PAHs have smaller ratios. The map showing the m to m PAH ratio (Fig. 2, left panel), shows a range222The method used to construct the SL spectral maps for the PAH features is equivalent to a spline fitting, as opposed to full fitting of the spectra (see §3.3). In general Smith et al. (2007a) find that for the 6.2 and m PAH features the full decomposition method measures intensities of about a factor of two higher than the spline method for both these two PAH features. We can then assume that the m to m PAH ratio map should give comparable results to the ratios fitted with pahfit. from approximately 0.2 to 0.9. From this figure it appears, as predicted by the models, that the lowest PAH ratios are associated with the regions of high ionization (i.e., high [Ne iii]/[Ne ii] line ratios) in the galaxy. In comparison, the regions with high m to m PAH ratios are to the northwest of A and to the east of B1 where there is no evidence for bright Pa emission associated with ionizing stellar populations (Fig. 5). We note however, that both this ratio and the m PAH/[Ne ii]m ratio are subject to extinction effects. This is because the m absorption feature is broad, and the m feature is inside it (see figure 3 of Smith et al. 2007a for the mid-IR extinction law of dust similar to that of the Milky Way). Thus, caution should be exercised when interpreting ratios involving the m PAH feature (see discussions by Beirão et al. 2008 and Pereira-Santaella et al. 2009). For example, the observed values for the nuclear regions of both galaxies (A and B1) are probably lower limits as both nuclei show significant values of extinction (§5 and §7.1).
4.3. Molecular Gas
The m H2 S(1) emission from IC 694 shows a more disk-like morphology compared to the mid-IR fine-structure emission lines, which mainly trace H ii emission in the spiral arms. The disk scenario for IC 694 is further confirmed by the observed H2 velocity field (Pereira-Santaella et al. 2009). NGC 3690 shows H2 emission from the B1+B2 area, and the C+C′ complex. The H2 S(1) emission of the whole system follows very closely the morphology of the molecular gas as traced by the 12CO line (Aalto et al. 1997; Casali et al. 1999), as also found by Sugai et al. (1999) for the near-IR H2 transitions.
4.4. Physical and Excitation Conditions of the gas
The [S iii]m/[Ne ii]m line ratio is almost insensitive to the hardness of the radiation field (i.e., age of the stellar population) and decreases with increasing densities, especially in the range, depending on the ionization parameter (see Snijders et al. 2007). The SH observed [S iii]m/[Ne ii]m line ratio map (Fig. 4) shows spatial variations on physical scales of kpc (pixels). Leaving aside the nuclear region of IC 694333the extinction corrections to the [S iii]m line (see extinction curve in Smith et al. 2007a and table 2 in Farrah et al. 2007) are non-negligible for this source (Table 2, and see also §7.1), the observed ratio varies between approximately 0.2 and 0.7.
Perhaps not surprisingly, those regions with the highest [S iii]m/[Ne ii]m ratios do not coincide with the brightest mid-IR emitting regions. Rather they are located mostly in the southern part of IC 694, and to the north of the C+C′ complex and south of B1. If this ratio traces the density (assuming a constant ionization parameter, cf §5 and 7) these would be the least dense regions in the system. The nuclei of the galaxies (B1 and A) present the lowest ratios (see also Tables 3, 4, and 5), and in particular A, the nuclear region of IC 694, would be the densest region, of the order of (for solar metallicity, see Snijders et al. 2007). The significant change of the gas properties between the spiral arms and the nuclear region of IC 694 observed in the [S iii]m/[Ne ii]m spectral map is consistent with the variations of the molecular line ratios (Aalto et al. 1997). The molecular properties of A require a population of unusually dense and warm clouds (see also Zhao et al. 1997). The C+C′ star-forming complex in the overlap region of the two galaxies presents [S iii]m/[Ne ii]m line ratios intermediate between those of the dense nuclear regions and the extranuclear regions of low surface brightness.
The [Ne iii]m/[Ne ii]m line ratio is sensitive to the hardness of the radiation field and has been quantitatively investigated by a number of works (e.g., Thornley et al. 2000; Martín-Hernández et al. 2002; Verma et al. 2003; Rigby & Rieke 2004; Snijders et al. 2007). This ratio has advantages over other mid-IR hardness-dependent line ratios, in that it is less affected by differential extinction than [S iv]m/[S iii]m, and can be measured from the SH spectra, unlike for instance [Ar iii]m/[Ar ii]m.
Figure 4 shows the SH map of the observed [Ne iii]m/[Ne ii]m line ratio, ranging from 0.2 to approximately 0.9. The two nuclei show the smallest ratios, whereas the C+C′ complex and the southern spiral arm of IC 694, which are known to host some of the youngest regions in the system, show intermediate values. The highest ratios, however appear to be connected with regions of low surface brightness (e.g., the region about 10″ northwest of B1). It is not clear if the ratios in these regions reflect the youth of the stellar population, as they do not seem to be associated with bright H ii regions detected in Pa (see Fig. 5), or rather result from other processes. For instance, there is bright diffuse UV emission to the west of sources B1 and B2 (Meurer et al. 1995). Moreover, a similar situation was observed in M82 where the [Ne iii]m/[Ne ii]m line ratio increases at increasing distances form the galactic plane (Beirão et al. 2008).
| Source | ||||||
|---|---|---|---|---|---|---|
| IC 694-A | 0.15 | 0.13 | 0.16 | 0.65 | 0.07 | |
| IC 694-F | 0.55 | 0.22 | 0.56 | 0.42 | 0.14 | |
| NGC 3690-B1(+B2) | 0.44 | 0.25 | 0.33 | — | 0.11 | |
| NGC 3690-C | 0.60 | 0.28 | 0.49 | 0.45 | 0.07 | |
| NGC 3690-C′ | 0.48 | 0.30 | 0.40 | 0.71 | 0.12 | |
| NGC 3690-HII-NWB2 | 0.64 | 0.21 | 0.55 | — | — |
| Source | ||||||||
|---|---|---|---|---|---|---|---|---|
| A | 0.27 | 0.18 | 0.28 | 0.18 | 0.10 | 0.8 | 2.3 | |
| B1+B2 | 0.52 | 0.22 | 0.40 | – | – | 1.2 | 1.4 | |
| C+C′ | 0.58 | 0.18 | 0.51 | – | – | 1.0 | 1.2 |
5. The nuclear region of NGC 3690: the obscured AGN (B1) and surrounding HII regions
We start out the detailed analysis of Arp 299 with the nuclear region of NGC 3690. This area contains two bright m continuum sources, namely B1 and B2 (Fig. 5, lower panel). B2 is the optical nucleus, while B1 becomes the dominant IR source at m in NGC 3690. B2 does not appear to be a bright source of mid-IR emission (Soifer et al. 2001). Direct evidence for an AGN in B1 comes from hard X-ray observations (Della Ceca et al. 2002; Zezas, Ward, & Murray 2003; Ballo et al. 2004) and optical spectroscopy (García-Marín et al. 2006). Given the large X-ray column density (, Della Ceca et al. 2002; Zezas et al. 2003) toward this source the estimates of the X-ray luminosity range from in the keV band (Ballo et al. 2004 from XMM observations), to in the keV band (Zezas et al. 2003 from Chandra data). Regardless of the uncertain absorption corrections for this source, both estimates put it in the low-luminosity AGN category. Apart from the bright near-IR B1 and B2 sources, there is star-formation around B1 detected both in Pa (see Fig. 5) and in the UV (Gallais et al. 2004 and Meurer et al. 1995), indicating that these regions of star formation must be relatively unobscured.
5.1. AGN high excitation mid-IR emission lines
The most direct way to identify an AGN in the mid-IR is through high excitation emission lines (e.g., Genzel et al. 1998; Sturm et al. 2002; Meléndez et al. 2008). These high excitation lines are unlikely to be produced by star-formation, but they are not always detected in relatively bright AGN (e.g., Weedman et al. 2005). Among the high excitation lines, the [Ne v]m and [O iv]m lines are found to be the brightest in nearby AGN. We note however, that extended [O iv]m line emission has been detected in some starburst galaxies, indicating that it can also be associated with star formation (Lutz et al. 1998). The [Ne v]m is not detected in the SH spectra of B1 and surrounding regions (see Fig. 6, top panel). From the SH spectrum we placed a limit to the [Ne v]m line of , consistent with the upper limit derived by Verma et al. (2003). The [O iv]m line on the other hand is detected in the staring mode LH spectrum (bottom panel of Fig. 6), and we measured a flux of (using an aperture correction for point source).
It is illustrative to compare B1 in NGC 3690 with the ULIRG NGC 6240, for which there is evidence for the presence of a double obscured AGN from X-ray observations (Komossa et al. 2003), radio observations (Gallimore & Beswick 2004), and the detection of both [Ne v]m and [O iv]m (Armus et al. 2006). The ratios between the keV (corrected for absorption) flux, and the [Ne v]m and [O iv]m line fluxes for NGC 6240 are approximately 20 and 4, respectively. Using the keV flux from the Chandra high spatial resolution data for the B1 source of Zezas et al. (2003) and the above flux ratios, we predict line fluxes of and . The predicted [Ne v] flux is in agreement with the upper limit estimated above, whereas the predicted [O iv] flux is below the observed values. Similarly, using the correlation between the luminosities of the keV emission and the [O iv]m line found by Meléndez et al. (2008) for a sample of Seyfert 1 galaxies, the estimated [O iv]m luminosity in B1 is slightly below our own measurement, but within the scatter of the empirical correlation of Meléndez et al. (2008).
5.2. Hot dust emission in B1 and the composite nature of the mid-IR spectrum
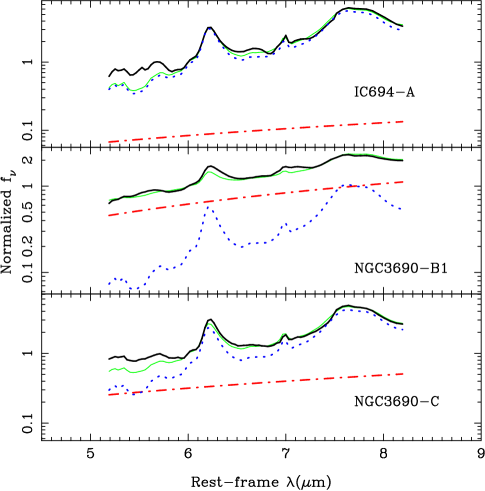
B1 appears as the brightest mid-IR continuum source of the entire system out to m (Figs. 6 and 7, and also Soifer et al. 2001; Charmandaris, Stacey, & Gull 2002). Gallais et al. (2004) remarked that this component shows a hot dust continuum at m, and they interpreted it as evidence for the presence of an AGN. This hot dust component is even detected down to m (Shier et al. 1996; AAH00).
The hot dust continuum can be seen in the SL spectra of B1 in Fig. 8, where the spectra of the three brightest sources are normalized at the m PAH feature. To quantify the hot dust emission we used a diagnostic method similar to that of Nardini et al. (2008) to separate the AGN and starburst components using mid-IR spectra. This method is based on the close similarity of the m spectra of high metallicity starbursts (see Brandl et al. 2006). Thus, any excess in the m spectral region can be attributed to continuum emission from hot dust. This hot dust component can be taken as an indicator of an AGN (see Nardini et al. 2008 for further details). For our estimate we used two different templates, the starburst template of Brandl et al. (2006) and the star-forming ULIRG template of Nardini et al. (2008). By using two different templates, one can estimate the uncertainties associated with this method. We found that the AGN contribution at m is (see Fig. 9) for the spectrum. This example illustrates the detection of a low-luminosity and/or heavily obscured AGN via the presence of a strong hot dust continuum at relatively short mid-IR wavelengths (m, see also Risaliti et al. 2006).
Given that the IRS apertures include the contribution from B1 (the AGN) and the surrounding H ii regions (see Fig. 5), it is reasonable to assume that this region be identified as a composite source (AGN + SB) based on several mid-IR diagnostics. To measure the apparent strength of the m silicate feature, defined as , we used a method similar to that outlined by Spoon et al. (2007) for sources dominated by PAH emission, fitting the continuum (see Fig. 8) as a power law with pivot wavelengths at 5.5 and m. Indeed, the measured EW of the m PAH feature (m) and the strength of the silicate feature () place source B1 in the Spoon et al. composite region, their 1B region. Similarly, using the [Si ii]m/[S iii]m vs. EW(m PAH) diagram from Dale et al. (2006), or the [Ne v]/[Ne ii] vs. EW(m PAH) diagram from Farrah et al. (2007), B1 would be classified as a composite system.
6. The star-forming C+C′ complex in the overlap region
Gehrz et al. (1983) identified the C+C′ complex in the overlap region of the two galaxies, as the most luminous starburst in Arp 299, based on the observed H luminosity. This region has been found to be not only very luminous, but also one of the youngest star-forming complexes in the system (e.g., Satyapal et al. 1999; Sugai et al. 1999; AAH00; Gallais et al. 2004; García-Marín et al. 2006), probably as the result of the interaction process. High angular resolution imaging at different wavelengths resolved the C+C′ complex into a number of star clusters and H ii regions (Meurer et al. 1995; Aalto et al. 1997; Casoli et al. 1999; AAH00; Soifer et al. 2001). C1, the brightest near-IR cluster (see AAH00 and Fig. 10) in the C region, and C′ are the most intense Pa sources in this region (see Fig. 10). Both appear to coincide with the bright radio and mid-IR sources in the overlap region.
The detection of the He i m line in C (Vanzi, Alonso-Herrero, Rieke 1998; Sugai et al. 1999) indicates that the temperature of the ionizing stars is high (K, see Vanzi et al. 1996; Förster-Schreiber et al. 2001). The observed He im/Br10 line ratio (Sugai et al. 1999) would imply an age younger than approximately 5 Myr for a solar metallicity instantaneous burst (see models by Rigby & Rieke 2004 and Snijders et. al 2007) or 7 Myr for super-solar models. The weak near-IR CO features (Ridgway, Wynn-Williams, & Becklin 1994; Sugai et al. 1999; AAH00; Imanishi & Nakanishi 2006) may indicate a lack of red supergiants confirming that this region is relatively young, but it is possible that the CO features are diluted by dust emission (see §6.3).
6.1. Extinction and Physical Conditions
The C+C′ complex appears to undergo varying degrees of obscuration based on the dust geometry as seen from the optical/near-IR color map of AAH00 (their figure 9). The dust distribution appears to be rather patchy and clumpy, especially near C1. This complicated dust configuration probably contributes to the range of extinctions (from a few magnitudes up to mag) derived for this source using different optical and near-IR hydrogen recombination lines as well as different sized apertures (Satyapal et al. 1999; Sugai et al. 1999; AAH00; García-Marín et al. 2006).
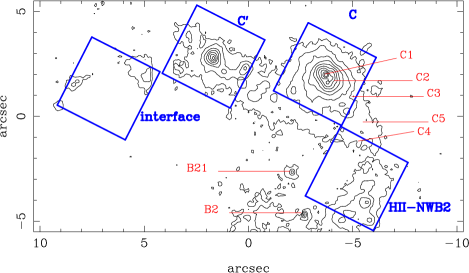
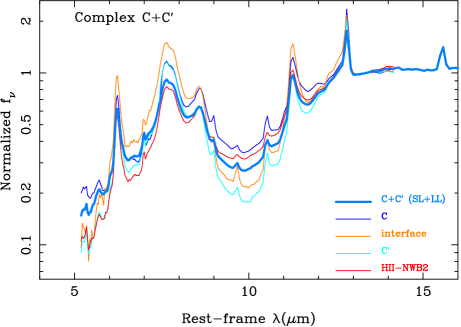
The SL+LL spectrum of C+C′ fitted with pahfit with a dust screen model provides an optical depth of (mag) over a region. Since the dust distribution of this region appears to be patchy, we used the smallest possible SL1+SL2 apertures () to extract spectra of four different regions in and around the C+C′ complex, to better isolate the different emitting sources. Apart from sources C and C′, the other two are a region at the interface of the galaxies southeast of C′, characterized by faint Pa emission, and an H ii region complex located approximately 3″ northwest of B2. This H ii region complex appears to be slightly older and less obscured than C and C′, based on optical data (see AAH00 and García-Marín et al. 2006). The approximate locations of the four regions are shown in Fig. 10.
We measured the apparent strength of the m silicate feature from the four SL1+SL2 spectra as described in §5.2. We found , , , and , for C, C′, the interface region, and the H ii region complex NW of B2, respectively. These translate into values of visual extinction of mag and mag, to C and C′, respectively. These values might only be lower limits as the broad PAH features at 7.7, 8.6 and m fill the absorption feature resulting in an underestimate of the true optical depth. For instance, using the SL+LL spectrum of the C+C′ complex we obtained , whereas the optical depth fitted with pahfit for the same region is (Table 2). In the case of C, Sugai et al. (1999) using near-IR lines in the Brackett series derived mag for a -diameter region, consistent with our estimate.
The [S iii]m/[S iii]m line ratio can be used as an electron density estimator, as it has a small dependence on other properties such as the metallicity, ionization parameter, temperature of the stars, and the age of the ionizing stellar population (see e.g., Alexander et al. 1999; Snijders, Kewley, & van der Werf 2007). This line ratio is also most sensitive to densities in the range of . Tables 2 and 4 give this ratio as obtained from the low (corrected for extinction) and high (not corrected for extinction) spectral resolution data, respectively. The physical sizes covered by the extraction apertures are of the order of kpc.
The [S iii]m/[S iii]m line
ratios (Tables 2 and 4) of the C+C′ complex are
similar to those measured in
other star-forming
galaxies on kiloparsec scales
(e.g., [S iii]m/[S iii] for the SINGS galaxies, Dale et al. 2007) and
consistent with densities of
the order of
(see also Verma et al. 2003).
6.2. Mid-IR Emission Lines and the Star-Formation Properties
The number of ionizing photons can be estimated from the [Ne ii] and [Ne iii] line luminosities using expressions such as those given by Roussel et al. (2006) and Ho & Keto (2007). These relations depend mainly on the neon abundance, and the radiation temperature. The dependence for the latter is through the fractional abundance of singly and doubly ionized neon. We took K. We also assumed that most of the neon in Arp 299 is only singly and doubly ionized, consistent with young stars being the dominant source of ionizing radiation. In contrast to Ho & Keto (2007), who used a fraction of 0.6 for the proportion of ionizing photons that are absorbed by the gas as opposed to absorbed by dust or escaping, we take this fraction to be equal to one, that is, in their equation 12. The last piece of information needed to estimate the ionizing photons is the neon abundance. Using ISO mid-IR spectroscopy Verma et al. (2003) measured super-solar neon abundances in the two components of Arp 299. Further evidence for super-solar abundances in this system comes from the oxygen abundance of derived from the optical spectroscopy of Moustakas & Kennicutt (2006) and using the Kobulnicky & Kewley (2004) calibration (John Moustakas, private communication). This oxygen abundance is consistent with the range derived by Rupke, Veilleux, & Baker (2008) for a large sample of LIRGs in the local universe. We computed the number of ionizing photons using the expression given by Ho & Keto (2007) but using the neon abundances derived by Verma et al. (2003) for NGC 3690, that is, [Ne/H] instead of the solar value of [Ne/H].
Under the assumptions stated above we find and for C and C′, respectively. The value for C is a factor of 10 lower than the estimate from Pa using mag derived by AAH00. Using the values of mag and mag derived for C and C′, and the Br fluxes of Sugai et al. (1999), which were measured through -diameter apertures, we get and , respectively. The discrepancy between estimated from extinction-corrected Br and from the neon fine structure lines could be explained if some of the ionized gas is at densities exceeding for the neon lines. This situation would arise if ultra-compact H ii regions play an important role in the star formation in regions C and C’, as suggested by Rigby & Rieke (2004) for luminous young starbursts in general. We return to this possibility at the end of §6.3.
The ionization parameter (defined as ) can then be estimated measuring approximate sizes of the nebulae from the HST/NICMOS Pa images: pc and pc, for C and C′, respectively, and taking . We find for both C and C′, using the neon line and hydrogen recombination line estimates of .
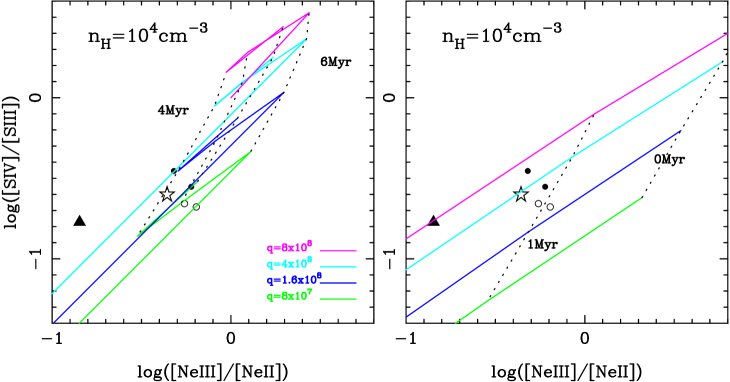
We now make the simplifying assumption that the ionized gas can be divided entirely between high and low density regions. We use the mid-infrared fine structure lines to diagnose conditions in the low-density region. Diagrams involving mid-IR line ratios of the same element can be used to estimate the age of stellar population, although there is some degeneracy between the age and the ionization parameter. We use the Snijders et al. (2007) predictions of the age evolution of mid-IR fine-structure emission lines. These are calculated by combining the outputs of Starburst99 (Leitherer et al. 1999) and the photoionization code Mappings (Dopita et al. 2000). The stellar populations are assumed to have been formed in an instantaneous burst of star formation with a Salpeter IMF (between 0.1 and ). Given the abundances measured in Arp 299 we used the models.
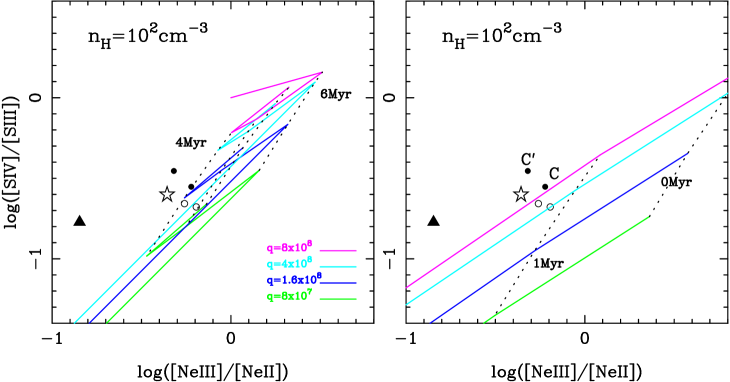
Figure 11 is a [Ne iii]m/[Ne ii]m vs. [S iv]m/[S iii]m line ratio diagram with the model predictions of Snijders et al. (2007). We show the models for two nebular densities, , the low-density limit typical of star-forming galaxies (see above), and to account for the high density nuclear region of IC 694 (see §7.1). We also show the model predictions for three ionization parameters representative of those measured in different sources in Arp 299 (see also §7.2 for A).
The line ratios (measured with the aperture) for C and C′ together with those of other sources444We also plotted in Fig. 11 the line ratios of B1. We caution the reader that with the spatial resolution of the IRS data we cannot estimate what fraction of the emission line fluxes originates from the AGN and what fraction from the surrounding H ii regions. Thus we do not discuss the star-formation properties of B1 based on this diagram in the system are plotted in Fig. 11. The right panel gives the time evolution for the first few million years. The line ratios drop very fast as the most massive stars move off the main sequence with a minimum at about 3 Myr. After that the first Wolf-Rayet (W-R) stars begin to appear the ratios increase again (left panel of Fig 11) for the duration of the W-R phase (out to approximately 7 Myr for the super-solar models, Leitherer et al. 1999; Snijders et al. 2007). Given the measured ionization parameters for C and C′, we can rule out the youngest ages for these two sources. The mid-IR line ratios in Fig. 11s could be reproduced with ages Myr, using the models. A summary of the mid-IR derived properties of the low density zones in C and C′ sources is given in Table 5. It is interesting to note however, that given the derived ranges of and ages, the [S iii]m/[Ne ii]m line ratios can only be reproduced with relatively high nebular abundances ().
6.3. W-R features, hot dust and radio emission
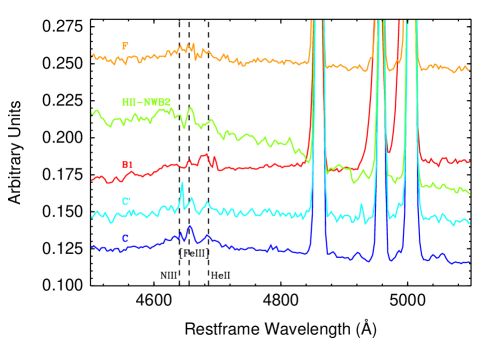
To further explore the possible presence of young stellar populations in this region, we looked for the W-R broad He ii feature at 4686Å in the optical integral field spectroscopy (IFS) of García-Marín et al. (2006). The detection of this feature provides direct evidence for the presence of a large population of hot, massive and young stars (Vacca & Conti 1992). The optical spectra of a few bright sources in Arp 299 are shown in Fig. 12. The W-R broad He ii feature at 4686Å is clearly detected in C and C′, in the H ii regions surrounding B1, and tentatively detected in the H ii region complex NW of B2. The high metallicity models predict more W-R stars over an extended lifetime compared with solar metallicity (Leitherer et al. 1999). Specifically the models predict that stars enter the W-R phase at about 2.5 Myr and dominate the radiation field out to 7 Myr (see Snijders et al. 2007 for more details).
C and C′ are also bright radio sources (Gehrz et al. 1983; Neff et al. 2004) with observed radio spectral indexes555defined as , where are the flux densities at 4.9 and 8.4 GHz of and , respectively (Neff et al. 2004). Models for the radio thermal emission of young stellar populations (Myr) and solar metallicity predict (Pérez-Olea & Colina 1995), indicating that some fraction of the radio emission must originate from supernovae. Using the derived in §6.2 from Br, the predicted thermal emission (see Colina & Pérez-Olea 1992) would account for approximately 30% of the observed emission at 1.4 GHz (Gehrz et al. 1983) from C through a aperture. We cannot make meaningful comparisons at the other radio frequencies (4.9 and 8.4 GHz), because the measurements of Gehrz et al. (1983) were with beam sizes () much smaller than our typical angular resolution (see §2.1). Given this, it is possible that both C and C′ are just now beginning a significant supernova activity, consistent with the lack of young radio supernovae (Neff et al. 2004). All these facts confirm an age of C and C′ of approximately Myr derived from the mid-IR line ratios, rather than extremely young bursts (see §6.2).
Adding to this rather complicated situation, is the presence of a hot dust component, which accounts for approximately % of the m emission in C within the SL aperture (see Fig. 9). A hot dust continuum has also been found based on the observed EW of the 3.3m PAH feature (Imanishi & Nakanishi 2006). Hot dust is uncommon in starbursts of the luminosity of C (Ridgway et al. 1994). However, it is unlikely that this dust is associated with a buried AGN, as there is no other evidence for the presence of an active nucleus.
The hot dust can be associated with ultra-compact regions, whose presence is also indicated by the discrepancy in deduced from Pa and the neon fine structure lines. It is likely that what we are calling source C is in reality a collection of different sources with different ages, as already hinted by the detection of a number of near-IR continuum sources in the large Pa nebula (see Figs. 5 and 10). Source C is reminiscent of the nuclear region of the W-R galaxy Henize 2-10, which hosts young clusters, ultra-dense H ii regions, and possibly supernova remnants within the central few hundred parsecs (see Cabanac, Vanzi, & Sauvage 2005; Martín-Hernández et al. 2006).
The discovery that ultra-compact regions play an important role in the young star-forming regions in C and C’ supports the hypothesis of Rigby & Rieke (2004). They proposed that large numbers of such regions would account for the lack of high-excitation emission lines in starbursts without imposing restrictions on the initial mass functions in them.
7. The nuclear region of IC 694 (A)
From the early studies of this interacting system, the star-formation properties of the nuclear region of IC 694 were found difficult to model, in part due to the strong dust extinction that obscures most of the H emission and in part due to the presence of bright radio emission (Gehrz et al. 1983). It also became apparent that this source alone might be responsible for about half of the total IR luminosity of the system (Gehrz et al. 1983; Joy et al. 1989; Keto et al. 1997; Charmandaris et al. 2002). Near-IR imaging and spectroscopic observations were able to partially overcome the strong obscuration to the nucleus of IC 694. Sugai et al. (1999) and AAH00 showed that this nuclear region is affected by strong obscuration, and that the observed properties are the result of an extended period of star formation (see also Shier et al. 1996). In fact, the star-formation activity of source A appears to be older than that of the other bright components of the system. This conclusion was later reinforced by the detection of a number of radio sources in the central 0.6″ of A, which could only be explained as supernova remnants (Neff et al. 2004; Ulvestad, Johnson, & Neff 2007) from a relatively evolved star formation (Myr after the peak of the activity). Other works suggested the presence of an obscured AGN in the nucleus of IC 694. This possibility is discussed in §7.3.
| Source | Age | Hot dust | ||||
|---|---|---|---|---|---|---|
| (1) | (2) | (3) | (4) | (5) | (6) | (7) |
| A | 34 | 10-20% | ||||
| B1 | 14 | — | — | — | 80-90% | |
| C | 7 | 30-40% | ||||
| C′ | 12 | – |
Notes.—- Column (1): Source. Column (2): Optical extinction in magnitudes as derived from the optical depth of the m absorption feature. For A the value is that obtained from pahfit, whereas for the other sources the apparent depth was measured as explained in §5.2. Column (3): Electron density in cm-3 from the [S iii]m/[S iii]m line ratio. Column (4): Age estimate in Myr from mid-IR line ratios. Column (5): Number of ionizing photons in units of estimated from the [Ne ii]m and [Ne iii]m emission lines. The two neon line fluxes were measured in apertures for C and C′, and for for source A. The neon abundances used are 2.2 and 1.7 solar for A, and C+C′, respectively (Verma et al. 2003). Column (6): Range of possible ionization parameters in units of cm s-1, using the two estimates of the number of ionizing photons, from neon lines and Br measurements of Sugai et al. (1999). Column (7): Hot dust contribution to the m luminosity using a method similar to that described by Nardini et al. (2008).
7.1. Extinction and Physical Conditions
The overall shape of the low-resolution spectra of the nuclear region of IC 694 appears to be remarkably different from the other components of Arp 299 (see Fig. 7 and 8, and Gehrz et al. (1983). The mid-IR spectrum of A shows a much deeper absorption at m (see also Gallais et al. 2004), and m than the other components in the system and than the average spectrum of starburst galaxies (Brandl et al. 2006). The depth of the silicate feature is comparable to the values observed in local ULIRGs (see e.g., Spoon et al. 2007; Armus et al. 2007; Farrah et al. 2007). pahfit fits a m apparent optical depth of for the dust screen model. Using the Rieke & Lebofsky (1986) extinction law this optical depth implies an extinction of mag (see also Gallais et al. 2004), comparable to, although higher than, the near-IR estimates (e.g., Beck, Turner, & Ho 1986; Sugai et al. 1999; AAH00). We note, however, that the observed apparent optical depth of A and other ULIRGs cannot be reproduced with a foreground dust screen, and they require the dust to be in a deeply embedded and optically thick smooth distribution (Levenson et al. 2007).
The nuclear region of IC 694 over a 2 kpc scale shows a much lower [S iii]m/[S iii]m line ratio (corrected for extinction) than the nuclear region of NGC 3690 (B1) and the C+C′ complex. Using the photoionization models of Snijders et al. (2007), the observed sulfur ratios of the central kpc of IC 694 would imply densities of the order of (see also models of Alexander et al. 1999). This indicates that the nuclear region of IC 694 has a density higher than the typical values inferred for starburst galaxies from mid-IR spectra (, Verma et al. 2003; Dale et al. 2006).
The high density of the nuclear region of IC 694 derived from the [S iii] lines is in agreement with the modelling of the radio H92 transition of Zhao et al. (1997). They found values of at the very center and in the nuclear extension about southeast of the center (also seen in the HST/NICMOS Pa map, Fig. 5). Aalto et al. (1997) also found that the high 12CO/13CO molecular line ratio of the A nuclear region implied a population of unusually dense and warm clouds, due primary to small or moderate optical depth of the 1-0 12CO transition.
7.2. Mid-IR Emission Lines and the Star-Formation Properties
The number of ionizing photons arising from the central region of IC 694 has been estimated by a number of IR and radio methods, and is in the range (Shier, Rieke, & Rieke 1996; Zhao et al. 1997; Sugai et al. 1999; AAH00). We can obtain an independent estimate from the extinction-corrected666mag and the Rieke & Lebofsky (1985) extinction law [Ne ii]m and [Ne iii]m luminosities measured with the SH aperture, as explained in §6.2 and using the neon abundance inferred by Verma et al. (2003). We find from the neon lines. As found for C and C′ the number of ionizing photons from the neon lines is a factor of a few lower than other estimates from hydrogen lines. The corresponding range of ionization parameters is using a size of the nebula of pc measured from the HST/NICMOS Pa image), , and the number of ionizing photons from the neon lines and the Br measurements of Sugai et al. (1999).
The observed mid-IR line ratios ([Ne iii]m/[Ne ii]m and [S iv]m/[S iii]m) of source A are shown in Fig. 11 with the filled triangle symbol. Since the highest possible ionization parameter for A would be (i.e., using the number of ionizing photons from the Br line of Sugai et al. 1999), we can rule out the youngest age for A (Myr, lower right panel of Fig. 11). The mid-IR line ratios from A would be better explained with an evolved starburst Myr (lower left panel of Fig. 11). This is consistent with the age derived from the radio and near-IR properties. We also note that models with constant or quasi-constant (e.g., exponentially decaying with long timescales) star formation can also be excluded for this source as such models would predict high mid-IR line ratios for all ages (see Thornley et al. 2000; Rigby & Rieke 2004).
7.3. No mid-IR evidence for an obscured AGN
Early suggestions for the presence of an obscured AGN in A were based on the compact nature of the radio emission (e.g., Sargent & Scoville 1991; Lonsdale, Lonsdale, & Smith 1992). Ballo et al. (2004) measured an X-ray luminosity for A similar to that of B1 (see §5), and found it could not be accounted for by star formation alone. In contrast, Zezas et al. (2003) were able to explain this luminosity in terms of high mass X-ray binaries as estimated from the number of ionizing photons. The water megamaser properties of this nucleus do not exclude the possibility of an AGN in A (Tarchi et al. 2006).
As for B1 we did not detect the high excitation [Ne v]m emission line, typical of AGN. The [O iv]m is detected in the LH staring mode spectrum (bottom panel of Fig. 6) with a measured flux of . Unfortunately the limited spatial resolution of the LH data does not allow us to determine whether the integrated [O iv] emission overr the LH slit () is extended or not. Using the rest-frame m spectrum and the method described in §5.2, the contribution from hot dust at m is estimated to be approximately 20%. Given the uncertainties of the method, this contribution is formally compatible with pure star formation (see Fig. 9). Finally the location of A on the diagram of EW of the m PAH feature vs the depth of the silicate feature (Spoon et al. 2007) is similar to that of M82, and thus consistent with obscured star formation.
8. Arp 299 in the context of local and high-z IR-bright galaxies
The unprecedented sensitivity of IRS on Spitzer is making it possible to characterize the mid-IR spectra of IR bright-galaxies at . Perhaps one of the most surprising results is that a large fraction of these high- IR-selected galaxies are classified as ULIRGs in terms of their IR luminosities, but their mid-IR spectra are more similar to those of local star-forming galaxies (e.g., Yan et al. 2007; Farrah et al. 2008; Rigby et al. 2008). That is, ULIRGs at high- show strong PAH features and moderate depths of the m silicate feature. This is in contrast with their local counterparts that tend to show very deep silicate features and moderate to low equivalent widths of the PAHs (e.g., Spoon et al. 2006; Armus et al. 2007; Farrah et al. 2007).
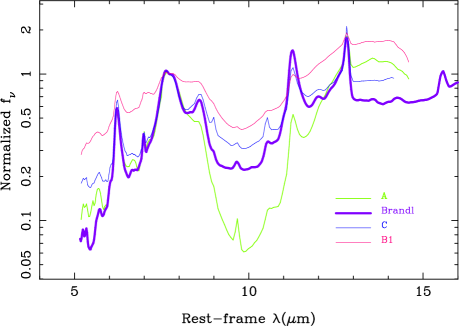
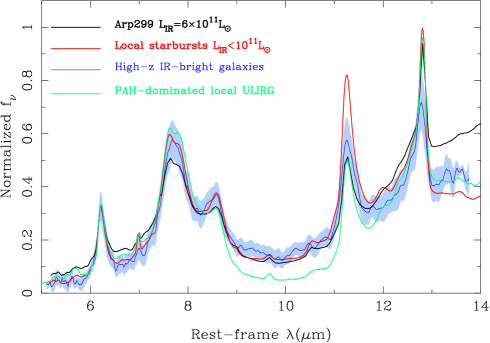
Figure 13 shows a comparison of the integrated spectrum of Arp 299 with the average template of starbursts from Brandl et al. (2006). It is immediately clear from this figure that the two mid-IR m spectra are quite similar, at least in terms of the PAH features, despite the different range of IR luminosities of the galaxies included in the starburst template777This template is the average of 13 starburst galaxies, of which two galaxies are just above the LIRG limit, whereas the rest of the galaxies have IR luminosities between and .. It is also clear that the integrated mid-IR spectrum of Arp299 is not dominated by the strongly obscured source in the nuclear region of IC 694 (see Fig. 7). The apparent strength of the m silicate feature of the integrated spectrum is , similar to the typical values shown by starburst galaxies (Spoon et al. 2007; Brandl et al. 2006), whereas for source A we find . We also show in this comparison the average template of local PAH-dominated ULIRGs (the 2C class of Spoon et al. 2007), which is similar in terms of the PAH features but it has a deeper silicate feature. The other dominant class of local ULIRGs (not shown in Fig. 13), the 3C class in the Spoon et al. (2007) classification, has a much deeper silicate feature and low EW of the PAH features, and it is even more different from the integrated spectrum of Arp 299 .
We also show in Fig. 13 the average spectrum of the sample of high- ULIRGs (and even higher IR luminosities) of Farrah et al. (2008). The galaxies in this sample were selected such that they showed a strong m feature and bright m fluxes, and are mostly in a narrow redshift range around . The similarity between the integrated spectrum of Arp 299 and these high- ULIRGs is quite remarkable. One of the favored explanations for the observed mid-IR spectra of high- ULIRGs is that star formation is diffuse and extended, or distributed in multiple dusty star-forming regions spread over several kiloparsecs. Arp 299 behaves in this manner and may be a local counterpart of the star formation processes taking place in high- IR-bright galaxies (see also Charmandaris, Le Floc h, & Mirabel 2004), albeit with a lower IR luminosity and possibly higher metallicity. This is in contrast with local ULIRGs where most of the star-formation is occurring in the nuclei of the galaxies on sub-kiloparsec scales (Soifer et al. 2000).
9. Conclusions
We have presented Spitzer/IRS spectral mapping of the central of Arp 299 (IC 694 + NGC 3690). The IRS data combined with HST/NICMOS imaging and optical ground-based IFS allowed us to study in detail the morphological distribution of mid-IR spectral features as well as the mid-IR properties of the brightest sources in the system. We used a number of mid-IR indicators to derive the star formation properties (ages, number of ionization photons, and ionization parameters) and physical conditions of selected regions in the system. The main conclusions of this study are:
-
•
The spatial distribution of the bright mid-IR emission lines follows well the ionizing stellar populations as probed by the HST/NICMOS Pa emission. High [Ne iii]m/[Ne ii]m and [S iv]m/[S iii]m line ratios mark the location of the youngest regions, that is, the C+C′ complex and H ii regions in the disks of the galaxies.
-
•
Most regions in the system show [S iii]m/[S iii]m line ratios similar to those typical of star-forming galaxies, implying densities of the order of . Only the ratios of the nuclear region of IC 694 indicate higher densities, , in agreement with previous results for this source from radio hydrogen emission and molecular CO line ratios.
-
•
The extinction as estimated from the optical depth of the m silicate feature is found to vary significantly from region to region in Arp 299. For the nuclear region of IC 694 we measured or mag, comparable to the optical depths measured in local ULIRGs. The other bright sources of the system (B1, C, and C′) show more moderate values of the extinction ranging from 7 to 14 mag.
-
•
Both m and m PAH emission is detected in the bright sources of the system as well as at the interface region connecting the two galaxies. There is a tendency for the observed to m PAH feature ratio to be higher in regions of low ionization, although the observed m PAH feature emission can be significantly reduced in regions with elevated extinction.
-
•
The mid-IR line ratios suggest that youngest stellar populations (Myr, using models) are mainly located in the overlap region of the two galaxies (the C+C′ complex), the southern spiral arm of IC 694, and the H ii region complex to the northwest of the nuclear region of NGC 3690. The detection of optical W-R features in C and C′ provides further evidence for the youth of these regions. The extended lifetimes of super-solar metallicity W-R stars means that they can dominate the radiation field to older ages (out to Myr). In contrast, the mid-IR properties of the nuclear region of IC 694, in particular the low [Ne iii]/[Ne ii] line ratios, confirm that the star formation activity there is slightly older and more extended in time than in the aforementioned regions.
-
•
Evidence for hot dust emission in the m spectral region for B1, the nuclear region of NGC 3690. B1 hosts an X-ray and optically identified low-luminosity AGN. The AGN is likely to be responsible for of the m emission (within a aperture).
-
•
In C, the overlap region between the two galaxies and a site of very recent star formation, we found both hot dust and also evidence that a portion of the ionized gas may be in very dense regions, above the critical densities for [Ne ii] and [Ne iii]. The hot dust continuum contributes at m. Given that there is no other indication for the presence of an AGN in C, we interpreted it as produced by dust heated by a young star cluster or clusters. Both of these results may be consistent with the presence of a substantial population of ultra-compact H ii regions.
-
•
The integrated mid-IR spectrum of Arp 299 is similar to that of local starbursts despite its strongly interacting nature and high IR luminosity. This is because the star formation in this system is spread across at least 6-8 kpc, with a large fraction taking place in regions of moderate mid-IR optical depths. It is only the nuclear region of IC 694 that shows the typical mid-IR characteristics of ULIRGs, that is, very compact and embedded star formation resulting in a deep silicate feature and moderate EW of the PAHs. We also find that the integrated m spectrum of Arp 299 is similar to the average spectrum of the high- sample of Farrah et al. (2008). This suggests that the Arp 299 system may represent a local example, albeit with lower IR luminosity and possibly higher metallicity, of the processes occurring in high- IR-bright galaxies.
References
- (1) Aalto, S., Radford, S. J. E., Scoville, N. Z., & Sargent, A. I. 1997, ApJ, 475, L107
- (2) Alexander, T. et al. 1999, ApJ, 512, 204
- (3) Alonso-Herrero, A., Rieke, G. H., Rieke, M. J., & Scoville, N. Z. 2000, ApJ, 532, 845 (AAH00)
- (4) Alonso-Herrero, A. et al. 2006, ApJ, 650, 835
- (5) Armus, L. et al. 2006, ApJ, 640, 204
- (6) Armus, L. et al. 2007, ApJ, 656, 148
- (7) Arp, H. C. 1966, Atlas of Peculiar Galaxies (Pasadena: California, Institute of Technology)
- (8) Ballo, L. et al. 2004, ApJ, 600, 634
- (9) Beck, S. C., Turner, J. L., & Ho, P. T. P. 1986, ApJ, 309, 70
- (10) Beirão, P. et al. 2008, ApJ, 676, 304
- (11) Brandl, B. et al. 2006, ApJ, 653, 1129
- (12) Cabanac, R. A., Vanzi, L., & Sauvage, M. 2005, ApJ, 631, 252
- (13) Caputi, K. et al. 2006, A&A, 454, 143
- (14) Caputi, K. et al. 2007, ApJ, 660, 97
- (15) Casoli, F. et al. 1999, A&A, 346, 663
- (16) Charmandaris, V., Stacey, G. J., & Gull, G. 2002, ApJ, 571, 282
- (17) Charmandaris, V., Le Floc h, E., & Mirabel, I. F. 2004, ApJ, 600, L15
- (18) Colina, L., & Pérez-Olea, D. E. 1992, MNRAS, 259, 709
- (19) Dale, D. A. et al. 2006, ApJ, 646, 161
- (20) Della Ceca, R. et al. 2002, ApJ, 581, L9
- (21) Dopita, M. A. et al. 2000, ApJ, 542, 22
- (22) Draine, B. T. & Li, A. 2001, ApJ, 551, 807
- (23) Dudley, C. C. 1999, MNRAS, 307, 553
- (24) Elbaz, D., Cesarsky, C. J., Chandal, P., Aussel, H., Franceschini, A., Fadda, D., & Chary, R. R. 2002, A&A, 384, 848
- (25) Farrah, D. et al. 2008, ApJ, 677, 957
- (26) Farrah, D. et al. 2007, ApJ, 667, 149
- (27) Förster-Schreiber, N. M. et al. 2001, ApJ, 552, 544
- (28) Gallais, P., Charmandaris, V., Le Floc’h, E., Mirabel, I. F., Sauvage, M., Vigroux, L., & Laurent, O. 2004, A&A, 414, 845
- (29) Gallimore, J. F., & Beswick, R. 2004, AJ, 127, 239
- (30) García-Marín, M., Colina, L., Arribas, S., Alonso-Herrero, A., & Mediavilla, E. 2006, ApJ, 650, 850
- (31) Gehrz, R. D., Sramek, R. A., & Weedman, D. W. 1983, ApJ, 267, 551
- (32) Genzel, R. et al. 1998, ApJ, 498, 579
- (33) Ho, L., & Keto, E. 2007, ApJ, 658, 314
- (34) Houck, J. R. et al. 2004, ApJS, 154, 18
- (35) Imanishi, M., & Nakanishi, K. 2006, PASJ, 58, 813
- (36) Joy, M. et al. 1989, ApJ, 339, 100
- (37) Keto, E. et al. 1997, ApJ, 485, 598
- (38) Kobulnicky, H. A., & Kewley, L. J. 2004, ApJ, 617, 240
- (39) Komossa, S. et al. 2003, ApJ, 582, L15
- (40) Le Floc’h, E. et al. 2005, ApJ, 632, 169
- (41) Leitherer, C. et al. 1999, ApJS, 123, 3
- (42) Levenson, N. A., Sirocky, M. M., Hao, L., Spoon, H. W. W., Marshall, J. A., Elitzur, M., & Houck, J. R. 2007, ApJ, 654, L45
- (43) Li, A., & Draine, B. T. 2001, ApJ, 554, 778
- (44) Lonsdale, C. J., Lonsdale, C. J., & Smith, H. E. 1992, ApJ, 391, 629
- (45) Lutz, D., Kunze, D., Spoon, H. W. W., & Thornley, M. D. 1998, A&A, 333, L75
- (46) Martín-Hernández, N. L. et al. 2002, A&A, 389, 286
- (47) Martín-Hernández, N. L. et al. 2006, A&A, 455, 853
- (48) Meléndez, M. et 2008, ApJ, 682, 94
- (49) Meurer, G. R., Heckman, T. M., Leitherer, C., Kinney, A., Robert, C., & Garnett, D. R. 1995, AJ, 110, 2665
- (50) Moustakas, J., & Kennicutt, R. Jr. 2006, ApJS, 164, 81
- (51) Nardini, E. Risaliti, G., Salvati, M., Sani, E., Imanishi, M., Marconi, A., & Maiolino, R. 2008, MNRAS, 385, 130
- (52) Neff, S. G., Ulvestad, J. S., & Teng, S. H. 2004, ApJ, 611, 186
- (53) Pérez-González, P. G. et al. 2005, ApJ, 630, 82
- (54) Pérez-Olea, D. E., & Colina, L. 1995, MNRAS, 277, 845
- (55) Ridgway, S. E., Wynn-Williams, C. G., & Becklin, E. E. 1994, ApJ, 428, 609
- (56) Rieke, G. H., & Low, F. J. 1972, ApJ, 176, L95
- (57) Rieke, G. H., & Lebofsky, M. J. 1985, ApJ, 288, 618
- (58) Rigby, J. R., & Rieke, G. H. 2004, ApJ, 606, 237
- (59) Rigby, J. R. et al. 2008, ApJ, 675, 262
- (60) Risaliti, G. et al. 2006, MNRAS, 365, 303
- (61) Roussel, H. et al. 2006, ApJ, 646, 841
- (62) Rupke, D. S. N., Veilleux, S., & Baker, A. J. 2008, ApJ, 674, 172
- (63) Sanders, B. T., & Mirabel, F. I. 1996, ARA&A, 34, 749
- (64) Sanders, B. T. et al. 2003, AJ, 126, 1607
- (65) Sargent, A., & Scoville, N. Z. 1991, ApJ, 366, L1
- (66) Satyapal, S. et al. 1999, ApJ, 516, 704
- (67) Shier, L. M., Rieke, M. J., & Rieke, G. H. 1996, ApJ, 470, 222
- (68) Smith, J. D. T. et al. 2007a, ApJ, 656, 770
- (69) Smith, J. D. T. et al. 2007b, PASP, 119, 1133
- (70) Snijders, L., Kewley, L. J., & van der Werf, P. P. 2007, ApJ, 669, 269
- (71) Soifer, B. T. et al. 2000, AJ, 119, 509
- (72) Soifer, B. T. et al. 2001, AJ, 121, 1213
- (73) Spoon, H. W. W. et al. 2007, ApJ, 654, L49
- (74) Sturm, E. et al. 2002, A&A, 393, 821
- (75) Sugai, H., Davies, R. I., Malkan, M.A., McLean, I. S., Usuda, T., & Ward, M. J. 1999, ApJ, 527, 778
- (76) Tarchi, A., Castangia, P., Henkel, C., & Menten, K. M. 2007, NewAR, 51, 67
- (77) Thornley, M. D. et al. 2000, ApJ, 539, 641
- (78) Ulvestad, J. S., Johnson, K. E., & Neff, S. G. 2007, AJ, 133, 1868
- (79) Vacca, W. D. & Conti, P. S. 1992, ApJ, 401, 543
- (80) Vanzi, L. et al. 1996, ApJ, 446, 150
- (81) Vanzi, L., Alonso-Herrero, A., & Rieke, G. H. 1998, ApJ, 504, 93
- (82) Verma, A. et al. 2003, A&A, 403, 829
- (83) Weedman, D. W. 1972, ApJ, 171, 5
- (84) Weedman, D. W. et al. 2005, ApJ, 633, 706
- (85) Yan, L. et al. 2007, ApJ, 658, 778
- (86) Zezas, A., Ward, M. J., & Murray, S. S. 2003, ApJ, 594, L31
- (87) Zhao, J.-H., Anantharamaiah, K. R., Goss, W. M., & Viallefond, F. 1997, ApJ, 482, 186