QPO Evolution in 2005 Outburst of the Galactic Nano Quasar GRO J1655-40
Abstract
GRO J1655-40 showed significant X-ray activity in the last week of February, 2005 and remained active for the next 260 days. The rising and the decline phases of this particular outburst show evidence for systematic movements of the Comptonizing region, assumed to be a CENBOL, which causes the Quasi-periodic Oscillations or QPOs. We present both the spectral and the timing results of the RXTE/PCA data taken from these two hard spectral states. Assuming that the QPOs originate from an oscillating shock CENBOL, we show how the shock slowly moves in through the accretion flow during the rising phase at a constant velocity and accelerate away outward during the later part of the decline phase. By fitting the observed frequencies with our solution, we extract time variation of various disk parameters such as the shock locations, velocity etc.
Keywords:
Black Holes, X-ray sources, Shock waves1 Introduction
The galactic nano-quasar GRO J1655-40 is an interesting Low Mass X-ray Binary (LMXB) with a primary mass (Orosz97 , Vander98 ) and the companion star mass = (Bailyn95 ) located at a distance of kpc (Hje95 ) The disk has an approximate inclination angle of (Orosz97 ) with the line of sight. It was first observed by BATSE on board CGRO on 27th July 1994 (Zhang94 ) This source was dormant for years since 1997. During the 1996-1997 outburst, it exhibited QPOs in Hz frequency range. Later, Strohmayer01 reported a QPO at Hz. In the last week of February, 2005 it became X-ray active (see, ch05 & ch08 and references therein) and remained so for the next 260 days before returning to the hard state again. It exhibited a very complex spectral behavior during this time, details of which will be dealt with elsewhere Debnath08 .
In this article, we present a through analysis of the first two weeks of the very initial stage (onset phase) and the very last three weeks of the final stage (decline phase) of the 2005 outburst. We study in detail the behavior of QPO frequency in these two phases and show that a satisfactory explanation of this behavior can be obtained if we assume that an oscillating shock which is sweeping through the disk inward in the rising phase and outward in the decline phase is responsible for the QPOs.
2 Origin of QPOs in black hole candidates
Observations of Quasi-Periodic Oscillations (QPOs) in black hole candidates have been reported quite extensively in the literature (e.g., CM00 ; Rod04 ) and they are variously interpreted to be due to trapped oscillations and disko-seismology (Kato00 ; Rod02 ), oscillations of warped disks (Shi02 ), accretion-ejection instability at the inner radius of the Keplerian disk (Rod02 , Var03 ), global disk oscillations (Tit00 ), shock oscillations (MSC96 ; CM00 ) etc. The numerical simulations of accretion flows having QPOs have been reported also (MSC96 ; CAM04 ; RCM97 ) . Moreover, CAM04 showed that the power-density spectra (PDS) of the simulated light curves are similar to what are observed. Shock locations were found to be a function of the cooling rate (MSC96 ) and they were found to propagate when viscous effects are turned on (CM95 ). Presently, we will consider shock oscillation solution because, as explained in MSC96 and below, it is conceptually simpler the unknown ‘blobs’ and moreover, shocks are naturally produced in sub-Keplerian flows around black holes (See Chakrabarti, this volume). Perturbations inside a Keplerian disk has been used (e.g., TCG99 ) but it is not clear how these perturbations would survive for long.
In the shock oscillation solution (MSC96 ; CM00 ; CAM04 ), the shock were found to oscillate typically at a frequency inverse of the in-fall time in the post-shock region (CM00 ; ch05 & ch08 ). Here, is the shock strength (ratio of the post-shock to pre-shock density), is the shock location in units of the Schwarzschild radii , and is the flow velocity in the post-shock region in units of the velocity of light. Thus, the instantaneous QPO frequency (in ) is expected to be,
Here, is the inverse of the light crossing time of the black hole of mass in and is the velocity of light. In a drifting shock scenario, is the time-dependent shock location given by,
Here, is the shock location when is zero and is the shock velocity in c.g.s. units. The positive sign in the second term is to be used for an outgoing shock in the decline phase and the negative sign is to be used for the in-falling shock in the onset phase. Here, is measured in seconds since the first detection of the QPO.
The physical reason for the oscillation of shocks is straightforward. It due to the resonance between the cooling time scale in the post-shock region and the infall time scale. This oscillation can also take place when the Rankine-Hugoniot shock conditions are not fulfilled even though two saddle type sonic points are present and therefore no steady shock wave is possible. Thus, the QPO frequency directly gives an estimate of the shock location (Eq. 1). In many objects cases, QPO frequencies are khown to rise with luminosity (ST06 ). In our solution, since an enhancement of the accretion rate increases the local density and thus the cooling rate, the resulting drop of the post-shock pressure reduces the shock location and increases the oscillation frequency. Also, CM00 and Rao00 showed that QPOs from the Comptonized photons have the tendency to have a higher value. This is consistent with the fact that the post-shock regions are also the regions of Comptonization of the soft photons CT95 in this TCAF model.
3 Observational results and the analysis
We concentrate on the data of Observational IDs (corresponding to a total of days of observations) of GRO J1655-40 acquired with the RXTE Proportional Counter Array (PCA; Jahoda96 ). Out of these IDs, are of onset phase (from MJD 53426 to MJD 53441) and are of decline phase (from MJD 53628 to MJD 53648). We extracted the light curves (LC), the PDS and the energy spectra from the good detector unit PCU2 which also happens to be the best-calibrated. We used FTOOLS software package Version 6.1.1 and the XSPEC version 12.3.0. For the timing analysis (LC & PDS), we used the Science Data of the Normal mode () and the Event mode (, ). For the energy spectral analysis, the “Standard2f” Science Data of PCA was used. For all the spectral analysis, we kept the hydrogen column density () fixed at 7.5 1021 atoms cm-2 and the systematics at .
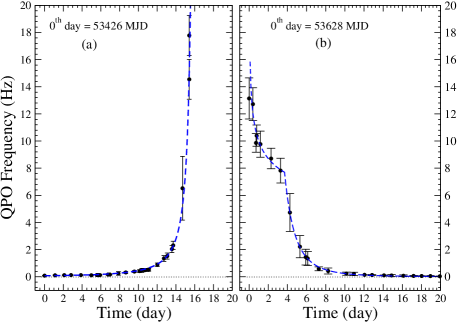
Figures 1(a-b) show the variation of the QPO frequencies in (a) the onset and (b) the decline phases of the outburst. The full widths at half maxima of the fitted QPOs have been used as the error bars. In the onset phase (a), day starts on MJD=53426. The fitted curve represents our solution (Eqns. 1-2) in which the shock is launched at which drifts slowly at cm s-1. On the day after the outburst starts, the noise was high, but we could clearly observe two different QPO frequencies at a very short time interval. At the time of the last QPO detection ( day) at Hz, the shock seems to be at . The strength of the shock , which may have began with is found to be time dependent, slowly getting weakened on its way to the black hole ( as ). For simplicity, we assume , where is a very small number limited by the time in which the shock disappears (here days). Thus, . In our solution, . The fit remains generally very good even with a shock of constant strength (). On the last day of our observation, the shock strength went down to at .
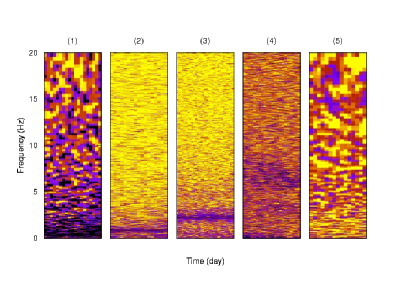
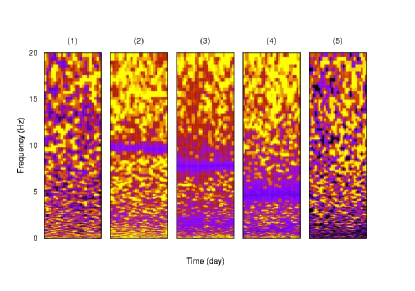
In the declining phase (Fig. 1b), the QPO frequency on the first day () corresponds to launching the shock at about . It evolves as . Since (Eq. 1), the shock was found to drift very slowly with time () till about day where the shock location was . After that it moves out roughly at a constant acceleration () and the QPO frequency decreases as . Finally, when the QPO was last detected, on th day () the shock went as far as and beyond that it was not detected. In Figs. 2(a-b), we present the dynamic PDS where the vertical direction indicates the QPO frequency. The intensity in the gray scale signifies power. Results of five dwells are given in both the onset and decline phases. In Fig. 2a, dwell nos. (1-3), and in Fig. 2b dwell nos. (2-5), the gray scale is normalized to log(Power) = -6 to 0. However, to show more contrast, the gray scale in the remaining dwells are normalized to log(Power) = -6 to -3.
 |
 |
We found significant changes in both the timing and the spectral properties in these two phases. In the rising phase, the spectrum clearly becomes softer as the shock moves in and the QPO frequency goes up. In the declining phase, as the QPO frequency decreases, all three of the black body (BB), the Comptonization (CST) and the power-law (PL) components decrease. Ultimately all that remains is basically a weak power-law component, perhaps due to the faint jet or hot sub-Keplerian flow in the disk which is left over after the outburst is over. We also find that the disk component which was becoming stronger at the onset phase is absent in the late declining phase.
4 Discussions and concluding remarks
In this article, we analyze the rising and the decline phases of the most recent outburst of the black hole candidate GRO J1655-40 and show that during the rising phase, slowly drifting shock oscillation solution explains the rise of QPO frequencies very well. In the decline phase, the shock propagated outwards.
The solutions we present here is unique in the sense that we are able to connect the QPO frequency of one observation with that of the next by a simple analytical means. We have shown how waves of matter are disappearing behind the horizon of the black hole right after the last day of the rising phase.
Acknowledgments
D. Debnath acknowledges the support of a CSIR scholarship and P.S. Pal acknowledges the support of an ISRO RESPOND project.
References
- (1) Orosz, J.A., & Bailyn, C.D., ApJ, 477, 876, 1997
- (2) van der Hooft, F., Heemskerk, M.H.M., Alberts, F., & van Paradijs, J., A&A, 329,538, 1998
- (3) Bailyn, C.D., Orosz, J.A., McClintock, J.E., & Remillard, R.A., Nature,378, 157, 1995
- (4) Hjellming, R. M., & Rupen, M.P., Nature, 375, 464, 1995
- (5) Zhang, S. N., et al., IAU Circ. 6046, 1994
- (6) Strohmayer, T. E., ApJ, 552, L49, 2001
- (7) Chakrabarti, S.K., Nandi, A., Debnath, D. Sarkar, R. & Datta, B.G., Ind. J. Phys., 78B, 1, 2005
- (8) Chakrabarti, S.K., Debnath, D., Nandi, A., & Pal, P.S., Accepted for publication in A&A letters, 2008
- (9) Debnath, D., Chakrabarti, S.K., Nandi, A., Sarkar, R. & Mandal, S., Submitted to BASI, 2008
- (10) Chakrabarti, S.K. & Manickam, S.G., ApJ, 531, L41, 2000
- (11) Rodriguez, R. et al., ApJ, 615, 416, 2004
- (12) Kato, S. & Manmoto, T., ApJ, 541, 889, 2000
- (13) Rodriguez, J., Varnière, P., Tagger, M. & Durouchoux, Ph., A & A, 387, 487, 2002
- (14) Shirakawa, A. & Lai, D., ApJ, 564, 361, 2002
- (15) Varniere, P., Muno, M., & Tagger, M., BAAS, 35, 628, 2003
- (16) Titarchuk, L. & Osherovich, V., ApJ, 542, 111, 2000
- (17) Molteni, D., Sponholz, H. & Chakrabarti, S.K., ApJ, 457, 805, 1996
- (18) Chakrabarti, S.K., Acharyya, K. & Molteni, D., A & A, 421, 1, 2004
- (19) Ryu, D., Chakrabarti, S. K. & Molteni, D., ApJ, 474, 378, 1997
- (20) Chakrabarti, S.K. & Molteni, D., MNRAS, 272, 80, 1995
- (21) Trudolyubov, Churazov & Gilfanov, Astronomy Letters, 25, 718-738, 1999
- (22) Shaposhnikov, N. & Titarchuk, L. G., ApJ, 643, 1098, 2006
- (23) Rao, A.R., Naik, S., Vadawale, S.V. & Chakrabarti, S.K., ApJ, 360, 25, 2000
- (24) Chakrabarti, S.K., & Titarchuk, L.G., ApJ, 455, 623, 1995
- (25) Jahoda, K. et al., SPIE, 2808, 59, 1996