Universality of Bias- and Temperature-induced Dephasing in Ballistic Electronic Interferometers
Abstract
We performed a transport measurement in a ballistic Aharonov-Bohm ring and a Fabry-Pérot-type interferometer. In both cases we found that the interference signal is reversed at a certain bias voltage and that the visibility decays exponentially as a function of temperature, being in a strong analogy with recent reports on the electronic Mach-Zehnder interferometers. By analyzing the data including those in the previous works, the energy scales that characterize the dephasing are found to be dominantly dependent on the interferometer size, implying the presence of a universal behavior in ballistic interferometers in both linear and non-linear transport regimes.
pacs:
73.23.Ad, 71.10.Pm, 85.35.Ds, 03.65.YzElectron interference has been the central issue in mesoscopic physics since 1980’s, which has been promoting our understanding on the phase and coherence of electrons in solids Imry1997 . Recently, an electronic Mach-Zehnder interferometer (MZI) JiNature2003 is invoking considerable interest for its possibility to create electron entanglement by two-particle interference SamuelssonPRL2004 ; NederNature2007 . This MZI relies on the edge channel transport as it requires chirality of the electron beam, which is also an advantage as the coherence length of the edge electrons is expected to be long. Several experimental works on MZI JiNature2003 ; LitvinPRB2007 ; RoulleauPRL2008 ; LitvinPRB2008 , however, reported that the interference visibility, a measure of coherence, decreases exponentially as the temperature increases. Furthermore, the experimentalists found NederPRL2006 ; RoulleauPRB2007 ; RoulleauPRL2008 ; LitvinPRB2008 the so-called “lobe structure”, an unexpected phase reversal in the visibility at a certain bias voltage.
Several theoretical attempts ChalkerPRB2007 ; LevkivskyiPRB2008 ; YounPRL2008 ; NederPRL2008 have tried to explain the observed small energy scales that characterize the lobe structure as well as its drastic temperature dependence. The Coulomb interaction was proposed to be responsible for the observed energy scale proportional to the inverse of the size of MZI LevkivskyiPRB2008 ; YounPRL2008 ; NederPRL2008 . It is, however, still unclear whether or not the above observations are specific to MZI. Indeed, some theories YounPRL2008 ; NederPRL2008 suggest that similar effects may occur in other ballistic interferometers. To investigate this possibility constitutes the central motivation of the present experimental work.
Here we report the conductance measurements for an Aharonov-Bohm ring (ABR) around zero magnetic fields and for a Fabry-Pérot-type interferometer (FPI) in the integer quantum Hall (IQH) regime. In both cases, we observed the lobe-like structure and the exponential decay of the visibility with temperature, akin to those in MZI. By analyzing the present data as well as those obtained in previous works, the characteristic energy scales of the two effects are found to dominantly depend on the interferometer size.
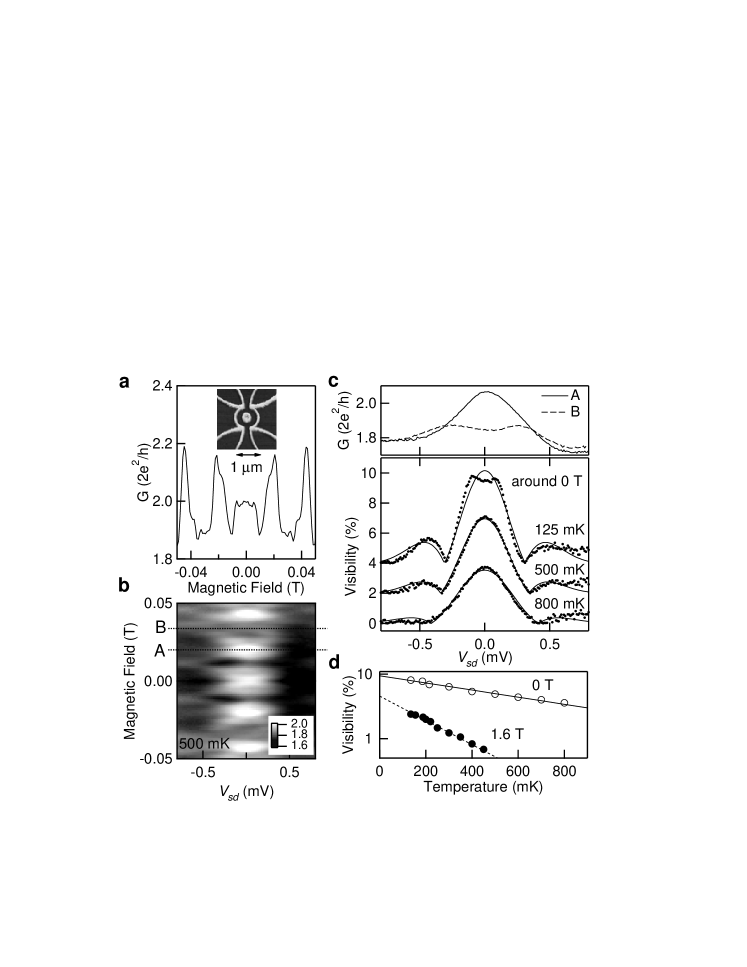
Figure 1a shows the atomic force microscope (AFM) image of the ABR fabricated by local oxidation using an AFM HeldAPL1998 on a GaAs/AlGaAs heterostructure two-dimensional electron gas (2DEG) (the electron density cm-2 and the mobility cm2/Vs) LeturcqPhysicaE2006 . Measurements were performed around zero magnetic field and in the IQH regime. The FPI vanWeesPRL1989 ; BirdPRB1994 was patterned by using electron beam lithography technique on an GaAs/AlGaAs heterostructure 2DEG (the electron density of cm-2 and the mobility cm2/Vs). The scanning electron micrograph (SEM) image of the sample is shown in the inset of Fig. 2a. We tuned the magnetic field () and the gate voltages so as to make a small interferometer in the IQH regime vanWeesPRL1989 ; BirdPRB1994 . For both samples, the two-terminal conductance as well as the differential conductance at finite dc source drain voltages () were measured by using lock-in techniques at 37 Hz with 5 V ac bias voltage. The samples were placed in a dilution refrigerator and the electron temperature is deduced from thermal noise measurement HashisakaPRB2008 with the lowest electron temperature () of 125 mK.
First we show the result of the ABR below 50 mT. At zero bias voltage, a clear AB oscillation with a visibility (the ratio of the oscillatory to the non-oscillatory conductance components) larger than 8 % at 125 mK is observed (Fig. 1a). The period of the AB oscillation is 25 mT, being consistent with the lithographic ring geometry with a radius of 230 nm LeturcqPhysicaE2006 . Figure 1b presents the image plot of the conductance as a function of and . Importantly, a phase reversal of the oscillation is found to occur around mV. In the upper panel of Fig. 1c the cross sections of Fig. 1b are shown at the lines denoted by “A” and “B”, which correspond to the peak and dip of the AB oscillation at = 0 V, respectively. Because of the phase reversal of the oscillation, the resultant visibility () presents a structure akin to the “lobe structure” known in MZI (see the bottom panel of Fig. 1c) NederPRL2006 ; RoulleauPRB2007 ; RoulleauPRL2008 ; LitvinPRB2008 . A similar phase reversal of the oscillation in the ABR was reported before YacobyPRB1996 , while no clear explanation has been given so far.
Figure 1c shows the visibility obtained at , 500, and 800 mK. The characteristic energy scale of the structure is estimated by using the following empirical equation as a function of LitvinPRB2008 :
| (1) |
This is the product of the absolute value of a cosine curve, with period , which characterizes the energy scale of the bias-induced phase reversal, and a Gaussian envelope with characteristic width , which corresponds to the bias dephasing factor. is the zero-bias visibility. From the numerical fitting, and at 125 mK are meV and meV, respectively CommentDip . While the visibility rapidly decreases when the temperature changes from 125 to 800 mK, and are almost independent of temperature (Fig. 1c).
Although the characteristic energy scales are more than 10 times larger, these results look similar to those obtained for MZI NederPRL2006 ; RoulleauPRB2007 ; RoulleauPRL2008 ; LitvinPRB2008 . It is, however, important to examine here whether or not the phase reversal is explained by the magneto-electric AB effect vanderWielPRB2003 in the single particle picture. If the electrostatic potential difference between the two interfering paths in the ABR were responsible for the present observation, the bias dependence of the visibility would be determined by the term vanderWielPRB2003 ; NederPRL2006 . Here is the time for the electrons staying in the paths with different electrostatic potentials. In the present case, the condition to obtain meV yields ps and therefore the electron traveling length, which would correspond to a path difference, is m as the Fermi velocity of the present 2DEG is m/s. However, such a path difference is unfeasible in the present symmetric geometry. Thus, the present lobe-like structure cannot simply be explained by the magneto-electric AB effect, which is also the case in MZI NederPRL2006 .
The analogy between the present result and those in MZI also lies in the fact that the zero-bias visibility has a clear exponential dependence on the electron temperature as shown in Fig. 1d. By fitting the temperature dependence to the function we obtain mK. The exponential decrease of the visibility with is consistent with previous reports for the ABR around T HansenPRB2001 ; KobayashiJPSJ2002 . As the thermal broadening effect whose characteristic time scale is given by predicts K for the size and the Fermi velocity of the ABR KobayashiJPSJ2002 , the present dephasing is not explained by the thermal effect alone.
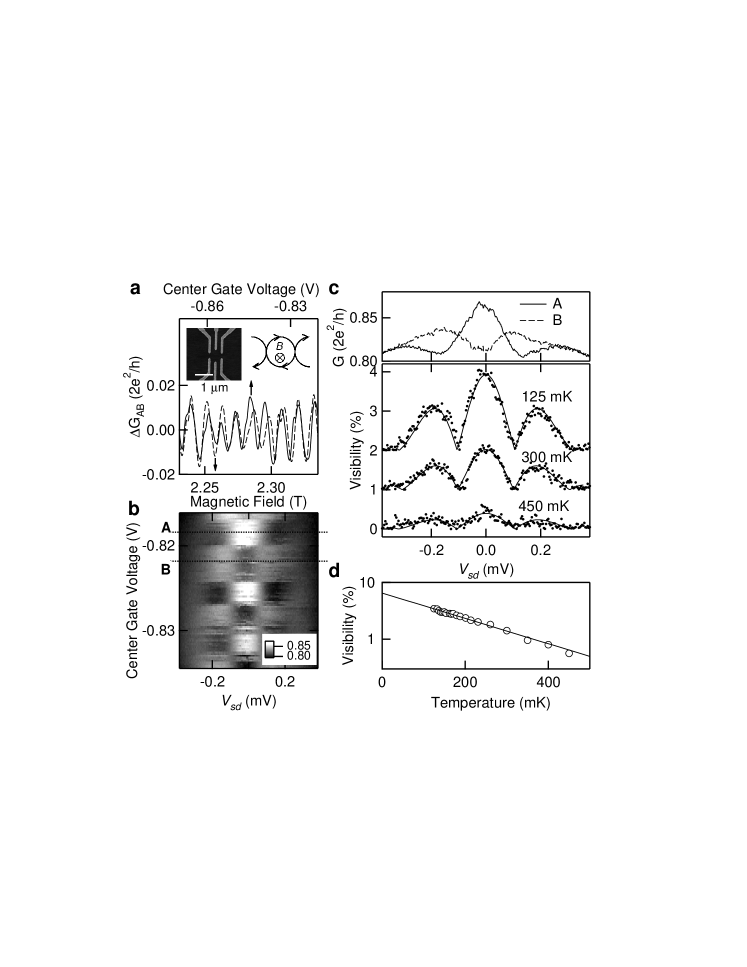
Next we discuss that a perfectly similar phenomenon occurs in the FPI. The conductance measurements for the FPI were performed in the IQH regime with a filling factor of 4 at T. The gate voltages of the left and right pairs of the metallic gates in the SEM picture in Fig. 2a were fixed to -1.1 V and -1.0 V, respectively, so as to tune the conductance of each point contact around . The pair of the center gates were chosen to be around -0.8 V to deplete the 2DEG underneath. By doing this, the one-dimensional state consisting of edge channels is formed along the area defined by the six gates, which is a small interferometer (see the upper right inset of Fig. 2a) vanWeesPRL1989 ; BirdPRB1994 . Figure 2a represents the oscillating component in the conductance through the FPI () as a function of or the center gate voltage. The AB period is 11.8 mT, indicating that the radius of the interferometer is around 350 nm vanWeesPRL1989 being consistent with the lithographic size of the device.
Figure 2b shows the image plot of the conductance as a function of the gate voltage and . As in Fig. 1a, the present result shows the phase reversal of the oscillation at a finite bias voltage. From the cross section at the lines denoted “A” and “B” (Fig. 2b), the visibility is obtained as presented in Fig. 2c, which again looks similar to the lobe structure. Such a lobe-like structure is also obtained from the differential conductance data as a function of and instead of the gate voltage. The result of the temperature dependence of the lobe structure and the visibility at zero bias voltage between 125 mK and 450 mK are shown in Figs. 2c and 2d, respectively. Just as we did above, and are obtained to be 0.18 meV and 0.21 meV, respectively. 200 mK, which again cannot be explained by the thermal broadening effect.
Importantly, a completely similar phenomenon was observed in the ABR at 1.6 T (filling factor 10). In this case, we obtain meV and meV with an AB period of 17 mT. The visibility also decreases exponentially with temperature with mK as shown in Fig. 1d. The different values of and compared to those at T are due to a different interfering path geometry as indicated by the different AB period. However, it is noteworthy that is much reduced from the zero-field value, as will be discussed below.
Recently it was theoretically YounPRL2008 ; NederPRL2008 proposed that the lobe structure in MZI occurs through the Coulomb interaction; When the number of excess electrons present in MZI becomes two in the non-linear regime, the phases of the electrons are mixed due to the Coulomb interaction, resulting in the rapidly decreasing visibility with the phase reversal. Following their idea, a simple estimation of the energy scale for the present lobe-like structures can be performed for the ABR and the FPI as follows; The above effect occurs at when the electron traveling time in one arm is almost twice the injection period for the system with the conductance . Here, is the arm length calculated by the oscillation period and is the Fermi velocity ( m/s for the ABR at T) and the edge velocity for the FPI (typically m/s), respectively. The value to characterize this effect is obtained to be 0.74 meV for the ABR at T (m and ) and to be 0.15 meV for the FPI (m and ). As these values are comparable to the observed or in each case, given the simplicity of the discussion, the dephasing due to the correlation between the excess electrons satisfactorily explains what happens in the non-linear electronic interferometer.
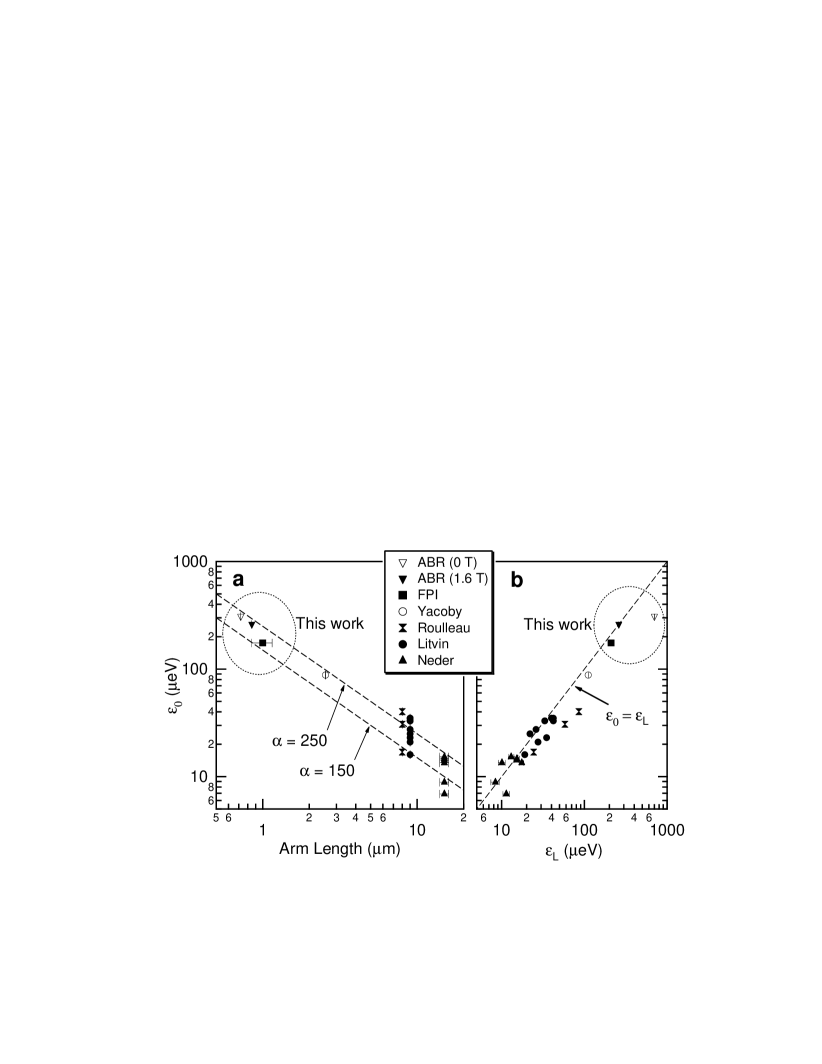
Having proven that the above discussion essentially captures the dephasing in the ABR and FPI in the non-linear regime, it is instructive to compare the present results with previous reports on ballistic interferometers to check the universality. The dependence of on the length of the arm of the interferometer () (the averaged length between the two arms) is compiled in Fig. 3a. We plotted the data obtained for the present ABR at 0 T and 1.6 T, the present FPI, the ABR at 0 T YacobyPRB1996 , and MZI RoulleauPRB2007 ; RoulleauPRL2008 ; LitvinPRB2008 ; NederPRL2006 . Interestingly, this graph shows that scales inversely proportional to the arm length, , where falls between 150 and 250 eVm as shown in Fig. 3a. Fig. 3b shows the relation between and , showing that holds for a wide range of the interferometer sizes. is determined in principle in the same way as above by taking into account the Fermi (or group) velocity and the linear conductance. As theory suggests YounPRL2008 ; NederPRL2008 , the variation of in Fig. 3a and the slight deviation between and may be explained by including the effective Coulomb interaction in the interferometers with the realistic geometry. Also it is experimentally shown that and can be controlled by the opening of the beam splitter RoulleauPRB2007 or the magnetic field LitvinPRB2008 ; NederPRL2006 , suggesting that the arm length is not the only parameter to affect the lobe structure. However, Fig. 3a clearly demonstrates that the relevant energy scale to describe the lobe structure in several kinds of interferometers is primarily determined by the size, which is the central result of the present experimental work.
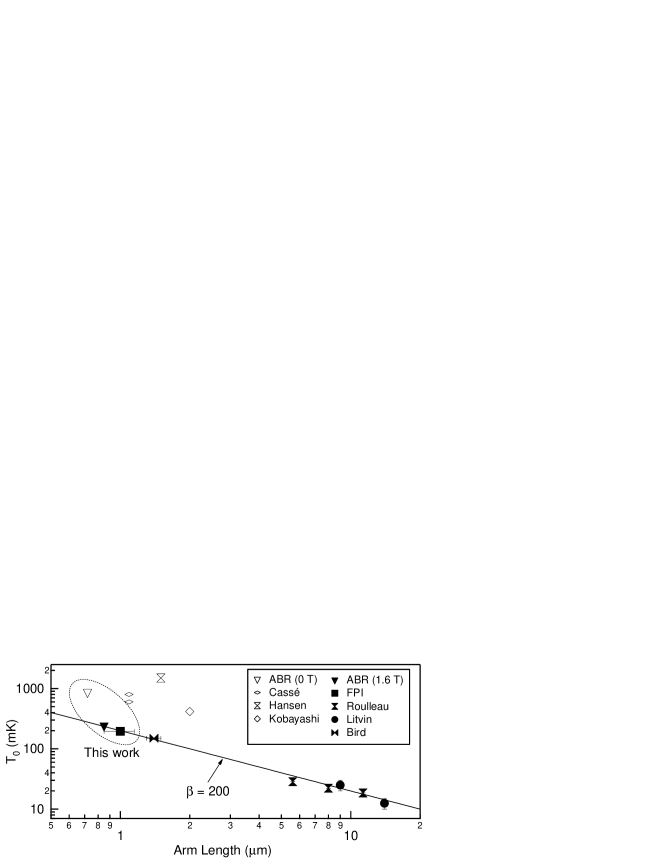
We also found that , which characterizes the dephasing in the linear regime, strongly depends on as shown in Fig. 4, where we compile the values obtained for the present ABR at 0 T and 1.6 T, the present FPI, the FPI BirdPRB1994 , the ABR HansenPRB2001 ; KobayashiJPSJ2002 ; CassePRB2000 and MZI RoulleauPRB2007 ; RoulleauPRL2008 ; LitvinPRB2008 . The plots indicate another universal behavior with mKm for the edge transport regime RatioAlphaBeta . However, the data for the ABR at zero magnetic field strongly deviate from this line. This suggests that the difference of the group velocity between both is important and the coherence time but not the coherence length matters. The present notable difference between the zero-field state and the edge state may suggest that the environmental property in the vicinity of the interferometer is responsible for the temperature-induced dephasing KobayashiJPSJ2002 ; SeeligPRB2003 ; RoulleauPRL2008_2 .
To conclude, we found the “lobe structure” in the ballistic ABR and FPI, being analogous to those observed in MZI’s. The characteristic energy scales are semi-quantitatively explained as due to the Coulomb interaction between the excess electrons in the interferometer. By compiling the energy scales for the lobe structure and the temperature dependence of the visibility, they are found to be proportional to the inverse of the interferometer size. The presence of such universality in dephasing, which is unveiled through the measurement on the present small electron interferometers, will shed new light on the coherence in ballistic systems.
We appreciate fruitful comments from H. W. Lee and A. Helzel. This work is supported by KAKENHI, Yamada Science Foundation, and Matsuo Science Foundation.
References
- (1) Y. Imry, Introduction to Mesoscopic Physics(Oxford University Press, Oxford, 1997).
- (2) Y. Ji et al., Nature (London) 422, 415 (2003).
- (3) P. Samuelsson, E. V. Sukhorukov, and M. Büttiker, Phys. Rev. Lett. 92, 026805 (2004).
- (4) I. Neder et al., Nature (London) 448, 333 (2007).
- (5) P. Roulleau et al., Phys. Rev. Lett. 100, 126802 (2008).
- (6) L. V. Litvin, H.-P. Tranitz, W. Wegscheider, and C. Strunk, Phys. Rev. B 75, 033315 (2007).
- (7) L. V. Litvin et al., Phys. Rev. B 78, 075303 (2008).
- (8) I. Neder et al., Phys. Rev. Lett. 96, 016804 (2006).
- (9) P. Roulleau et al., Phys. Rev. B 76, 161309 (2007).
- (10) J. T. Chalker, Y. Gefen, and M. Y. Veillette, Phys. Rev. B 76, 085320 (2007) and references therein.
- (11) I. P. Levkivskyi and E. V. Sukhorukov, Phys. Rev. B 78, 045322 (2008).
- (12) S. -C. Youn, H.-W. Lee, and H. -S. Sim Phys. Rev. Lett. 100, 196807 (2008).
- (13) I. Neder and E. Ginossar Phys. Rev. Lett. 100, 196806 (2008).
- (14) R. Held et al., Appl. Phys. Lett. 73, 262 (1998).
- (15) R. Leturcq et al., Physica E 35, 327 (2006).
- (16) B. J. van Wees, et al., Phys. Rev. Lett 62, 2523 (1989).
- (17) J. P. Bird et al.,Phys. Rev. B 50, 14983 (1994).
- (18) M. Hashisaka et al., Phys. Rev. B 78, 241303(R)(2008).
- (19) A. Yacoby, R. Schuster, and M. Heiblum, Phys. Rev. B 53, 9583 (1996).
- (20) The small dip around V in the 125 mK data is due the mesoscopic fluctuation inside the ABR, which does not affect the present discussion on the characteristic energy scales. The dip disappears above 400 mK.
- (21) W. G. van der Wiel et al., Phys. Rev. B 67, 033307 (2003).
- (22) A. E. Hansen et al., Phys. Rev. B 64, 045327 (2001).
- (23) K. Kobayashi, H. Aikawa, S. Katsumoto, and Y. Iye, J. Phys. Soc. Jpn 71, L2094 (2002).
- (24) M.Cassé et al., Phys. Rev. B 62, 2624 (2000).
- (25) G. Seelig, S. Pilgram, A. N. Jordan, and M. Büttiker, Phys. Rev. B 68, 161310R (2003).
- (26) P. Roulleau et al., Phys. Rev. Lett. 101, 186803 (2008).
- (27) Recently it was theoretically discussed that there is a universal relation between and LevkivskyiPRB2008 .