Integral field spectroscopy with SINFONI of VVDS galaxies††thanks: Based on observations collected at the European Southern Observatory (ESO) Very Large Telescope, Paranal, Chile, as part of the Programs 75.A-0318, 78.A-0177, and 070.A-9007
Abstract
Aims. This work aims to provide a first insight into the mass-metallicity () relation of star-forming galaxies at redshift . To reach this goal, we present a first set of nine VVDS (VIMOS VLT Deep Survey) galaxies observed with the NIR integral-field spectrograph SINFONI on the VLT.
Methods. Oxygen abundances are derived from empirical indicators based on the ratio between strong nebular emission-lines (H, [N ii]6584Å and [S ii]6717,6731ÅÅ). Stellar masses are deduced from SED fitting with Charlot & Bruzual (2003) population synthesis models, and star formation rates are derived from [O ii]3727Å and H emission-line luminosities.
Results. We find a typical shift of dex towards lower metallicities for the galaxies, compared to the -relation in the local universe as derived from SDSS data. However, this small sample does not show any clear correlation between stellar mass and metallicity, unlike other larger samples at different redshift (, , and ). Indeed, our galaxies lie just under the relation at , and show a small trend for more massive galaxies to be more metallic ( logarithmic slope). There are two possible explanations to account for these observations. First, our galaxies present higher specific star formation rates when compared to the global VVDS sample which could explain the particularly low metallicity of these galaxies as already shown in the SDSS sample. Second, inflow of metal-poor gas due to tidal interactions could also explain the low metallicity of these galaxies as three of these nine galaxies show clear signatures of merging in their velocity fields. Finally, we find that the metallicity of four galaxies is lower by to dex if we take into account the N/O abundance ratio in their metallicity estimate.
Key Words.:
galaxies: abundances – galaxies: evolution – galaxies: high-redshift1 Introduction
The abundance of heavy elements in galaxies reflects the past history of star formation and the effects of gas exchanges (inflows and/or outflows) with the intergalactic medium. A characterization of the evolution of chemical abundances for galaxies of different masses is therefore essential to a complete model of galaxy formation that includes the physics of baryons (see eg. De Lucia et al. 2004; de Rossi et al. 2007; Finlator & Davé 2008).
First discovered for irregular galaxies (Lequeux et al. 1979), the mass-metallicity (hereafter ) relation has been investigated intensively (Brodie & Huchra 1981; Skillman et al. 1989; Zaritsky et al. 1994; Garnett et al. 1997, among others) and is now well established in the local universe () thanks to the analysis of data from large spectroscopic surveys such as the Sloan Digital Sky Survey (SDSS; Tremonti et al. 2004; Gallazzi et al. 2005; Panter et al. 2008) and the 2 degree Field Galaxy Redshift Survey (2dFGRS; Lamareille et al. 2004). The relation for local galaxies is steep for masses M⊙ and flattens at higher masses suggesting that the relation is mainly driven by the decrease of metal loss when stellar mass increases. These trends observed by Tremonti et al. (2004) and Lamareille et al. (2004) have been shown to extend to much lower galaxy masses ( M⊙; eg. Lee et al. 2006; Saviane et al. 2008). Recent studies focused on the dependence of the relation of SDSS galaxies with environment on small scales (Michel-Dansac et al. 2008; Ellison et al. 2008b) and on larger scales (Mouhcine et al. 2007; Cooper et al. 2008) and their star formation rate and galaxy sizes (Ellison et al. 2008a).
The evolution of the relation on cosmological timescales is now predicted by semi-analytical models of galaxy formation. Reliable observational estimates of the relation of galaxies at different epochs (and hence different redshifts) may thus provide important constraints on galaxy evolution scenarios. At increasing redshifts, as the strong rest-frame optical emission lines shift into the near-infrared (NIR) window, metallicities are typically based on smaller subsets of strong emission lines, through the use of empirically calibrated abundance indicators. Much progress has been made recently in assembling large samples of star-forming galaxies with abundance measurements at both intermediate redshifts (; Savaglio et al. 2005; Maier et al. 2005; Liang et al. 2006; Lamareille et al. 2006, 2009; Pérez-Montero et al. 2009; Cowie & Barger 2008) and at (Erb et al. 2006; Maiolino et al. 2008; Hayashi et al. 2009; Mannucci et al. 2009). However, chemical abundance measurements are only available for a limited number of galaxies at (Shapley et al. 2005; Maier et al. 2006; Liu et al. 2008). The rather unexplored redshift regime is one of particular importance in the history of the universe corresponding to i) the peak of star formation rate, and hence metal production, for the universe as a whole (see eg. Lilly et al. 1996; Madau et al. 1996; Pérez-González et al. 2005; Tresse et al. 2007), ii) the buildup of a significant fraction of the stellar mass in the universe (eg. Drory et al. 2005; Arnouts et al. 2007; Pozzetti et al. 2007), and iii) the emergence of the Hubble sequence of disks and spheroids.
We have undertaken an large observing program at ESO-VLT aimed at probing the mass assembly and metallicity evolution of a representative sample of galaxies at . The final goal of the MASSIV111www.ast.obs-mip.fr/massiv/ (Mass Assembly Survey with SINFONI in VVDS) project is to obtain a detailed description of the mix of dynamical types (rotating disks, spheroids, and mergers) at this epoch and to follow the evolution of fundamental scaling relations, such as the Tully-Fisher and ones, and therefore constrain galaxy evolution scenarios. In this paper we present the first results obtained by such a program focusing on the relation at . A companion paper (Epinat et al. 2009) is devoted to the kinematical analysis of galaxies at these redshifts using the same data. This work is based on a sample of nine galaxies selected in the VIMOS VLT Deep Survey (VVDS; Le Fèvre et al. 2005) and observed in the NIR with the 3D-spectrograph SINFONI on the ESO/VLT (Eisenhauer et al. 2003) during pilot observing runs. Throughout this paper we assume a standard -CDM cosmology with , , and .
2 Data description
2.1 Observations
The selection of the sample and the SINFONI observations are fully described in Epinat et al. (2009). For the convenience of the reader, we summarize here the main steps.
We have used the VIMOS VLT Deep Survey to select galaxies with know spectroscopic redshifts in the range . The VVDS is a complete magnitude selected sample avoiding the biases linked to more crude a priori color selection techniques. It offers the advantage to combine a large sample with a robust selection function and secure spectroscopic redshifts necessary to engage into long single objects integrations with SINFONI being sure to observe the H line outside of the OH sky emission lines.
The nine galaxies studied in this paper have been selected among those showing the strongest [O ii]3727Å emission line (EW Å and flux ergs-1cm-2, as measured on VIMOS spectra) for H to be easily detected in the near-IR. These criteria for selecting late-type star-forming galaxies have been shown to be very efficient. From the first observing runs, our success rate of selection has been around 85%: 9 galaxies over 12 observed show strong rest-frame optical emission lines in SINFONI datacubes. The other three galaxies have not been detected with SINFONI for the following reasons. The redshift of one galaxy is such that H is falling just in the gap between the and bands. For another galaxy, the strength of [O ii]3727Å was overestimated. New measurements of this emission line show that this galaxy is now outside of the selection box. The third non-detected galaxy had a wrong redshift.
Among the nine VVDS star-forming galaxies studied in this paper, five have been selected in the VVDS-22h wide field () and four in the VVDS-02h deep field (). Their basic properties (RA, DEC, redshift, -band magnitude, etc) are listed in Table 1. These targets span a redshift range between . The NIR spectroscopic observations were acquired with the 3D-spectrograph SINFONI at ESO-VLT during two 4-nights run on September 5-8, 2005 (ESO run 75.A-0318) and November 12-15, 2006 (ESO run 78.A-0177). SINFONI was used in its seeing-limited mode, with the pixel scales leading to a field-of-view of 8″ 8″, and the H-band grism providing a spectral resolution . Note also that two galaxies (VVDS220544103 and VVDS220584167) have also been observed with the J-band grism. Conditions were not photometric and the mean seeing was around 0.65″. The total on-source integration times, as well as general information are listed in Table 1. For each Observation Block a hot telluric standard star has been observed. With this star we were able to flux-calibrate our observations with an accuracy of about 20%. Details for data reduction are available in Epinat et al. (2009).
| Galaxy | RA(2000) | DEC(2000) | (band)1 | 2 | 3 | |
|---|---|---|---|---|---|---|
| [hours] | ||||||
| VVDS020116027 | 02:25:51.2 | 04:45:07.5 | 1.7(H) | 1.5259 | 1.5302 | |
| VVDS020182331 | 02:26:44.3 | 04:35:51.9 | 3(H) | 1.2286 | 1.2283 | |
| VVDS020147106 | 02:26:45.5 | 04:40:46.9 | 2(H) | 1.5174 | 1.5195 | |
| VVDS020261328 | 02:27:11.1 | 04:25:30.7 | 1(H) | 1.5291 | 1.5289 | |
| VVDS220596913 | 22:14:29.2 | 00:22:15.7 | 1.75(H) | 1.2667 | 1.2662 | |
| VVDS220584167 | 22:15:22.8 | 00:18:47.5 | 1.75(H),1(J) | 1.4637 | 1.4659 | |
| VVDS220544103 | 22:15:25.5 | 00:06:40.0 | 1(H),1(J) | 1.3970 | 1.3966 | |
| VVDS220015726 | 22:15:42.5 | 00:29:04.9 | 2(H) | 1.3091 | 1.2930 | |
| VVDS220014252 | 22:17:45.5 | 00:28:40.3 | 2(H) | 1.3097 | 1.3101 |
-
1
Exposure time corresponding to the effective time spent on the source in each band ( or ).
-
2
Redshift based on the VIMOS spectrum.
-
3
Redshift estimate from the position of H in SINFONI spectra.
2.2 Measurement of emission lines
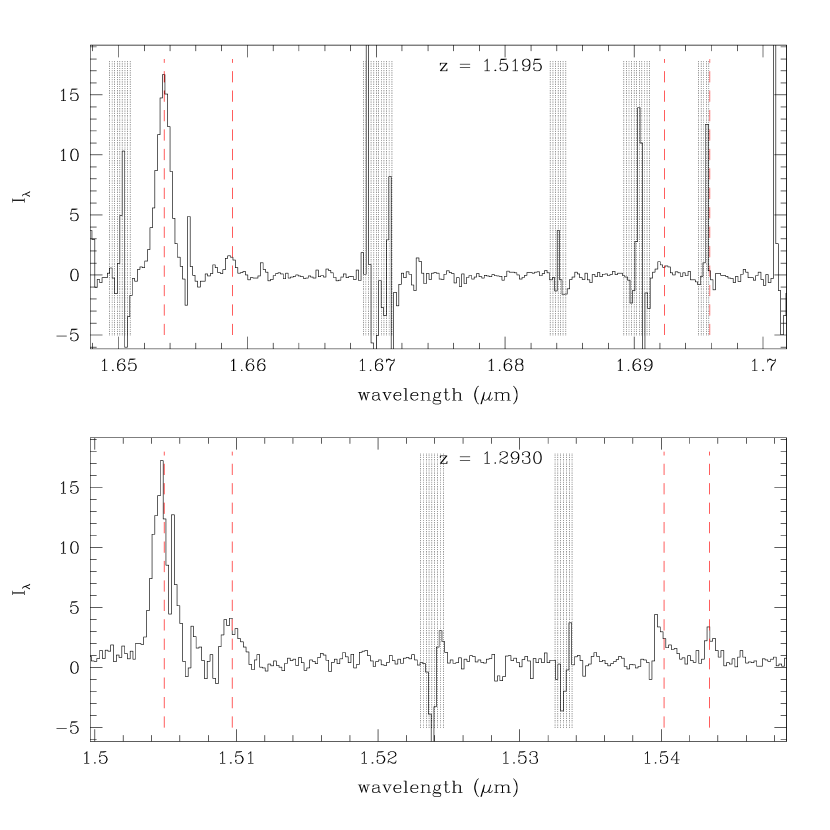
To perform the spectrophotometric analysis of the reduced datacubes and measure the detected emission lines, we first produced 1D spectra from the 3D data. It has been performed in two steps: first, we produced a 2D pseudo-slit spectrum from the datacube (as if we placed a long-slit over the spatial extent of the object), and then we reduced the 2D-spectrum in a 1D-one, taking care of the spatial extent of the galaxy and of the evolution of its position through the dispersion axis. The first step has been done with the QFitsView software222http://www.mpe.mpg.de/ott/QFitsView/ which is a tool to visualize and analyse datacubes. The second step was performed using the IRAF software, specifically applying the apall task of the noao>twodspec>apextract package. Figure 1 shows examples of 1D spectra for the galaxies VVDS020147106 and VVDS220015726.
At the distance of the sample galaxies, the H, [N ii]6584Å and [S ii]6717,6731Å lines are redshifted into the SINFONI band. We were thus able to measure these lines in quasi-all our sample galaxies. For two galaxies we had observations in the band, which enables to detect and measure [O iii]4959,5007Å and H lines for VVDS220544103. Unfortunately, the redshift of the second galaxy VVDS220584167 makes the reliable measurement of these lines impossible as they fall at the location of the bright OH-lines. We measured the flux in the different lines fitting a gaussian to the 1D spectrum of each galaxies (within the splot task in IRAF). Fluxes and errors are obtained with the deblending mode using 100 simulations for the poissonian noise model (see the splot task help for more information). Results are shown in Table 2. Two reasons can account for the impossibility to measure a line: either an OH sky line falls right upon the line of interest, or the intensity of the line is too low to be detected. Over the nine galaxies, [N ii]6584Å is not detected for two (VVDS020261328 and VVDS020182331).
| Galaxy | [O ii]37271 | H | [O iii]4959 | [O iii]5007 | H | [N ii]6584 | [S ii]6717 | [S ii]6731 |
|---|---|---|---|---|---|---|---|---|
| VVDS020116027 | – | – | – | – | ||||
| VVDS020182331 | – | – | – | – | – | – | ||
| VVDS020147106 | – | – | – | – | ||||
| VVDS020261328 | – | – | – | – | – | – | ||
| VVDS220596913 | – | – | – | – | – | |||
| VVDS220584167 | – | – | – | |||||
| VVDS220544103 | – | – | – | |||||
| VVDS220015726 | – | – | – | – | – | |||
| VVDS220014252 | – | – | – | – |
-
1
as measured in the optical VIMOS spectra
The measured values of range from to , which indicates that the sources are star-forming galaxies with at most a low AGN contamination.We also checked for possible X-ray identification of AGN in our sample using the extensive HESEARC archive. Neither XMM nor Chandra source has been identified in the vincinity of our targets further excluding any AGN contamination in our sample. This issue is further discussed in Epinat et al. (2009).
3 Stellar mass and metallicity estimates
3.1 Stellar mass
The procedure to derive stellar mass of our galaxies is based on the comparison between observations, basically the photometric SED of galaxies, and population synthesis models. More precisely, estimates were obtained with the GOSSIP spectral energy distribution (SED) modeling software (Franzetti et al. 2008). For the SED fitting the multi-band photometric observations available in the VVDS fields were used, including data from the CFHT, data from the CFHT Legacy Survey, - and -bands data from SOFI at the NTT and from the UKIDSS survey, and the VVDS-Deep spectra. The stellar population models used for the fit were generated with the BC03 population synthesis code (Bruzual & Charlot 2003), assuming a set of “delayed” star formation histories (see Gavazzi et al. 2002, for details), and a Salpeter IMF. The values and erros bars of the stellar masses in Table 3 are the median of the Probability Distribution Function and its confidence regions. More details can be found in Epinat et al. (2009).
3.2 Metallicity
To determine the gas-phase oxygen abundance of the nine VVDS galaxies, we made use of well-known empirical abundance indicators. Indeed, at these redshifts, we only have access to the brightest recombination and forbidden emission lines of the ionized interstellar gas, preventing any accurate metallicity estimate based on faint [O iii] auroral lines. Different calibrations or empirical indicators have been proposed over the past 20 years, each of them taking into account different set of emission lines. The most commonly used, but which has the drawback of being degenerated, is certainly , first introduced by Pagel et al. (1979), and re-calibrated later in many articles (Kewley & Dopita 2002; Nagao et al. 2006; Yin et al. 2006).
Considering that the nine galaxies have been observed with SINFONI in the band, we had access to H and [N ii]6584Å emission-line fluxes for six galaxies (we did not detect [N ii]6584 for three galaxies). This led us to use the N2 indicator, defined as follows:
| (1) |
which is subject to many calibrations for metallicity estimates (Kewley & Dopita 2002; Denicoló et al. 2002; Nagao et al. 2006; Yin et al. 2006; Perez-Montero & Contini 2009). In our cases, the N2 parameter offered two main advantages to derive metallicity. Due to the proximity of the H and [N ii]6584Å lines, the N2 ratio is independant of reddening correction and uncertainty in relative flux calibration. Recently, Perez-Montero & Contini (2009) (hereafter PMC08) provided a new calibration of this parameter based on a sample of objects with a direct determination of the corresponding ionic abundances:
| (2) |
Nevertheless, this parameter presents a large scatter, which can be due to many processes, as explained in Pérez-Montero & Díaz (2005). One possible explanation is the dependence of the calibration on the nitrogen-to-oxygen abundance ratio . PMC08 investigated how the N2 abundance indicator can be altered by the value of the ratio. They found the following deviation:
| (3) |
Following their method, we had to determine the nitrogen-to-oxygen abundance ratio. Perez-Montero & Contini (2009) propose an empirical calibration for it, derived from the same sample of H ii regions they used to derive equations (2) and (3). For our purpose, considering the emission lines we have in our spectra, we have used use the ratio leading to the following calibration:
| (4) |
In this work, we first calculated the metallicities using equation (2): the results are listed in Table 3. Unfortunately, the measurement of the sulfur lines ([S ii]6717,6731Å) is very difficult, and we sometimes only had a measurement for one of the two lines, so we derived the other using the relation (5) which is valid if we assume a typical density of 100 cm-2 (Ramsbottom et al. 1993):
| (5) |
In Osterbrock (1974), Fig 5.3 p.134, we can see that at these typical densities, the value of the ratio changes by 0.1 at most. We were thus able to “correct” the metallicities of 4 galaxies, the ones for which we had a measurement of [S ii]6717,6731Å. The derived metallicities, corrected for the ratio, are also listed in Table 3.
For three galaxies (VVDS220544103, VVDS020261328 and VVDS020182331) we did not measure the [N ii]6584Å line. However, observations in the band were available for the first galaxy (VVDS220544103) enabling to measure [O iii]4959,5009Å and H emission lines (see Table 2). With H, measured in the band, and [O ii]3727Å (from the VIMOS spectrum) we had thus in hand five emission lines for this galaxy to derive metallicity using the indicator. The ratio of the Balmer lines gives an estimate of the attenuation by the dust. Assuming a classical value for the intrinsic ratio of 2.85, our measurements of the H and H lines gave an extinction coefficient of . We were then able to correct the emission-line fluxes for reddening using the Calzetti extinction law (Calzetti 2001) and use these values to derive metallicity. We obtained which led to an estimate of the metallicity of , using the calibration of Zaritsky et al. (1994). Kewley & Ellison (2008) provide a way to translate this value to T04 (the calibration used in Tremonti et al. (2004)). We finally obtained for VVDS220544103.
| Galaxy | 1 | 2 | 3 | 3 | 4 | 5 | 6 |
|---|---|---|---|---|---|---|---|
| VVDS020116027 | |||||||
| VVDS020147106 | |||||||
| VVDS220596913 | – | – | – | ||||
| VVDS220584167 | |||||||
| VVDS220544103 | – | – | – | – | – | ||
| VVDS220015726 | – | – | – | ||||
| VVDS220014252 |
-
1
metallicity estimate using PMC08 indicator.
-
2
metallicity estimate using PMC08 indicator and correction with the sulfur lines.
-
3
corresponding metallicities converted into T04 metallicity estimator.
-
4
stellar mass in solar units (see § 3.1).
-
5
estimated with the N2S2 ratio.
-
6
specific SFR in yr-1, derived with .
4 The Mass-Metallicity relation
4.1 The relation
Figure 2 shows the position of the seven galaxies at in the -plane (blue circles) using the metallicities and the stellar masses listed in Table 3. In order to compare with the relations previously derived at different redshifts, we also draw in this figure the relations obtained in the local Universe (Tremonti et al. 2004) as derived from the the SDSS, at (Lamareille et al. 2009) and (Pérez-Montero et al. 2009) from the VVDS sample, at from zCOSMOS (Contini et al., in prep), and at (Erb et al. 2006). However, such a comparison requires great precautions, as pointed out in Kewley & Ellison (2008). In their study, Kewley & Ellison (2008) investigate the influence of different metallicity calibrations on the relation and showed that the absolute value of the metallicity can vary up to 0.8 dex depending on the calibration used. Taking this remark into consideration, our purpose being to compare the relation at to the ones at others epochs, we had to be consistent with the calibrations used in other studies.
Firstly, at Tremonti et al. (2004) used an indicator based on the Bayesian calibration CL01 (for Charlot & Longhetti 2001) – we will refer as T04 – which make use of a large set of emission lines to derive metallicity. In order to translate our metallicities into the T04 calibrator, we first converted to Denicoló et al. (2002) N2 calibration and then applied the transformation given in Kewley & Ellison (2008) to get T04 metallicities. If stands for the metallicity estimate of Perez-Montero & Contini (2009) and for that of T04, we then have:
| (6) |
The resulting points in Fig. 2 are plotted as blue circles.
Secondly, at Erb et al. (2006) used another calibration of the N2 indicator: PP04 (Pettini & Pagel 2004). To be consistent we chose to convert their relation into T04. In Kewley & Ellison (2008) we found the way to convert from PP04 to T04, as follows (if stands for the estimate of metallicity with PP04 and with T04):
| (7) |
The resulting curve is shown in Fig. 2 in red. The three other relations (Lamareille et al. 2009; Pérez-Montero et al. 2009, Contini et al. in prep.) are already calibrated with T04 estimator.
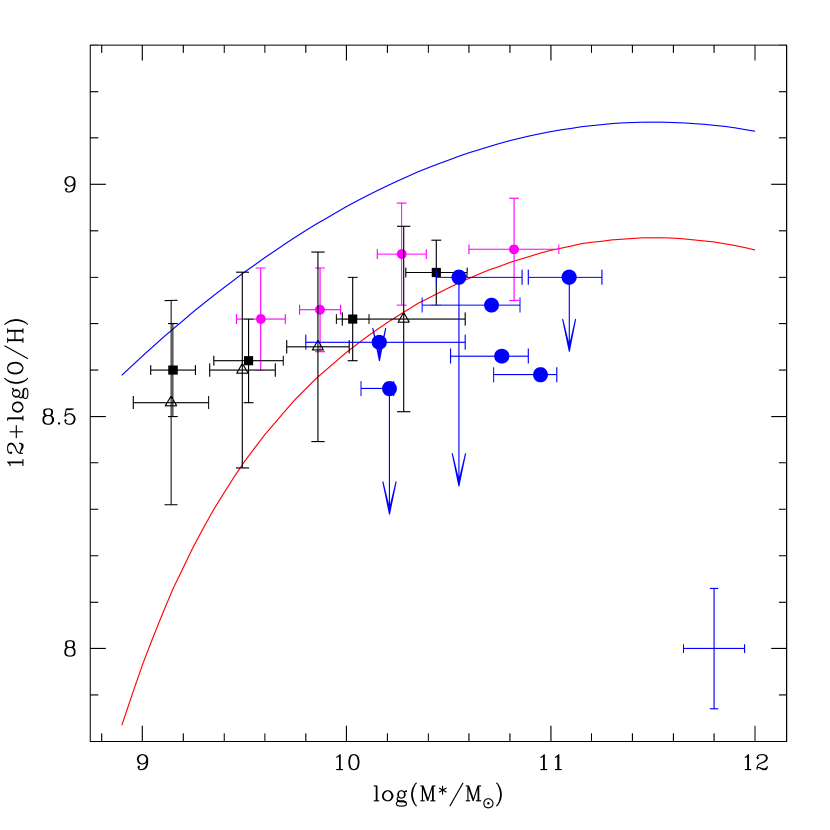
While Tremonti et al. (2004), Erb et al. (2006), Lamareille et al. (2009) and Pérez-Montero et al. (2009) found a monotonic relation between the metallicity and stellar mass – more massive galaxies have a higher nebular metallicity than less massive ones – our small sample of galaxies at does not show any obvious correlation between metallicity and stellar mass, even though one could imagine to increase with stellar mass. Actually, if we fit a line through our 7 points, we obtain a positive slope (). The mean metallicity for this sample of seven galaxies is with a scatter of dex. Note however that the galaxies are lying below the relation derived in the local universe from SDSS data (blue line in Fig. 2). The shift in metallicity is roughly dex, which clearly confirms the evolutionary trend of the galaxies metallicity with cosmic time for a given stellar mass. Six out of seven galaxies have metallicities lower than the median relation of Erb et al. (2006) which seems to draw an upper limit in metallicity for our sample. We can wonder why our galaxies seem poorly metallic, and in particular less metallic than Erb et al. (2006) relation.
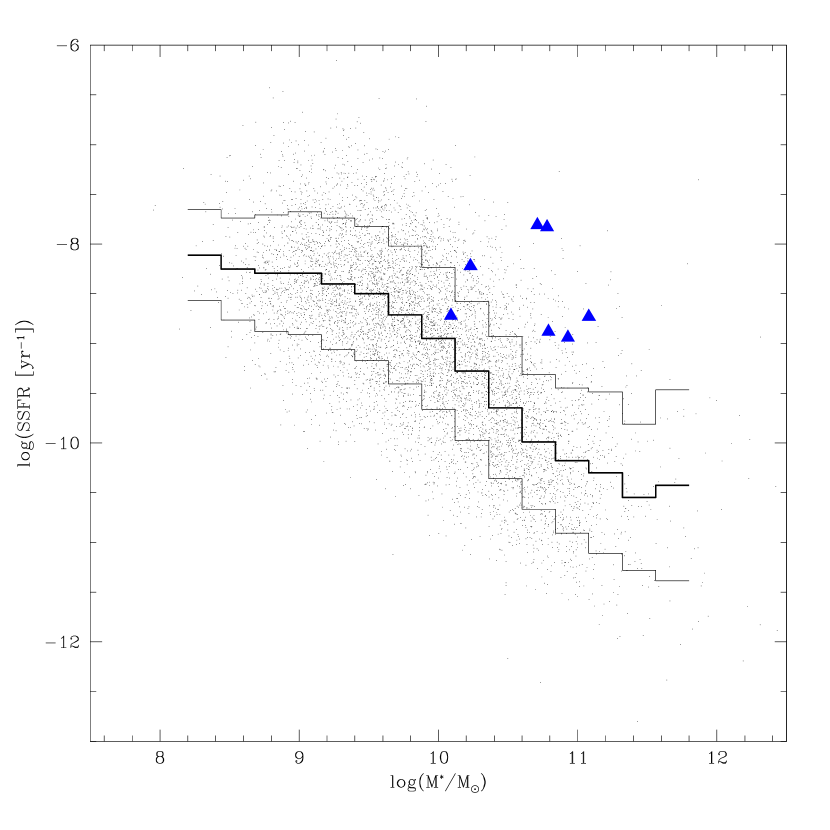
Recently Ellison et al. (2008a) investigated the systematic effects of specific star formation rate (SSFR) on the relation. At a given mass, SDSS galaxies with high SSFR have in average lower metallicities than galaxies with low SSFR. We thus derived SSFR for the 7 galaxies in our sample, using the H luminosity, the SFR calibration by Argence & Lamareille (2009) [eq. 17] and the stellar mass given by the SED fitting. To be able to compare with the entire VVDS sample, we also derived specific SFR for galaxies in the 22h 02h “wide” fields, for which we had a measure of and an estimate of the stellar mass. Argence & Lamareille (2009) provide a calibration of the SFR based on the [O ii]3727Å line [eq. 18] which is consistent with the H calibration. In Fig. 3 we show the SSFR as a function of stellar mass for the full VVDS 22h 02h “wide” sample, together with our VVDS galaxies. As one can see our galaxies lie on top of the mean distribution in SSFR, even out of the 1 limits (except for one), which could explain why their metallicity is so low. As a matter of fact our sample is clearly biased toward high specific star formation rates. Several explanations are proposed for this trend (see Ellison et al. 2008a, for more details): galactic winds could be more efficient in extracting metals at higher SSFRs, inflows of metal-poor gas could increase the SFR, etc… The fact that these seven galaxies show on average higher SSFRs than the global VVDS sample is not surprising as they were selected on the basis of the intensity of the [O ii]3727Å line (see Sect. 2.1). This bias could explain why the relation we find at seems shifted toward low metallicities. Another explanation, which could be linked to the SSFR one, has been recently proposed by Peeples et al. (2009). These authors claim that the presence of tidal interactions in majors mergers could possibly account for a fading in oxygen abundance as metal-poor gas may inflow from large radii. In our sample, VVDS220596913, VVDS220544103 and VDS020116027 seem indeed to undergo tidal interactions as revealed by their peculiar velocity fields (see Epinat et al. 2009).
4.2 Influence of the ratio
Figure 4 shows the relation between the stellar mass and the nitrogen-to-oxygen abundance ratio for the SDSS star-forming galaxies in the local universe (Perez-Montero & Contini 2009, their Fig. 13). The four VVDS galaxies at for which we were able to derive are also shown in this figure as filled squares. Even if the dispersion around the relation defined by the SDSS sample is high, it is clear that the four VVDS galaxies are consistent with this relation. The influence of the nitrogen-to-oxygen abundance ratio on the metallicity is shown on Fig. 2 with the downwarding arrows. As noticed by Perez-Montero & Contini (2009) the metallicities are significantly shifted to lower values for high abundances ratios. This is especially the case for VVDS020147106 and VVDS220014252 which exhibit the highest values. Looking at Fig. 2 we must keep in mind the important error bars going up to nearly dex for the ratio (see Table 3). Nevertheless, even if we take into account these errors, the downwarding shifts in metallicity – for VVDS020147106 and VVDS220014252 – are too important to deny any effective decline in oxygen abundance: indeed the drops in oxygen abundance are larger than the error bars themselves, which guarantee an effective decline.

5 Conclusion and prospects
We have determined the stellar mass and metallicity of seven VVDS star-forming galaxies at observed in the NIR with the integral-field spectrograph SINFONI. Keeping in mind the uncertainties inherent to the metallicity and mass estimates, and considering also that our small sample does not allow to draw any firm conclusion, we can however draw the following points. Our sample of seven galaxies shows if any, a mild correlation between metallicity and stellar mass ( logarithmic slope). The mean metallicity is with a scatter of dex. All the galaxies in our sample are just under the relation of Erb et al. (2006) at , except for one galaxy that lies just above. The low metallicity measured in these galaxies at could be due to their high specific star formation rate and/or to the tidal interactions allowing for inflow of metal-poor gas in the cases of VVDS220596913, VVDS220544103 and VDS020116027. Accounting for the dependence of oxygen abundance estimate on the abundance ratio, as suggested by Perez-Montero & Contini (2009), would lower significantly the metallicity for two galaxies showing the largest abundance ratios. When completed, the MASSIV survey will gather a representative sample of roughly 80 galaxies observed with SINFONI within . It will allow to shed new light on these issues enabling to probe the dynamical and physical properties of these galaxies. Concerning the relation, a statistical study will be undertaken over a large range of stellar masses, computing median metallicities in bins of mass and deriving the median relation between and and its intrinsic scatter. Comparing these observations to the predictions of galaxy evolution models (e.g. de Rossi et al. 2007) will also be an major issue to investigate within MASSIV.
Acknowledgements.
We wish to thank the ESO staff at Paranal Observatory and especially the SINFONI team at VLT for their support during observations. We also thank the referee for the constructive comments which help to improve the quality of this paper. This work has been partially supported by the CNRS-INSU Programme National de Galaxies and by the french ANR grant ANR-07-JCJC-0009.References
- Argence & Lamareille (2009) Argence, B. & Lamareille, F. 2009, A&A, 495, 759
- Arnouts et al. (2007) Arnouts, S., Walcher, C. J., Le Fèvre, O., et al. 2007, A&A, 476, 137
- Calzetti (2001) Calzetti, D. 2001, PASP, 113, 1449
- Charlot & Longhetti (2001) Charlot, S. & Longhetti, M. 2001, MNRAS, 323, 887
- Cooper et al. (2008) Cooper, M. C., Tremonti, C. A., Newman, J. A., & Zabludoff, A. I. 2008, MNRAS, 390, 245
- Cowie & Barger (2008) Cowie, L. L. & Barger, A. J. 2008, ApJ, 686, 72
- De Lucia et al. (2004) De Lucia, G., Kauffmann, G., & White, S. D. M. 2004, MNRAS, 349, 1101
- de Rossi et al. (2007) de Rossi, M. E., Tissera, P. B., & Scannapieco, C. 2007, MNRAS, 374, 323
- Denicoló et al. (2002) Denicoló, G., Terlevich, R., & Terlevich, E. 2002, MNRAS, 330, 69
- Drory et al. (2005) Drory, N., Salvato, M., Gabasch, A., et al. 2005, ApJ, 619, L131
- Eisenhauer et al. (2003) Eisenhauer, F., Abuter, R., Bickert, K., et al. 2003, in Presented at the Society of Photo-Optical Instrumentation Engineers (SPIE) Conference, Vol. 4841, Society of Photo-Optical Instrumentation Engineers (SPIE) Conference Series, ed. M. Iye & A. F. M. Moorwood, 1548–1561
- Ellison et al. (2008a) Ellison, S. L., Patton, D. R., Simard, L., & McConnachie, A. W. 2008a, ApJ, 672, L107
- Ellison et al. (2008b) Ellison, S. L., Patton, D. R., Simard, L., & McConnachie, A. W. 2008b, AJ, 135, 1877
- Epinat et al. (2009) Epinat, B., Contini, T., Le Fevre, O., et al. 2009, ArXiv e-prints 0903.1216, submitted to A&A
- Erb et al. (2006) Erb, D. K., Shapley, A. E., Pettini, M., et al. 2006, ApJ, 644, 813
- Finlator & Davé (2008) Finlator, K. & Davé, R. 2008, MNRAS, 385, 2181
- Franzetti et al. (2008) Franzetti, P., Scodeggio, M., Garilli, B., Fumana, M., & Paioro, L. 2008, in Astronomical Society of the Pacific Conference Series, Vol. 394, Astronomical Data Analysis Software and Systems XVII, ed. R. W. Argyle, P. S. Bunclark, & J. R. Lewis, 642
- Gallazzi et al. (2005) Gallazzi, A., Charlot, S., Brinchmann, J., White, S. D. M., & Tremonti, C. A. 2005, MNRAS, 362, 41
- Garnett et al. (1997) Garnett, D. R., Shields, G. A., Skillman, E. D., Sagan, S. P., & Dufour, R. J. 1997, ApJ, 489, 63
- Gavazzi et al. (2002) Gavazzi, G., Bonfanti, C., Sanvito, G., Boselli, A., & Scodeggio, M. 2002, ApJ, 576, 135
- Hayashi et al. (2009) Hayashi, M., Motohara, K., Shimasaku, K., et al. 2009, ApJ, 691, 140
- Kewley & Dopita (2002) Kewley, L. J. & Dopita, M. A. 2002, ApJ, 142, 35
- Kewley & Ellison (2008) Kewley, L. J. & Ellison, S. L. 2008, ApJ, 681, 1183
- Lamareille et al. (2009) Lamareille, F., Brinchmann, J., Contini, T., et al. 2009, A&A, 495, 53
- Lamareille et al. (2006) Lamareille, F., Contini, T., Brinchmann, J., et al. 2006, A&A, 448, 907
- Lamareille et al. (2004) Lamareille, F., Mouhcine, M., Contini, T., Lewis, I., & Maddox, S. 2004, MNRAS, 350, 396
- Le Fèvre et al. (2005) Le Fèvre, O., Vettolani, G., Garilli, B., et al. 2005, A&A, 439, 845
- Lequeux et al. (1979) Lequeux, J., Peimbert, M., Rayo, J. F., Serrano, A., & Torres-Peimbert, S. 1979, A&A, 80, 155
- Liang et al. (2006) Liang, Y. C., Hammer, F., & Flores, H. 2006, A&A, 447, 113
- Lilly et al. (1996) Lilly, S. J., Le Fevre, O., Hammer, F., & Crampton, D. 1996, ApJ, 460, L1+
- Liu et al. (2008) Liu, X., Shapley, A. E., Coil, A. L., Brinchmann, J., & Ma, C.-P. 2008, ApJ, 678, 758
- Madau et al. (1996) Madau, P., Ferguson, H. C., Dickinson, M. E., et al. 1996, MNRAS, 283, 1388
- Maier et al. (2006) Maier, C., Lilly, S. J., Carollo, C. M., et al. 2006, ApJ, 639, 858
- Maier et al. (2005) Maier, C., Lilly, S. J., Carollo, C. M., Stockton, A., & Brodwin, M. 2005, ApJ, 634, 849
- Maiolino et al. (2008) Maiolino, R., Nagao, T., Grazian, A., et al. 2008, A&A, 488, 463
- Mannucci et al. (2009) Mannucci, F., Cresci, G., Maiolino, R., et al. 2009, ArXiv e-prints 0902.2398
- Michel-Dansac et al. (2008) Michel-Dansac, L., Lambas, D. G., Alonso, M. S., & Tissera, P. 2008, MNRAS, 386, L82
- Mouhcine et al. (2007) Mouhcine, M., Baldry, I. K., & Bamford, S. P. 2007, MNRAS, 382, 801
- Nagao et al. (2006) Nagao, T., Maiolino, R., & Marconi, A. 2006, A&A, 459, 85
- Osterbrock (1974) Osterbrock, D. E. 1974, Astrophysics of Gaseous Nebulae (W. H. Freeman and Company)
- Panter et al. (2008) Panter, B., Jimenez, R., Heavens, A. F., & Charlot, S. 2008, MNRAS, 391, 1117
- Peeples et al. (2009) Peeples, M. S., Pogge, R. W., & Stanek, K. Z. 2009, ApJ, 695, 259
- Pérez-González et al. (2005) Pérez-González, P. G., Rieke, G. H., Egami, E., et al. 2005, ApJ, 630, 82
- Perez-Montero & Contini (2009) Perez-Montero, E. & Contini, T. 2009, ArXiv e-prints 0905.4621, accepted in MNRAS
- Pérez-Montero et al. (2009) Pérez-Montero, E., Contini, T., Lamareille, F., et al. 2009, A&A, 495, 73
- Pérez-Montero & Díaz (2005) Pérez-Montero, E. & Díaz, A. I. 2005, MNRAS, 361, 1063
- Pettini & Pagel (2004) Pettini, M. & Pagel, B. E. J. 2004, MNRAS, 348, L59
- Pozzetti et al. (2007) Pozzetti, L., Bolzonella, M., Lamareille, F., et al. 2007, A&A, 474, 443
- Ramsbottom et al. (1993) Ramsbottom, C. A., Bell, K. L., & Berrington, K. A. 1993, Journal of Physics B Atomic Molecular Physics, 26, 4399
- Savaglio et al. (2005) Savaglio, S., Glazebrook, K., Le Borgne, D., et al. 2005, ApJ, 635, 260
- Saviane et al. (2008) Saviane, I., Ivanov, V. D., Held, E. V., et al. 2008, A&A, 487, 901
- Shapley et al. (2005) Shapley, A. E., Coil, A. L., Ma, C.-P., & Bundy, K. 2005, ApJ, 635, 1006
- Skillman et al. (1989) Skillman, E. D., Kennicutt, R. C., & Hodge, P. W. 1989, ApJ, 347, 875
- Tremonti et al. (2004) Tremonti, C. A., Heckman, T. M., Kauffmann, G., et al. 2004, ApJ, 613, 898
- Tresse et al. (2007) Tresse, L., Ilbert, O., Zucca, E., et al. 2007, A&A, 472, 403
- Yin et al. (2006) Yin, S. Y. et al. 2006, A&A
- Zaritsky et al. (1994) Zaritsky, D., Kennicutt, Jr., R. C., & Huchra, J. P. 1994, ApJ, 420, 87