Gate-controlled spin-orbit interaction in a parabolic GaAs/AlGaAs quantum well
Abstract
We study the tunability of the spin-orbit interaction in a two-dimensional electron gas with a front and a back gate electrode by monitoring the spin precession frequency of drifting electrons using time-resolved Kerr rotation. The Rashba spin splitting can be tuned by the gate biases, while we find a small Dresselhaus splitting that depends only weakly on the gating. We determine absolute values and signs of the two components and show that for zero Rashba spin splitting the anisotropy of the spin dephasing rate vanishes.
Spin-orbit (SO) interaction is one of the key ingredients for future spintronic devices. In a two-dimensional electron gas (2DEG), SO interaction manifests itself as a spin splitting, and two different asymmetries can be responsible for it: The inversion asymmetry of a zincblende crystal leads to the so-called Dresselhaus spin splitting Dresselhaus1955 , and an electric field, , along the growth direction enables Rashba-type spin splitting Bychkov1984 . is either generated by an asymmetrically grown layer structure (e.g., doping profile), or can be controlled externally by appropriate gating. The latter allows for a very efficient and scalable approach to control spins Datta1990 ; Schliemann2003 .
The possibility of tuning the SO interaction in a 2DEG with a front gate (FG) electrode was first exploited by Nitta et al. Nitta1997 , who studied Shubnikov–de Haas (SdH) oscillations. Similar experiments were done in a 2D hole system with a FG and a back gate (BG) electrode Papadakis1999 . These experiments could not differentiate between the Dresselhaus and Rashba components. By tuning the sheet density of a 2DEG and a careful analysis of weak antilocalization peaks, Rashba and Dresselhaus SO interaction were separated in a transport experiment Miller2003 . It has been proposed that such information could also be obtained from measurements of conductance anisotropy in quantum wires Scheid2008 . Using photocurrents, it is possible to characterize the sources of SO interaction, but not to make a quantitative statement about the SO strength Belkov2008 ; Ganichev2004 . In a 2DEG, the spin lifetime, which can be measured optically, is limited mainly by the Dyakonov–Perel (DP) dephasing mechanism Dyakonov1972 and therefore by the strength of the SO interaction. An optical study of the spin lifetime as a function of gate voltages therefore indirectly provides information on the tunability of the SO interaction Karimov2003 ; Larionov2008 .
A more direct method to obtain quantitative access to both the Rashba and the Dresselhaus SO interaction strength is to measure the drift-induced effective SO magnetic field (in the following referred to as SO field) Meier2007 . Here, we employ this method to study the tunability of the SO interaction by means of an external electric field, , perpendicular to the plane of a 2DEG confined in a parabolic potential. By using FG and BG electrodes, independent control of both and the carrier sheet density Salis1997 is obtained. Although the electrons are confined in a parabolic well that does not change its shape with bias, we find a Rashba SO field that depends linearly on . The Dresselhaus SO field is only weakly affected by the gate bias. Together with a measurement of the mobility of the 2DEG, we obtain quantitative values for the Rashba coupling and its sign. Our optical measurements allow the simultaneous determination of the different contributions to SO interaction and the spin lifetime. In agreement with the DP dephasing mechanism Kainz2004 ; Larionov2008 , the in-plane anisotropy of the spin lifetime disappears when , validating previous experiments that extracted ratios of SO splittings from measurements of spin-dephasing. Larionov2008
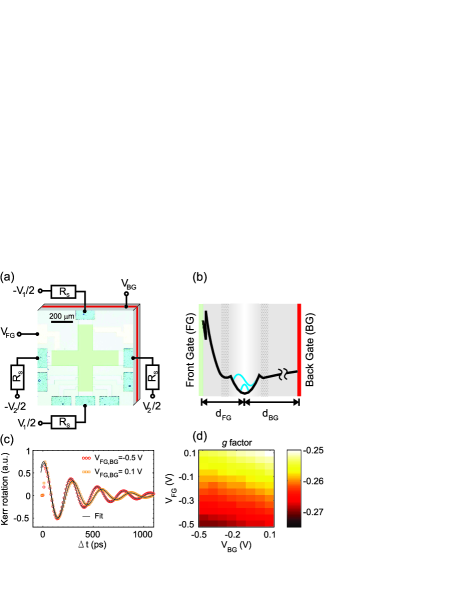
The structure measured is a molecular-beam epitaxy-grown AlxGa1-xAs quantum well (QW) with parabolic confinement Salis1997 ; Salis01 . The QW is 100 nm thick, and the Al concentration varies from in the center of the well (located nm below the surface) to at the edges. The QW is modulation doped with Si on both sides. A 490 nm thick layer of low-temperature-grown GaAs isolates the QW from the BG, which consists of a highly -doped GaAs layer and is located nm below the QW, see Fig. 1(b). Using photolithography and wet etching, a cross-shaped mesa structure [see Fig. 1(a)] with standard AuGe Ohmic contacts to the 2DEG and the BG is defined. A semi-transparent FG consisting of a 2 nm Ti adhesion layer and 6 nm of Au covers the cross. We characterize the electronic properties of the sample at 30 K in a magnetic field perpendicular to the sample plane, using the lower arm of the cross as a Hall bar. From measurements in the dark and under illumination, we find a persistent photoconduction that increases the carrier sheet density in the QW by a factor of about two and lowers the effectiveness of the gates under illuminated conditions. Both effects are attributed mainly to the ionization of DX centers in the doping layers. After illumination, the sheet density is tunable between cm-2 and cm-2 by applying bias voltages between the FG and the 2DEG as well as between the BG and the 2DEG. At 2.4 K, SdH oscillations in exhibit a beating that corresponds to two frequencies, indicating that two subbands are occupied Salis1997 . The sum of its sheet densities, extracted from the SdH oscillations, equals the Hall density. From this, we conclude that a possible parallel conductivity layer has a much lower mobility than the 2DEG. In the experiments presented in the following, the 2DEG is in the illuminated state.
We use time-resolved Kerr rotation (TRKR) to probe the spin dynamics of the carriers confined in the QW Meier2007 . The pump pulses (average power 700 W; repetition rate 80 MHz) are focused on a 30-m-wide spot in the center of the cross. The probe beam (70 W) is focused onto the same spot. The TRKR signal is well described by an exponentially decaying cosine , where is the amplitude of the Kerr signal, the ensemble spin lifetime, the electron-spin factor, the Bohr magneton, and is the total magnetic field that is composed of an external magnetic field, , and a SO field Meier2007 . The measurement of the SO interaction relies on the fact that the SO field and thus depend on the direction and magnitude of the electron drift, induced by applied voltages = and = symmetrically to the four arms of the cross via serial resistors k, see Fig. 1(a). This creates a well-controlled in-plane electric field in the center of the cross Studer2009 . The application of breaks the symmetry in space and shifts the electron population in the -th subband by , where is the mobility of the subband and the electron effective mass. Because of this, the average spin of the electrons in this subband is exposed to an effective magnetic field that can be divided into a Dresselhaus term and a Rashba term :
| (1) |
We use a coordinate system with [10], [110] and [001], and restrict our discussion to two subbands. For two occupied subbands there is an additional contribution to the SO interaction Calsaverini2008 , that, however, depends only weakly on and would appear in our measurements as a constant contribution to the Rashba SO field. Typical inter-subband scattering times are on the order of ps Salis1999 , which is two orders of magnitude faster than the spin precession period in our experiment. This implies that one precessing electron spin is on average equally present in both subbands during its lifetime and that therefore the TRKR signal represents an average of the two occupied subbands. Only one Larmor frequency is observable, even if the factors of the two subbands are different. As pointed out in Ref. Doehrmann2004, , the fast intersubband scattering is also a source of spin decoherence. Assuming that both subbands contribute equally to the TRFR signal, we measure a SO field that is proportional to the average SO field of the two subbands: and . We apply in the plane of the 2DEG at an angle with respect to the axis. If and , can be approximated by Meier2007
| (2) |
Because of the different symmetries, the drift-induced modification of is proportional to for , and to for .
All the experiments are carried out at 30 K and with T. Figure 1(c) shows the TRKR signal as a function of the pump-probe delay for two gate configurations ( and 0.1 V). The signals are well fit by an exponentially decaying cosine, and as is known, the factor can be obtained. Figure 1(d) shows the factor as a function of the gate voltages. We assume that it is negative Salis01 . The factor becomes less negative both for increasing and for increasing , indicating that a larger carrier sheet density and therefore a higher energy of the electrons are the main cause Yang1993 . A lateral displacement of the subband wave function should also change and manifests itself in a dependence where and modify the factor into opposite directions Salis01 . The latter effect plays a minor role in our doped sample, in contrast to the undoped samples studied in Ref. Salis01, .
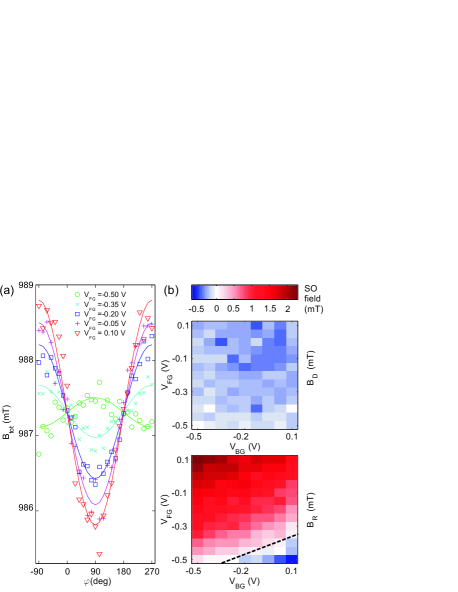
Figure 2(a) displays the measured as a function of the angle of the direction of for V, where 87 V/m in the center of the cross. Gating-induced variations of and the mobility result in a variation in below 5%. The geometry of our sample keeps the density in the center of the cross constant during a rotation, preventing a factor modulation. To test this, we apply in the opposite direction and find the same oscillation in with a sign-reversed amplitude, consistent with Eq. (2) (data not shown). The solid lines are fits using Eq. (2). As , oscillates in with an amplitude given by . As seen in Fig. 2(a), this amplitude strongly depends on the applied, suggesting a large variation in the SO interaction. The SO field does not depend on the magnitude of Bext, and no pump-power dependence of the measured SO fields is observed Studer2009 . The same measurements were done in one cool-down for a matrix of FG and BG voltages for two samples glued onto the same chip carrier but with different orientations of the crystallographic axes such that and , respectively. From these measurements, and can be obtained separately [See Fig. 2(b)]. We observe a large variation in , including a sign change (dashed line). and have the opposite effect on , suggesting that a tuning of the symmetry is responsible for the variation. Compared to , is rather constant. In the following we will first discuss and then come back to .
An electric field applied perpendicularly to the plane of the QW shifts the potential minimum along the direction, but does not change the shape of the parabolic confinement Salis1997 . Nevertheless it is expected that the Rashba SO coefficient changes linearly Winkler2003 , . This can be explained by the notion that the electric field in the valence band determines the Rashba splitting in the conduction band Winkler2003 . Here, is a constant that depends on the material of the QW and can either be generated by an asymmetrically grown potential () or by gating the structure (). is related to and by
| (3) |
where and are screening factors of the BG and the FG, respectively.
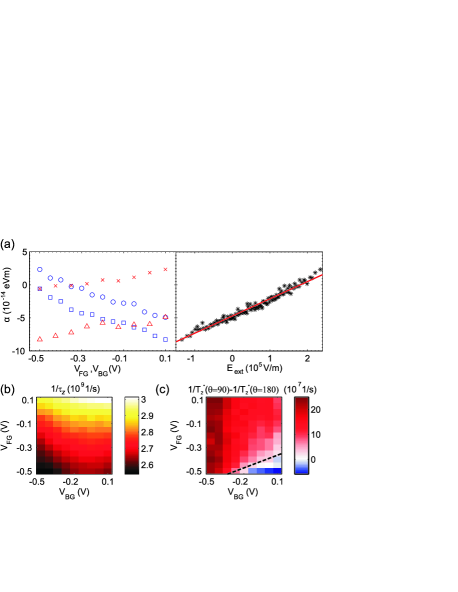
As is given by the measured mobility and , can be obtained from , assuming that the mobility is the same in both subbands. In the left panel of Fig. 3(a), we plot as a function of , while is kept fixed. We find parallel lines for two BG (FG) sweeps, suggesting a linear dependence of on the gate voltages, as predicted by Eq. (3). can be estimated by evaluating the density dependence of the 2DEG on and and comparing it with a plate capacitor model Papadakis1999 . In the dark we find , i.e. no screening is observed. Under illumination, is between 15 and 20 and f. We plot all data points as a function of by fixing and treating as a fitting parameter to fit all points to one line [see right panel of Fig. 3(a)]. This yields , which is similar to the value obtained from the density dependence, indicating that is mainly governed by and much less so by the density. The sign change of is explained by a change of the symmetry of the QW. From the slope in Fig. 3(a), eÅ2 is extracted. This is on the same order of magnitude as 5 eÅ2, the value cited for GaAs in Ref. Winkler2003, . is positive for pointing from the substrate to the surface.
In Fig. 3(b) we plot the average of two spin-dephasing rate measurements with and , which is equivalent to the spin-dephasing rate in the direction, . A higher dephasing rate is observed for higher densities, as expected from the DP mechanism Kainz2004 . In Fig. 3(c), the difference of these two measurements is plotted. The in-plane anisotropy of the spin-dephasing results from the interplay between the two SO contributions Studer2009 ; Larionov2008 . From theory, a vanishing anisotropy is expected for Kainz2004 . The dashed line in Fig. 3(c) indicates bias regions with no Rashba spin splitting, corresponding also to the region where the in-plane anisotropy of the spin decay disappears, confirming the theory and supporting our measurements of .
We now come back to discuss the size of , which can be understood by taking the full Dresselhaus term into consideration. Starting with the cubic Dresselhaus term Kainz2004 , we include the confinement in the - plane by replacing by the expectation value of the -th quantized subband wave function. Integrating the effective magnetic field over the shifted Fermi circle using yields the Dresselhaus SO field including the higher-order terms
| (4) |
where is a material-dependent parameter Kirch2007 and is the Fermi wave vector of the -th subband with the subband density . Interestingly, two terms contribute to the SO field: one proportional to and one proportional to . For sufficient confinement, , Eq. 1 is recovered with .
To estimate with Eq. 4 we use the SdH densities at 2.4 K, and m-2 and extrapolate them to the Hall density m-2 measured at 30 K. A numerical simulation of the wave functions in the QW yields =2.2 m-2 and m-2. With a measured mobility of 8.2 m2/Vs at 30 K, assuming that both subbands have this mobility and eVm3, taken from literature 000For an overview see in the supplementary material of Ref. Kirch2007, , Eq. (4) predicts a value of mT for . This is in good agreement with the measured mT at V. The contributions of the two subbands have opposite sign, leading to this small value. In Fig. 2(b) tends to slightly more negative values with positive gating. This trend is explainable by the higher density and thus higher and the small confinement leading to a lower because of the screening of the parabola by the electrons.
To conclude, we have measured the SO field originating from the Dresselhaus and the Rashba SO interaction in a system where an electric field perpendicular to the QW plane as well as the carrier sheet density can be controlled with a FG and a BG. A small Dresselhaus SO field and a Rashba-induced SO field that linearly depends on are found. Taking into account the two occupied subbands, the small values of the Dresselhaus SO field can be understood qualitatively. We determine the sign of subband-averaged and show full tunability of through zero. This result is confirmed by a vanishing anisotropy of the spin-dephasing at .
We gratefully acknowledge helpful discussions with P. Studerus and A. Fuhrer, and thank R. Leturcq for experimental help. This work was supported by the CTI and the SNF.
References
- (1) G. Dresselhaus, Phys. Rev. 100, 580 (1955).
- (2) Y. A. Bychkov and E. I. Rashba, J. Phys. C 17, 6039 (1984).
- (3) S. Datta and B. Das, Appl. Phys. Lett. 56, 665 (1990).
- (4) J. Schliemann, J. C. Egues, and D. Loss, Phys. Rev. Lett. 90, 146801 (2003).
- (5) J. Nitta et al., Phys. Rev. Lett. 78, 1335 (1997).
- (6) S. J. Papadakis et al., Science 283, 2056 (1999).
- (7) J. B. Miller et al., Phys. Rev. Lett. 90, 076807 (2003).
- (8) M. Scheid et al., Phys. Rev. Lett. 101, 266401 (2008).
- (9) V. V. Bel’kov et al., Phys. Rev. Lett. 100, 176806 (2008).
- (10) S. D. Ganichev et al., Phys. Rev. Lett. 92, 256601 (2004).
- (11) M. I. D’yakonov and V. I. Perel’, Sov. Phys. Solid State 13, 3023 (1971).
- (12) O. Z. Karimov et al., Phys. Rev. Lett. 91, 246601 (2003).
- (13) A. V. Larionov and L. E. Golub, Phys. Rev. B 78, 033302 (2008).
- (14) L. Meier et al., Nat. Phys. 3, 650 (2007).
- (15) G. Salis et al., Phys. Rev. Lett. 79, 5106 (1997).
- (16) J. Kainz, U. Rössler, and R. Winkler, Phys. Rev. B 70, 195322 (2004).
- (17) G. Salis et al., Nature 414, 619 (2001).
- (18) M. Studer et al., Phys. Rev. B 79, 045302 (2009).
- (19) R. S. Calsaverini et al., Phys. Rev. B 78, 155313 (2008).
- (20) G. Salis et al., Phys. Rev. B 59, R5304 (1999).
- (21) S. Döhrmann et al., Phys. Rev. Lett. 93, 147405 (2004).
- (22) M. J. Yang et al., Phys. Rev. B 47, 6807 (1993).
- (23) R. Winkler, Spin-Orbit Coupling Effects in Two-Dimensional Electron and Hole Systems (Springer, Berlin, 2003).
- (24) J. J. Krich and B. I. Halperin, Phys. Rev. Lett. 98, 226802 (2007).