Hierarchical Star Formation: Stars and Stellar Clusters in the Gould Belt
Abstract
We perform a study of the spatial and kinematical distribution of young open clusters in the solar neighborhood, discerning between bound clusters and transient stellar condensations within our sample. Then, we discriminate between Gould Belt (GB) and local Galactic disk (LGD) members, using a previous estimate (Elias et al., 2006a) of the structural parameters of both systems obtained from a sample of O-B6 Hipparcos stars. Single membership probabilities of the clusters are also calculated in the separation process. Using this classified sample we analyze the spatial structure and the kinematic behavior of the cluster system in the GB. The two star formation regions that dominate and give the GB its characteristic inclined shape show a striking difference in their content of star clusters: while Ori OB1 is richly populated by open clusters, not a single one can be found within the boundaries of Sco OB2. This is mirrored in the velocity space, translating again into an abundance of clusters in the region of the kinematic space populated by the members of Ori OB1, and a marginal number of them associated to Sco OB2. We interpret all these differences by characterizing the Orion region as a cluster complex typically surrounded by a stellar halo, and the Sco-Cen region as an OB association in the outskirts of the complex. In the light of these results we study the nature of the GB with respect to the optical segment of the Orion Arm, and we propose that the different content of star clusters, the different heights over the Galactic plane and the different residual velocities of Ori OB1 and Sco OB2 can be explained in terms of their relative position to the density maximum of the Local Arm in the solar neighborhood. Although morphologically intriguing, the Gould Belt appears to be the result of our local and biased view of a larger star cluster complex in the Local Arm, that could be explained by the internal dynamics of the Galactic disk.
keywords:
(Galaxy:) solar neighborhood — open clusters and associations: general — (stars:) early-type — formation.1 Introduction
The Gould Belt (GB) was first discovered by John Herschel (1847) and Benjamin Gould (1879) as a system of bright stars inclined with respect to the plane of the Milky Way. For more than a century, many studies have been devoted to describing its structure and its kinematical behavior, as well as to proposing a reliable global scenario that would account for its origin (for an extensive review on the subject, see Pöppel 1997, 2001 and Grenier 2004). Today it is considered that, in the scope of the most recent theories of hierarchical star formation (Efremov, 1978, 1995; Elmegreen et al., 2000; Elmegreen, 2006), the GB is likely to be our closest giant star forming complex (Comerón, 2001).
The stellar component of this complex takes the shape of a planar distribution of bright and young OB stars inclined with respect to the Galactic plane (Lesh, 1968; Stothers & Frogel, 1974; Westin, 1985). Most of the young OB associations in the solar neighborhood are known to be part of the GB (Blaauw 1965; de Zeeuw et al. 1999; Elias et al. 2006a, hereafter Paper I). Also, a system of young, low-mass stars, detected by cross-matching X-ray and optical Hipparcos (Perryman et al., 1997) based catalogs, appears to be associated with the GB (Guillout et al., 1998).
As we should expect from a giant ongoing star forming complex, the local interstellar medium is prominently associated with the GB. The works by van den Bergh (1966) on reflection nebulae, by Sandqvist (1977) on dark clouds and, more recently, by Gaustad & Van Buren (1993) on maps of infrared emission, have found a spatial distribution of the dark clouds of interstellar dust compatible with the pattern shown by the stellar component of the GB. Tomita (1986, 1987) and the study of the CO molecule by Taylor et al. (1987) seem to confirm this inclination for the local molecular clouds.
Neutral hydrogen in the solar neighborhood has also been related to the GB after the discovery of Lindblad’s “feature A” (Lindblad, 1967; Lindblad et al., 1973), interpreted as a ring of gas with an expansion movement (Olano, 1982; Elmegreen, 1982). After Lindblad’s work, the giant molecular clouds were found to be related to the most prominent OB star associations (Sancisi et al., 1974; Kutner et al., 1977; de Geus, 1992). A full map of the CO molecule over the sky later confirmed that most of these clouds within 1 kpc from the Sun follow the GB pattern (Dame et al., 1993).
Then, if the GB is a star formation complex composed of both young stars and associations and interstellar material, we would expect to find a population of young open clusters following the GB pattern. This is obvious if we consider the concept of young star cluster in its widest sense, i.e., representing the dense inner regions of the hierarchical structure of young star fields (Elmegreen, 2006). Nonetheless, in this study we want to distinguish between a young cluster understood as a mere stellar condensation, and a gravitationally bound system (that is, as a condensation that “has had sufficient time and gravitational self-attraction to get mixed by stellar orbital motions”, as put by Elmegreen 2006). Our work focuses on the analysis of the cluster system, and on how these objects distribute and behave in comparison with the GB defined by the massive stars.
Since the first systematic studies that led to a discrimination between the GB and the LGD (Stothers & Frogel, 1974; Westin, 1985) there has been a great improvement in the number of cataloged open clusters, as well as in the availability of their astrometric and physical data. Surprisingly, it is not possible to find in the scientific literature any work devoted to the study of the open clusters membership to the GB and their distribution within this system before 2006. Thus, for many years, it has been accepted that the GB did not contain a significant population of bound clusters. Only very recently Piskunov et al. (2006), in their analysis of the Galactic open cluster population, discovered an open cluster complex (OCC) that they associate with the GB. Although they find this OCC as a density peak within the spatial distribution of clusters in the solar neighborhood, they estimate OCC membership probabilities by kinematical methods, through the analysis of the tangential velocities.
In two previous papers (Paper I; Elias et al. 2006b, hereafter Paper II) we have studied the spatial distribution and the kinematic properties of the OB stars and associations in the GB. Our line of work thus leads in a logical way to the study of the distribution of young open clusters in the GB and their kinematic properties. Our analysis will be centered in the comparison of the GB morphology as obtained from the distribution of massive stars and clusters. This will represent another step in the understanding of the nature of the GB, and will also contribute to the knowledge of how star formation mechanisms proceed to the formation of stellar clusters.
2 Open cluster system
2.1 Associations, stellar condensations and bound clusters
Prior to describing the selection criteria for our observational sample, we want to punctuate some ideas about the concepts of hierarchical star formation, association, loose groupings and clusters as gravitationally bound physical systems.
Stars are born from molecular gas clouds whose internal structure can be characterized by a fractal dimension value that apparently ranges from 2.5 to 2.7 (e.g. Sánchez et al. 2005, 2007). Simulations of the collapse of gas clouds hint at a hierarchical structure of the stellar formation, with clusters present in several dense cores (Walsh et al., 2006). During the past two decades, a set of observations has been collected which indicates that young stellar groupings show hierarchical patterns that range from the larger scales of flocculent spiral arms and star complexes to the smaller scales of OB associations, OB subgroups, small loose groups, clusters and cluster subclumps (Efremov, 1995). In other words, the newly born stars seem to follow the same fractal pattern as the gas clouds from which they were originated.
The largest scale of stellar grouping, the great star complexes, would be associated with the gas superclouds with masses the order of 107 solar masses. According to some authors (e.g., Comerón 2001, Efremov & Elmegreen 1998), the Gould Belt, with its spatial scale the order of 1 kpc, would be the star complex closest to the Sun, and thus would come from a single gas cloud with a mass of a few million solar masses.
What happens at smaller scales? We already know that most of the OB associations in the solar neighborhood, with typical sizes of about 80 pc, are mainly distributed along the plane of the GB. They represent the observable spatial scale immediately below the star complex. But, does it make any sense to talk about a typical scale within a fractal structure? The answer should be sought in the observational bias that is introduced by the age limit of the sample: OB associations are detected and selected as concentrations of OB stars with a typical age of about 10 Myr. The existence of some general correlation between the duration of the star formation and the size of the region (Larson, 1981; Elmegreen, 2006) implies that, for a typical age of 10 Myr, the typical size of the region is 80 pc (Efremov & Elmegreen, 1998; Elmegreen, 2006).
Star clusters are formed in the cores of giant molecular clouds; they represent the stellar groupings associated to the inner and densest regions of the gas, and can be interpreted as the unavoidable result of star formation in hierarchically structured gas (Elmegreen, 2006). However, only a few of these condensations will still be gravitationally bound after 10 Myr. It has been estimated that 90% of the clusters lose a high fraction of their stars in the first 10 Myr of their lives (Fall et al., 2005). Thus, after 10 Myr of life, it is possible to find star forming regions that maintain a large number of star clusters, while others like NGC 604 in M33 do not contain a single cluster (Maíz-Apellániz, 2001). This seems to depend on variations of the mean density of the clouds; those where the average density is low will form stellar concentrations in the cores of the clouds, but they will not have enough binding energy to keep a bound cluster when the gas leaves. Thus, the clusters observed within a star-forming region at a certain moment could be representatives of two distinct physical systems: either star clusters, gravitationally bound and able to survive galactic tidal forces, or a mere stellar condensation with a mean lifetime the order of 10 million years or less.
Thus the analysis of the distribution of star clusters (both bound systems and transient condensations) could give us information about the history of star formation in the GB, as well as about the physical conditions of the gas from which they were born.
2.2 Cluster sample
We extract our sample from the Catalogue of Open Cluster Data (COCD) and its Extension 1, compiled by Kharchenko et al. (2005a, b). This catalogue has the advantage of homogeneity over other existing compilations, and since we are also interested in working with space velocities, the fact that the COCD had catalogued proper motion values in the Hipparcos system and newly determined radial velocity data was decisive in our choice.
As our aim is to study the cluster distribution in the GB, we establish distance and age limits in our sample. The GB system should be well contained within a heliocentric radius of 1 kpc (Stothers & Frogel 1974; Westin 1985; Paper I); and since its age has been estimated between 20 and 90 Myr (Torra et al., 2000), we only keep clusters younger than 100 Myr.
Thus, our first selection (that will be reduced after outlier elimination, as we explain in the following section) is composed of 93 open clusters, 83 of which have complete kinematical information. We calculate for every cluster its Cartesian Galactic coordinates (, , ), where is positive in the direction of the Galactic center, in the direction of Galactic rotation and perpendicular to the Galactic plane so that they form a right-handed, orthogonal frame. We also calculate their respective space velocities, (, , ), for those clusters with radial velocity data.
2.3 Gould Belt and Local Galactic Disk clusters
In Paper I we developed a three-dimensional classification method that allowed us to separate the GB stars from the local Galactic disk (LGD) stars by purely spatial criteria. This method considered that the LGD and the GB could be described as a distribution along two intersecting planes; working with a sample of Hipparcos O-B6 stars we obtained an estimation of the parameters that defined those planes. In Paper II, we used those parameters to classify strictly by spatial criteria a new sample of OB stars with kinematic data. Similarly, we now use our classification method and the parameters found in Paper I to separate the GB open clusters from those of the LGD field. We want to stress that this separation is done only by means of their spatial position in the three-dimensional space.
As described in Paper I, this classification method leads also to the identification of outliers; i.e., those objects that are too far away from the mean planes and thus lie in regions of low density of probability in the sample space. We have found 9 outliers in our cluster sample; after their elimination the remaining sample consists in 84 clusters, 76 of them with full space velocity data (listed in table 1). Further information on the detection and meaning of outliers may be found in Section 2 of Paper I and references therein.
Finally, the individual GB membership probability () for each cluster is listed in table 1. In total, 40 clusters have a probability , and thus, following the Bayes minimum error rate decision rule, we consider them to be members of the GB.
2.4 Bound and unbound clusters
This sample may contain both bound and unbound clusters, as we have previously seen (Section 2.1). A simple criterion to select those condensations with a high probability of being bound clusters is an age cut-off, if we consider that all the objects older than 10 Myr can be called bound clusters, in the sense that they have survived to the high rate of infant mortality that happens during the first 10 million years in the life of a cluster. Once this critical threshold has been surpassed the mean life of a cluster, although very dependent on the environmental conditions, is usually larger than 1 Gyr.
It is evident, though, that such a selection is just an approximation to the problem, and that to determine if a stellar system represents a bound cluster, we must compare its density with the tidal density at its position in the galaxy. However, we lack the complete information to perform this detailed analysis, and thus we must resort to empirical classification criteria. The COCD catalog provides three variables for each cluster that may give us some additional information about what we understand as young stellar grouping and cluster; these variables are: cluster radius, core radius and age.
In Figure 1, we represent the cluster sample in the cluster radius-age space. It is interesting to note that the clusters older than 10 Myr in our sample seem to group around an elongated strip with a positive slope and that only a few objects present a cluster radius that deviates from this mean distribution. The most notorious case is that of NGC 2264, which has a radius close to 20 pc. This cluster seems to present a high degree of substructure, spatial as well as kinematical (Fũrész et al., 2006), that its central potential has not been able to erase. Thus we eliminate this object from the sample, for its properties appear to differ in some structural aspects from that of “classic” bound clusters.
We have also drawn in Figure 1 an upper envelope of the main cluster distribution with ages older than 10 Myr and younger than 100 Myr. There seems to be a natural separation between the main distribution of clusters older than 10 Myr, and those that show a radius larger than expected for their age. Based on this apparent separation, we have traced this upper envelope of the main cluster distribution. The exact location of the line has been drawn by consensus of the authors. It simply aims to represent a dividing line between the largest concentration of “probable” bound clusters (represented as filled circles in the figure), and those that in spite of their age show a clearly distinct behavior. The objects located under this envelope line can be considered, from a conservative point of view, as highly probable bound clusters.
Using the cluster radius and core radius data, we have estimated a pseudo-concentration parameter in the form log(Rcl/Rco), that we represent in Figure 2 versus the cluster radius. Circled squares indicate those clusters that, according to the previously exposed criteria, can be considered as probable bound clusters. We note that most of these objects are distributed, as in Figure 1, along a straight line. However, two of these objects (Platais 6 and NGS 2546) show a clear separation from the general tendency.
Using the online tools at WEBDA database (Mermilliod, 1995) we have recalculated the parameters of these two clusters from their photometric data. This analysis indicates that the photometric diagrams of Platais 6 show a good fitting for a distance modulus of 7 and log(t) 6.5. Similarly, a visual inspection of the color-magnitude diagram of NGC 2546, as cataloged by WEBDA, seems to indicate that it is a very young cluster (log(t) 7) with a rich population of pre-main sequence stars. This diagram is similar to that shown by NGC 2362 and other young clusters located in the third Galactic quadrant (Delgado et al., 2006, 2007), meaning that we are not facing an object almost 100 Myr old. Thus we consider these two objects as clusters with ages inferior to 10 Myr, and consequently they do not belong –according to our criteria– to the group of clusters with a high probability of being gravitationally bound.
In table 1 we present the classification of the sample that follows from this reasoning. The last column shows an indicator of the probability of being a bound cluster, according to the criteria previously discussed (1 stands for those objects that are “probable” bound clusters, and 2 stands for those we consider as transient stellar condensations).
3 Analysis and discussion
3.1 Spatial distribution
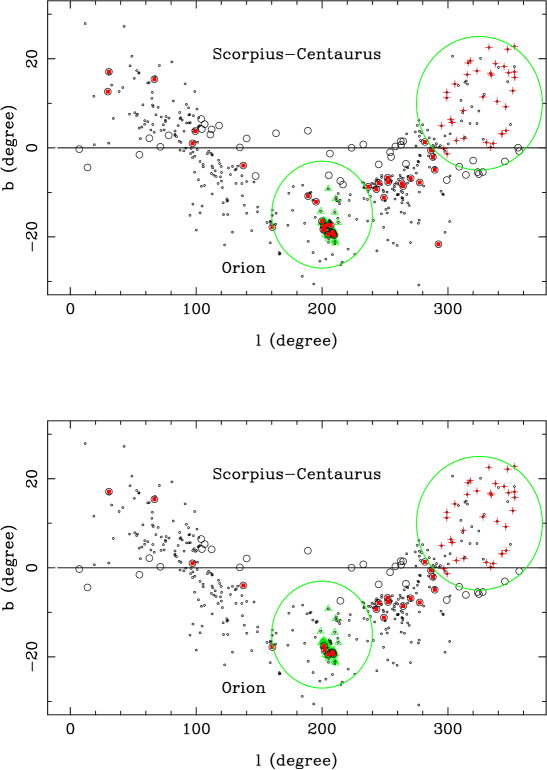
A two-dimensional projection of the spatial distribution of open clusters in the sky is shown in Figure 3 (top panel). There we see, as we commented in Section 1, that GB clusters (filled circles) are mostly concentrated towards southern Galactic latitudes, and that only three of them (395 = IC 4665, 423 = Collinder 359, and 456 = Stephenson 1) clearly rise above the Galactic plane ( degrees). According to our criteria, 395 and 456 are probable bound clusters, while 423 could rather be a transitory stellar condensation. We must note that these three objects are located in the first Galactic quadrant and that, apparently, are not related to any OB association.
We also represent in this figure the OB stars used in our analysis of the spatial structure of the GB (Paper I). The associations Sco OB2, Ori OB1, Per OB2 and Lac OB1 are classically thought to be components of the GB (e.g Olano 1982), and studies that followed the Hipparcos mission suggest that Vel OB2, Tr 10 and Collinder 121 also belong to the GB (de Zeeuw et al., 1999), although their position close to the line of nodes where the GB intersects the Galactic disk adds quite some uncertainty to this membership assignation. In any case, it is evident that the Sco OB2 and Ori OB1 associations respectively mark the South and North Galactic extremes of the inclined plane which best describes the stellar system known as the GB, and that in a certain sense the geometrical characterization of the GB is defined by the relative position of these two associations.
Thus, we have marked with a red cross the stars belonging to the Sco OB2 association, following the coordinates as given by de Zeeuw et al. (1999), that situate the complex in the range , -10° 30°and D = 100 220 pc, and that we have tagged as Scorpius-Centaurus in the figure. In the same manner, we have selected the stars belonging to Ori OB1 as those in the range , -12° -26°and D = 300 550 pc (de Zeeuw et al., 1999). These stars appear in Figure 3 as green triangles, and the region is tagged as Orion. Estimations of the age range of these associations indicate that Sco OB2 members are between 5 and 20 Myr old (Sartori et al., 2003), while the typical age of Ori OB1 members is comprised between some 105 yr and 11 Myr (Briceño et al., 2005; Hernández et al., 2006).
Hence we are facing two associations with sizes and ages relatively similar, and according to de Zeeuw et al. (1999), with a number of probable Sco OB2 members larger than that of Ori OB1. With these data it sounds reasonable enough to think that the star cluster population related to Sco OB2 should be larger than that related to Ori OB1. But what we observe in Figure 3A is exactly the opposite. There is not a single cluster within the frontiers of Sco OB2, while we have detected 11 objects associated to Ori OB1 (73, 74, 75, 76, 77, 80, 1016, 1018, 1019, 1020, 1021), six of them being “probable” bound clusters (73=NGC 1981,74=NGC 1976, 75=NGC 1977, 1018, 1019, 1020). This is better observed in Figure 3 (bottom panel), where we have represented only those clusters cataloged as “probable” bound ones, tagged with number 1 in the last column of table 1. This figure shows how almost the totality of the “probable” bound clusters associated to the GB are located in the Orion and the Puppis-Vela regions. Moreover, almost all of the other objects show no relationship with other OB associations in the GB.
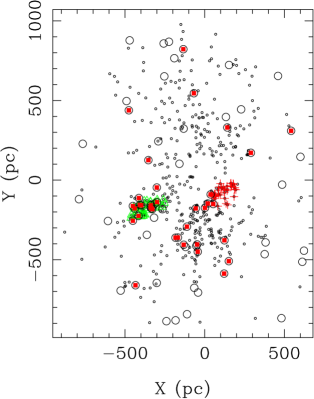
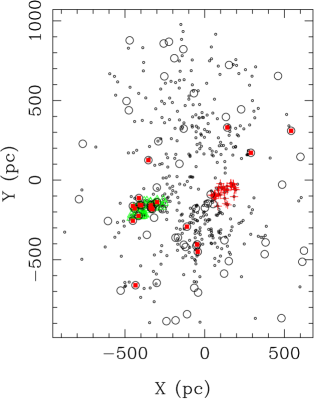
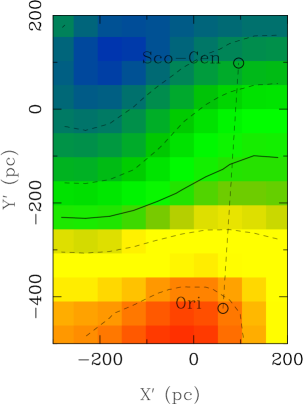
The same phenomenology can be observed in Figures 4 and 5, where we have represented the GB cluster distribution in the spatial projections and . The LGD clusters tend to distribute uniformly across the Galactic plane in Figure 4, but that is not the case for GB open clusters. We observe how the GB’s distribution is quite clumpy; many of the clusters are located in the region of Vela, and we specially note that the region of Orion (in the third quadrant of the plane, and around the most negative values of in the Figure 5) presents an important concentration of members. Moreover, if we consider only clusters with a higher membership probability (75%, as noted in Figure 6), and thus eliminating most of the clusters around the line of nodes in which the GB plane intersects the LGD plane, the GB is practically reduced to the Orion region, as if that were the solely cluster population of the GB.
This analysis shows as an evident fact that while the Ori OB1 association is related with an important population of star clusters (be they transitory stellar condensations or gravitationally bound systems), the Sco OB2 complex does not include a single star cluster within its frontiers, yet it is extremely rich in massive OB stars and pre-main sequence stars (Sartori et al., 2003). In other words, inside an apparently single star formation complex as the GB, and separated only by about 500 pc, we find two star forming regions, well defined both spatially and kinematically, that present two clearly distinct modes of star formation. Orion is an OB association that presents a large number of stellar condensations seen as clusters, some of which appear to be gravitationally bound. On the other hand, Sco-Cen seems to be forming only isolated stars or loose groups that do not present the shape of a star cluster, and thus have not been detected as such. But, how does this fact translate to the velocity space?
3.2 Kinematic behavior
It seems obvious that the different spatial position of the centroids of the two stellar groups analyzed in Section 3.1, implies also a different location in the velocity space, specially in the component due to their separation of almost 500 pc in the axis. The velocity centroids of these two associations, Ori OB1 and Sco OB2, as defined by the GB stars, are located at (-16.4, -9.5, -5.0) and (-8.0, -19.4, -6.0) km s-1, respectively. This can be clearly observed in Figure 7 (top panel), where we have represented in the plane the isodensity lines of the GB as defined by massive stars, as well as the member stars of Ori OB1 and Sco OB2, according to the criteria by de Zeeuw et al. (1999) explained in Section 3.1, and the GB star clusters. Once more, as it was expected, we observe a clear correlation between the clusters’ distribution and the Orion velocity centroid, while the number of GB clusters associated to the Sco-Cen complex is merely marginal.
The difference is even more evident if we limit ourselves to the youngest clusters, which could be representatives of transient stellar condensations (Figure 7, bottom panel). As we have commented above, the difference observed between the velocity centroids was predictable due to the differential Galactic rotation and to the fact that both groups were quite separated in space. However, we wonder if the rotation field in this region of the Galaxy can completely explain the kinematic behavior of both the stars and the clusters in the GB.
Moreno et al. (1999) analyzed the velocity space of a sample of OB stars belonging to the GB, and found that the observed velocity field was not compatible with that obtained from star formation models, as well as with its dynamical evolution after the injection of momentum and energy in the primeval cloud. In other words, the residual velocities of the stars showed a highly negative vertex deviation (Filin, 1957; Mihalas & Binney, 1981) that could not be explained by the dynamical model, because after a time interval quite inferior than the age of the GB, the differential rotation prevailed over the movements originated by the “ad hoc” energy and momentum injection, and gave place to a slightly positive vertex deviation. Moreno et al. (1999) also found that if the stars belonging to the Sco-Cen association were eliminated, the vertex deviation became positive. That is, those models designed to explain the origin of the GB from supernovae explosions after a previous process of star formation, or from the impact of a high velocity cloud on the Galactic disk (see Pöppel 1997, 2001 and Sartori et al. 2003 for reviews about possibly formation mechanisms of the GB) are not able to explain the observed residual velocity field, unless the Sco-Cen stars are neglected.
Now we want to evaluate the residual velocity ellipsoid for the GB clusters; in order to do so, we have corrected the velocities from solar motion and differential rotation using the Oort constants: A = 16 km s-1 kpc -1 and B = -16 km s-1 kpc -1 (Paper II, Méndez et al. 2000). These cluster residual velocities are represented in Figure 8, along with the residual velocities of OB stars, where different marks indicate those belonging to Ori OB1 and Sco OB2. Then we calculate the longitude of the vertex, , for both systems, the LGD and the GB cluster samples. The result, if we cut at GB membership probability of 50%, is that for the LGD, and that for the GB. This is a value very far from the GB vertex deviation of found in Paper II for the OB stars belonging to the GB. This is undoubtedly caused by the absence of clusters in the Sco-Cen association, that was responsible for the large vertex deviation of the GB (Moreno et al. 1999; Paper II). Moreover, if we keep only GB clusters with a membership probability higher than 75%, the vertex deviation of the system is , which is practically the same as that of the LGD.
The vertex estimation for the star cluster system in the GB thus gives us a double information. First, from a kinematic point of view, the lack of star cluster associated to the Sco OB2 complex is demonstrated. Second, the difference in the velocity space between the Ori OB1 and Sco OB2 associations cannot be completely explained by the Galactic differential rotation.
As we may see in Figure 8, the residual velocity distributions of these two associations show different behavior. While the stars belonging to Ori OB1 present a main velocity dispersion axis with a positive vertex, the Sco OB2 stars present a main axis that is almost perpendicular to the former, with a clearly negative vertex deviation. Therefore, as it had already been noted (Moreno et al. 1999; Paper II), the vertex deviation in the solar neighborhood will depend on the selection of the sample. If most of the sample stars belong to Sco OB2, the vertex deviation will undoubtedly be negative. If we extend our sample farther away from the Sun in order to include Orion stars, we will reach some balance and thus the vertex deviation will turn towards values closer to zero. The latter is precisely what we observe in the star cluster population associated to the GB: the lack of clusters within the Sco-Cen complex makes the vertex deviation close to zero.
3.3 Cluster complexes and scaled OB associations
What we have observed when comparing the distribution of star clusters and OB stars in the GB is that the two great complexes that seem to define the North and South Galactic extremes of this large stellar structure, show a different behavior according to the scenery of hierarchical star formation. Ori OB1 shows a considerable portion of its stellar population as grouped and forming star clusters, half of them being probable bound clusters with ages larger than 10 Myr. This kind of stellar system has been detected, observed and analyzed in both the Milky Way (Efremov & Sitnik, 1988; Alfaro et al., 1991) and other galaxies (e.g., 30 Doradus in the LMC; Hunter et al. 1995; Walborn et al. 2002); not only it contains a rich star cluster population, but also it is normally immersed inside a stellar halo.
On the opposite side of the star forming regions concentration range, there can be found the scaled OB associations (SOBAs; e.g., Maíz-Apellániz 2001), of which NGC 604 in M33 is a good example. Although the star formation rate in NGC 604 is much higher than that observed in the Sco OB2 association, they both have in common their lack of star clusters. Thus, separated only by 500 pc, there are two OB associations that, apparently, have been born from molecular clouds under different ambient conditions, but that always have been considered as the fundamental parts of a single stellar system known as the GB. However, Ori OB1 seems to represent the stellar halo associated to a cluster complex, while Sco OB2 appears to be a clear example of an OB association, not related to cluster formation.
If we interpret this result in terms of a hierarchical star formation process (Elmegreen, 2006, 2008), and considering that the age of the stars in both associations present similar ranges, we should consider either that the density maximum in the parental gas distribution of Sco OB2 was inferior than the density peaks in the clouds that formed Ori OB1, or that the tidal forces in the Sco-Cen region were intense enough to destroy any substructure observable as a star cluster, in an interval of time lesser than 10 Myr.
Any of these two possibilities requires some variations of the ambient physical conditions in spatial scales smaller than 500 pc, be they due to an external difference of pressure that caused higher density peaks in the Orion region, or/and due to local gravitational potentials or shear forces that shorten the lifetimes of the transient stellar condensations in the Sco-Cen region.
3.4 The Orion Arm
Since the pioneering work of Becker (1956), who traced the local spiral structure from the young star clusters distribution within a radius of 2 kpc, each time that a new catalog of star clusters has been tailored, the corresponding map of this local spiral structure has been drawn again (e.g., Janes & Adler 1982). The results of doing this show a series of cluster groupings with typical sizes the order of 1 kpc (Efremov & Sitnik, 1988; Alfaro et al., 1991, 1992) that seem to follow three segments of spiral arms which have received the names of Carina-Sagittarius Arm, Perseus Arm and Orion Arm (also known as Local Arm). The inclusion of these optical segments within the general scheme of the spiral structure of the Galaxy is controversial, and depending on the spiral tracers and the analysis techniques employed, different solutions for the number of arms, their pitch angle or the velocity of the density pattern have been found (see Naoz & Shaviv 2007, and references therein).
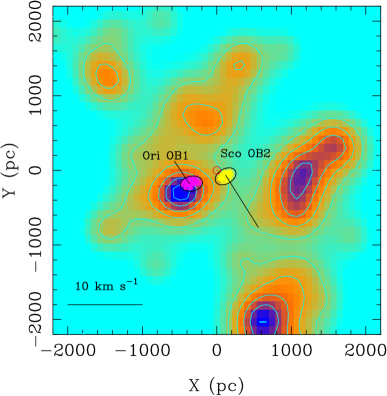
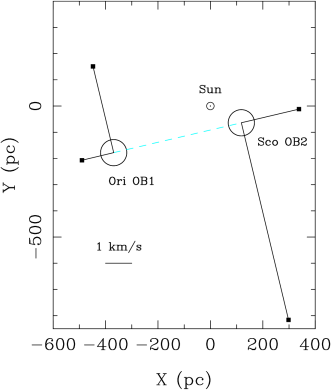
In Figure 9 we represent the density map for the star clusters younger than 10 Myr, inside a square of side length 4 kpc, centered in the Sun. The data have been extracted from the COCD catalog. In the figure we observe five main concentrations of young clusters that had previously been detected by other authors (e.g., Efremov & Sitnik 1988). In particular, the Orion and Cygnus complexes seem to align, delimiting the local optical segment of the Orion Arm. Superimposed over the young clusters density map, we have drawn the Ori OB1 and Sco OB2 associations. The lines that depart from the centroids of both associations represent their residual velocities, corrected from solar motion and differential rotation.
Ori OB1 appears associated to the density maximum of the Orion Arm defined by the young clusters; on the contrary, Sco OB2 is located in the inner rim of the Arm, close to the Sun where the cluster density is lower. If we consider that a higher density of clusters is representative of a higher ambient pressure in the original gas, the relative position of these associations in respect to the main locus of the Orion spiral arm could explain their different content of star clusters.
To better illustrate this, we define a Cluster Formation Index (CFI) that describes the relative content of clusters with respect to the OB stars that shape the GB:
| (1) |
The spatial densities of clusters and OB stars have been obtained by using gaussian kernels in the GB plane (), with a = 200 pc, and normalized so that the total sum of the density be equal to 1. Then, Figure 10 shows the distribution in the GB plane of the CFI parameter in the region that contains both OB associations. A line that joins the centroids of both associations has been represented over the density map and a cut along this line (Figure 11), clearly shows a CFI gradient that ranges from 0.62 at the maximum near Orion to 0.39 in the vicinity of Scorpius Centaurus. Since the distance to the Ori OB1 centroid is a good estimator of the distance to the Orion spiral arm, this indicates that as we move away from the arm, the clustered star formation is less efficient.
3.5 The Nature of the Gould Belt
The first detection of the GB was based in the fact that the brightest stars in the sky, specially in the southern hemisphere, present an eccentric position with respect to the great circle of the Milky Way (Herschel, 1847; Gould, 1879). That is, it was a mere morphological matter. Later studies determined the main stellar and gaseous components of the GB, and from the analysis of their spatial and kinematical properties, the shape, size and kinematics of the GB were estimated.
Although the main parameters that describe the GB, published along the past two decades, may differ depending on the authors (see Paper I; Pöppel 1997 and references therein), the general scheme of the GB is similar for most of them: we are facing a star formation complex with a disk-like structure and a radius of about 500 pc, whose kinematic behavior is characterized by an expansion and a rotation with respect to an internal axis. In most of the works that contributed to the determination of these characteristics, the separation between the probable members of the GB and the stars belonging to the LGD has been performed. The analysis of the stellar component of both groups has led to the conclusion that the GB and the LGD are not only separated in the celestial sphere, but they present different kinematic properties as well.
In most of these analyses it was necessary to perform a previous separation of the elements belonging to either group, and in all those cases such separation was mainly geometric (be it either in the - plane, in the different , , projections, or via a three-dimensional analysis). In other words, the stars that are the brightest and the farthest from the Milky Way plane, and that belong to the Sco-Cen and Orion constellations, seem to have been the ones that opened the gates to this flood of studies, and also the ones that, still today, best define and delimit the geometry of the GB.
Then, we shall perform the following experiment: let us consider the GB as defined only by two points whose coordinates in the phase space are given by the spatial coordinates of the centroids of the Ori OB1 and Sco OB2 association, and their velocities by their respective central values of their residual velocities (table 2). A schema of the geometry of the problem is shown in Figure 12. Using these values, we determine the inclination (), the longitude of the ascending node (), the expansion velocity along the line that joins the spatial centroids () and the rotation velocity with respect to a point situated along the main axis of the system (), we reach the results listed on table 3, where we also present the range of values found in the literature for the different variables in the GB.
These values are all very close to those of the fundamental parameters of the GB that we can find in the literature (e.g., Paper I; Fresneau et al. 1996; Lindblad 2000, among others). But on sight of Figure 9, where we represent the position and the residual velocities of both associations with respect to the Orion Arm, we may ask ourselves if it makes any sense at all talking about a gas and stars system with spatial and kinematic coherence that may be described with some expansion and rotation velocities, or perhaps we should definitely drop the traditional hypothesis of a single, common origin for all the features of the GB, and begin to look at it as a hazardous alignment -from out point of view- of at least two of the many clumps in the hierarchical structure of the Local Arm, with different densities and star formation history. In this sense, the GB would be simply the projection over the sky of the recent star formation in the clouds close to the Sun but located far away from the fundamental Galactic plane. Therefore, it is morphologically distinct, but does not necessarily represent a physical system with unique properties, different from the star formation within the Orion Arm.
We believe that the distinct properties of these two clumps –their kinematic behavior, cluster content and height over the Galactic plane- may be explained by the internal dynamics of the Galactic disk. Further research should consider, as possible mechanisms involved in the development of such a structure, the passing of a density wave in a magnetized medium or the presence of a long bar generating resonances in the external parts of the disk (Gardner et al., 2008).
Thus, if we could observe our Galaxy from an external position several megaparsecs away, what would stand out in the solar neighborhood? Undoubtedly, the complex of blue star clusters inside the Local Arm, where the Ori OB1 and Sco OB2 associations, that form the main structure of the GB, would just be accessory elements related to the nucleus of the complex and its periphery, respectively.
4 Conclusions
From a sample of star clusters younger than 100 Myr, and located within a radius of 1 kpc around the Sun, we have analyzed the spatial and kinematical structure of the GB. The comparative analysis between the populations of stellar clusters and OB stars in the GB, indicates that the Ori OB1 and Sco OB2 associations present a significant difference in the number of clusters related to them, and that this difference is even more conspicuous in the case of the transient stellar condensations. While Ori OB1 can be characterized as the stellar population associated with the core of a star cluster complex (e.g., 30 Doradus), the Sco-Cen complex apparently shows a star formation mode where the generation of isolated stars is dominant.
In the light of this scenario of hierarchical star formation, this difference in the content of stellar clusters must have been caused by different physical conditions of the primeval clouds and/or inhomogeneities of the gravitational potential. The main physical characteristics of these two large associations are:
-
1.
Different height over the Galactic plane
-
2.
Different content of stellar clusters
-
3.
Different residual velocity vectors
All these differences can be explained, at least qualitatively, by the different position of these two associations with respect to the main loci of the young stellar clusters that define the Orion Arm. According to this scenario, the GB can be considered as a partial and biased vision of a much larger scale process of stellar formation, which is currently visible as a star cluster complex in the region of the Orion Arm that is closest to us.
Acknowledgments
We thank the referee for the useful comments. This research has made use of the WEBDA database, operated at the Institute for Astronomy of the University of Vienna, and the NASA’s Astrophysics Data System. We would like to acknowledge the funding from MICCIN of Spain through grant AYA2007-64052 and from Consejería de Innovación, Ciencia y Empresa (Junta de Andalucía) through TIC-101. This work has been partially funded by the CONSOLIDER-INGENIO-2010 program from MEC (Spain) through project First Science with the GTC.
References
- Alfaro et al. (1991) Alfaro, E.J., Cabrera-Cano, J., Delgado, A.J. 1991, ApJ, 378, 106
- Alfaro et al. (1992) Alfaro, E.J., Cabrera-Cano, J., Delgado, A.J. 1992, ApJ, 399, 576
- Becker (1956) Becker, W. 1956, Vistas in Astronomy, 2, 1515
- Blaauw (1965) Blaauw, A. 1965, Koninkl. Ned. Akad. Wetenschap., 74, No. 4
- Briceño et al. (2005) Briceño, C., Calvet, N., Hernández, J., Vivas, A.K., Hartmann, L., Downes, J.J., Berlind, P. 2005, AJ, 129, 907
- Comerón (2001) Comerón, F. 2001, A&A, 365, 417
- Dame et al. (1993) Dame, T.M., et al. 1987 ApJ, 322, 706
- de Geus (1992) de Geus, E.J. 1992, A&A, 262, 258
- de Zeeuw et al. (1999) de Zeeuw, P.T., Hoogerwerf, R., de Bruijne, J.H.J., Brown, A.G.A., Blaauw, A. 1999, AJ, 117, 354
- Delgado et al. (2006) Delgado, A.J., González-Martín, O., Alfaro, E.J., Yun, J. 2006, ApJ, 646, 269
- Delgado et al. (2007) Delgado, A.J., Alfaro, E.J., & Yun, J.L. 2007, A&A, 467, 1397
- Efremov (1978) Efremov, Yu. N. 1978, SvAL, 4, 66
- Efremov (1995) Efremov, Yu. N. 1995, AJ, 110, 2757
- Efremov & Elmegreen (1998) Efremov, Yu. N., Elmegreen, B.G. 1998, MNRAS, 299, 588
- Efremov & Sitnik (1988) Efremov, Y.N., Sitnik, T.G. 1988, Soviet Astronomy Letters, 14, 347
- Elias et al. (2006a) Elias, F., Cabrera-Caño, J., Alfaro, E. 2006, AJ, 131, 2700
- Elias et al. (2006b) Elias, F., Alfaro, E., Cabrera-Caño, J. 2006, AJ, 132, 1052
- Elmegreen (1982) Elmegreen, B.G. 1982, in Submillimeter Wave Astronomy, eds. J.E. Beckman & J.P. Phillips
- Elmegreen (2000) Elmegreen, B.G. 2000, ApJ, 530, 277
- Elmegreen (2006) Elmegreen, B.G. 2006, preprint (astro-ph/0610679)
- Elmegreen (2008) Elmegreen, B.G. 2008, ApJ, 672, 1006
- Elmegreen et al. (2000) Elmegreen, B.G., Efremov, Y., Pudritz, R.E., Zinnecker, H., 2000, in Protostars and Planets IV, eds. V. Mannings, A.P. Boss, S.S. Russell, Tucson: University of Arizona Press
- Fall et al. (2005) Fall, S.M., Chandar, R., Whitmore, B.C. 2006, ApJ, 631, 133
- Filin (1957) Filin, A.Ia. 1957, Soviet Astron., 1, 517
- Franco et al. (2002) Franco, J., Kim, J., Alfaro, E.J., Hong, S.S. 2002, ApJ, 570, 647
- Fresneau et al. (1996) Fresneau, A., Acker, A., Jasniewicz, G., Piat, M. 1996, AJ, 112, 1614
- Fũrész et al. (2006) Fũrész, G., et al. 2006, ApJ, 648, 1090
- Gardner et al. (2008) Gardner, E., Innanen, Kimmo A., Flynn, C., 2008, (preprint: arXiv:0808.0498)
- Gaustad & Van Buren (1993) Gaustad, J.E., Van Buren, D. 1993, PASP, 105, 1127
- Gould (1879) Gould, B.A. 1879, Uranometría Argentina, Result. Obs. Nac. Argentino, I, p. 354
- Grenier (2004) Grenier, I. A. 2004, preprint (astro-ph/9096)
- Guillout et al. (1998) Guillout, P., Sterzik, M.F., Schmitt, J.H.M.M., Motch, C., Neuhaeuser, R. 1998, A&A, 337, 113
- Hernández et al. (2006) Hernández, J., Briceño, C., Calvet, N., Hartmann, L., Muzerolle, J., Quintero, A. 2006, ApJ, 652, 472
- Herschel (1847) Herschel, J.F.W. 1847, Results of Astron. Observations made during the years 1834-1838 at the Cape of Good Hope, London
- Hunter et al. (1995) Hunter, D.A., Shaya, E.J., Scowen, P., Hester, J.J., Groth, E.J., Lynds, R., O’Neil, E.J., Jr. 1995, ApJ, 444, 758
- Janes & Adler (1982) Janes, K., Adler, D. 1982, ApJs, 49, 425
- Kharchenko et al. (2005a) Kharchenko, N.V.,Piskunov, A.E., R ser, S., Schilbach, E., Scholz, R.-D. 2005, A&A, 438, 1163
- Kharchenko et al. (2005b) Kharchenko, N.V.,Piskunov, A.E., R ser, S., Schilbach, E., Scholz, R.-D. 2005, A&A, 440, 403
- Kutner et al. (1977) Kutner, M.L., Tucker, K.D., Chin, G., Thaddeus, P. 1977, ApJ, 215, 521
- Larson (1981) Larson, R.B. 1981, MNRAS, 194, 809
- Lesh (1968) Lesh, R.J. 1968, ApJs, 17, 371
- Lindblad (1967) Lindblad, P.O. 1967, BAN, 19, 34
- Lindblad et al. (1973) Lindblad, P.O., Grape, K., Sandqvist, A., Schober, J. 1973, A&A, 24, 309
- Lindblad (2000) Lindblad, P.O. 2000, A&A, 363, 154
- Maíz-Apellániz (2001) Maíz-Apellániz, J. 2001, ApJ, 563, 151
- Méndez et al. (2000) Méndez, R.A., Platais, I., Girard, T.M., Kozhurina-Platais, V., van Altena, W.F. 2000, AJ, 119, 813
- Mermilliod (1995) Mermilliod, J. C. 1995, in Information and On-Line Data in Astronomy, ed. D. Egret & M. A. Albrecht (Dordrecht: Kluwer), 127
- Mihalas & Binney (1981) Mihalas, D., Binney, J. 1981. Galactic astronomy: Structure and kinematics, W. H. Freeman and Co., San Francisco, CA
- Moreno et al. (1999) Moreno, E., Alfaro, E.J., Franco, J. 1999, ApJ, 522, 276
- Naoz & Shaviv (2007) Naoz, S., Shaviv, N.J. 2007, NewA, 12, 410
- Olano (1982) Olano, C.A. 1982, A&A, 112, 195
- Perryman et al. (1997) Perryman, M.A.C., et al. 1997, The Hipparcos and Tycho Catalogues (ESA Sp-1200; Noordwijk: ESA)
- Piskunov et al. (2006) Piskunov, A.E., Kharchenko, N.V., Röser, S., Schilbach, E., Scholz, R.-D. 2006, A&A, 445, 545
- Pöppel (1997) Pöppel, W. 1997, FCPh, 18, 1
- Pöppel (2001) Pöppel, W. 2001, ASPC, 243, 667
- Sánchez et al. (2005) Sánchez, N., Alfaro, E.J., Pérez, E. 2005, ApJ, 625, 849
- Sánchez et al. (2007) Sánchez, N., Alfaro, E.J., Pérez, E. 2007, ApJ, 656, 222
- Sancisi et al. (1974) Sancisi, R., Goss, W.M., Anderson, C., Johansson, L.E.B., Winnberg, A. 1974 A&A, 35, 445
- Sandqvist (1977) Sandqvist, Aa. 1977, A&A, 57, 467
- Sartori et al. (2003) Sartori, M.J., Lépine, J.R.D., Dias, W.S. 2003, A&A, 404, 913
- Stothers & Frogel (1974) Stothers, R., Frogel, J.A. 1974, AJ, 79, 456
- Taylor et al. (1987) Taylor, D.K., Dickman, R.L., Scoville N.Z. 1987, ApJ, 315, 104
- Tomita (1986) Tomita, Y. 1986, AP&SS, 118, 409
- Tomita (1987) Tomita, Y. 1987, IAU Symp., 115, 51
- Torra et al. (2000) Torra, J., Fernández, D., & Figueras, F. 2000, A&A, 359, 82
- van den Bergh (1966) van den Bergh, S. 1966, AJ, 71, 990
- Walborn et al. (2002) Walborn, N.R., Maíz-Apellániz, J., Barbá, R.H. 2002, AJ, 124, 1601
- Walsh et al. (2006) Walsh, A.J., Bourke, T.L., Myers, P.C., 2006, ApJ, 637, 860
- Westin (1985) Westin, T.N.G. 1985, A&As, 60, 99


| COCD | Name | R | R | ||||||||||||
|---|---|---|---|---|---|---|---|---|---|---|---|---|---|---|---|
| () | () | () | () | () | () | () | () | () | () | () | () | (%) | |||
| Berkeley 59 | |||||||||||||||
| Stock 7 | - | ||||||||||||||
| Trumpler 2 | - | - | |||||||||||||
| Stock 23 | |||||||||||||||
| Melotte 20 | - | - | - | ||||||||||||
| IC 348 | - | - | |||||||||||||
| Collinder 65 | - | - | |||||||||||||
| Collinder 69 | - | - | |||||||||||||
| NGC 1981 | - | - | |||||||||||||
| NGC 1976 | - | - | - | ||||||||||||
| NGC 1977 | - | - | |||||||||||||
| NGC 1980 | - | - | - | ||||||||||||
| Collinder 70 | - | ||||||||||||||
| Sigma Ori | - | - | |||||||||||||
| Platais 6 | - | - | - | ||||||||||||
| Collinder 89 | - | ||||||||||||||
| NGC 2232 | - | ||||||||||||||
| NGC 2264 | - | ||||||||||||||
| Alessi 21 | - | - | |||||||||||||
| Collinder 132 | - | - | - | ||||||||||||
| Collinder 135 | - | ||||||||||||||
| Collinder 140 | - | - | - | ||||||||||||
| Bochum 4 | |||||||||||||||
| Haffner 13 | - | - | - | ||||||||||||
| NGC 2451A | - | - | - | ||||||||||||
| NGC 2451B | - | ||||||||||||||
| Vel OB2 | - | ||||||||||||||
| NGC 2547 | - | ||||||||||||||
| NGC 2546 | - | - | |||||||||||||
| vdBergh-Hagen 23 | - | ||||||||||||||
| IC 2391 | - | - | |||||||||||||
| Mamajek 1 | - | - | - | ||||||||||||
| IC 2395 | - | - | |||||||||||||
| Trumpler 10 | - | - | |||||||||||||
| vdBergh-Hagen 56 | |||||||||||||||
| Platais 8 | - | ||||||||||||||
| vdBergh-Hagen 99 | - | - | - | ||||||||||||
| IC 2602 | - | ||||||||||||||
| Alessi 5 | - | - | - | ||||||||||||
| vdBergh-Hagen 164 | - | - | |||||||||||||
| NGC 6025 | |||||||||||||||
| NGC 6087 | |||||||||||||||
| NGC 6322 | - | - | |||||||||||||
| NGC 6383 | - |
| COCD | Name | R | R | ||||||||||||
|---|---|---|---|---|---|---|---|---|---|---|---|---|---|---|---|
| () | () | () | () | () | () | () | () | () | () | () | () | (%) | |||
| NGC 6405 | - | ||||||||||||||
| IC 4665 | - | - | |||||||||||||
| Collinder 359 | - | - | |||||||||||||
| NGC 6514 | - | ||||||||||||||
| IC 4725 | - | ||||||||||||||
| Stephenson 1 | - | - | - | ||||||||||||
| Roslund 5 | - | - | - | ||||||||||||
| Collinder 419 | - | - | |||||||||||||
| IC 1396 | - | ||||||||||||||
| NGC 7160 | - | ||||||||||||||
| Pismis-Moreno 1 | - | - | |||||||||||||
| Cep OB3 | |||||||||||||||
| ASCC 13 | - | ||||||||||||||
| ASCC 16 | |||||||||||||||
| ASCC 18 | |||||||||||||||
| ASCC 19 | - | ||||||||||||||
| ASCC 20 | - | ||||||||||||||
| ASCC 21 | - | ||||||||||||||
| ASCC 24 | - | ||||||||||||||
| ASCC 33 | - | ||||||||||||||
| ASCC 47 | |||||||||||||||
| ASCC 50 | |||||||||||||||
| ASCC 58 | |||||||||||||||
| ASCC 69 | |||||||||||||||
| ASCC 76 | |||||||||||||||
| ASCC 79 | |||||||||||||||
| ASCC 84 | |||||||||||||||
| ASCC 104 | |||||||||||||||
| ASCC 105 | |||||||||||||||
| ASCC 114 | |||||||||||||||
| ASCC 118 | |||||||||||||||
| ASCC 127 |
| Name | ||||||
|---|---|---|---|---|---|---|
| () | () | () | () | () | () | |
| Ori OB1 | ||||||
| Sco OB2 |
| () | () | () | () | |
|---|---|---|---|---|
| Reduced GB | ||||
| Literature |