The superconductor KxSr1-xFe2As2: Normal state and superconducting properties
Abstract
The normal state and superconducting properties are investigated in the phase diagram of KxSr1-xFe2As2 for 0x1. The ground state upper critical field, Hc2(0), is extrapolated from magnetic field dependent resistivity measurements. Hc2(0) scales with the critical temperature, Tc, of the superconducting transition. In the normal state the Seebeck coefficient is shown to experience a dramatic change near a critical substitution of x0.3. This is associated with the formation of a spin density wave state above the superconducting transition temperature. The results provide strong evidence for the reconstruction of the Fermi surface with the onset of magnetic order.
1 Introduction
The discovery of high-temperature superconductivity in rare earth (R) oxypnictides, ROFeAs [1], has initiated extensive research activities in this class of compounds [2, 3, 4, 5, 6]. The main structural building block of the FeAs-based superconductors is the Fe2As2 layer with tetrahedrally coordinated Fe covalently bonded to 4 As atoms. The Fe2As2 blocks are the active layers for the observed superconductivity and they are separated by charge reservoir layers that can modify or change the average charge of the active layer through appropriate chemical substitutions. In ROFeAs the appropriate doping can be achieved by substituting F for O [7, 8, 9, 10, 11] or by removing oxygen [12]. However, the amount of charge carriers introduced is limited and attempts to achieve higher carrier densities in the Fe2As2 layers of the ROFeAs system frequently results in chemical disproportionation and decomposition and the formation of impurity phases [1, 2, 7, 8, 9, 11].
The Fe2As2 layers are very rigid and the charge reservoir blocks can be replaced by different oxygen-free layers, for example, by single layers of alkali metal or alkaline earth (Ae=Ca, Sr, Ba) ions. Stable structures of KFe2As2, CsFe2As2 [13], and LiFeAs [14, 15, 16] have been synthesized and found superconducting at different temperatures. It is interesting that the alkali metal-based compounds apparently do not need any additional doping to induce superconductivity, and they belong to a small family of intrinsic (self-doped) FeAs superconductors. The critical temperatures of KFe2As2 and CsFe2As2 are relatively low, below 4 K, but can be significantly increased up to 37 K by replacing the alkali metals with alkaline earth metals (corresponding to a change of the carrier density in the Fe2As2 layer) [13, 17]. The AeFe2As2 compounds are nonsuperconducting but they show a transition into a spin density wave (SDW) state at higher temperatures. The continuous substitution of K for Sr or Ba in Kx(Sr,Ba)1-xFe2As2 leads to the onset of superconductivity at a critical doping of xc=0.17, an increase of Tc to a maximum T37 K near the optimal doping (x0.45) and, with further increasing x, a decrease of Tc to 3.8 K at x=1 (KFe2As2). Thus a complete superconducting phase diagram is obtained at all doping levels between x=0 and x=1 [13, 18, 19]. The doping dependence of Tc in this system seems to be qualitatively similar to the high-Tc copper oxide superconductors suggesting that the underlying physics in both systems is determined by the control of the charge density in the active Fe2As2 layers. This conjecture recently received support from a high-pressure investigation of KxSr1-xFe2As2 [20]. One major difference of the FeAs- and CuO-based high-temperature superconductors is the existence or coexistence of magnetic order in the carrier density-dependent phase diagram. In the copper oxides antiferromagnetism exists in the undoped, insulating state and it is completely suppressed before superconductivity arises with doping. In KxSr1-xFe2As2 magnetic order in form of a spin density wave has been reported for the non-superconducting SrFe2As2 [21] and BaFe2As2 [22]. The SDW transition is suppressed with doping of potassium, however, in a narrow range of the phase diagram, for 0.17x0.3, the spin density wave and superconducting transitions appear as successive transitions upon cooling [19, 20]. This raises the question about the coexistence of magnetic and superconducting orders in different regions of the phase diagram and it demands a detailed investigation of the physical properties in the whole phase diagram of Kx(Sr,Ba)1-xFe2As2 with special attention to the narrow region between 0.17 and 0.3.
We have therefore synthesized KxSr1-xFe2As2, for 0x1, and measured the normal state and superconducting transport properties. We show that the superconducting phases exhibit very high upper critical fields that scale with the transition temperatures. The Seebeck coefficients, S(T), of the series of samples are positive over the whole temperature range (except for x0), and S exhibits a significant change at x0.3 where the spin density wave state forms at higher temperatures.
2 Synthesis and Experimental
Polycrystalline samples of KxSr1-xFe2As2 were prepared from stoichiometric amounts of the ternary end members, KFe2As2 and SrFe2As2, thoroughly mixed, compressed, and annealed in welded Nb containers (jacketed in quartz) at 700 ∘C for 100 to 120 hours. The high phase purity of the ternary compounds, prepared from high purity K, Sr, and FeAs as described previously [13], guarantees the exceptional quality of the solid solutions and the precise control of the chemical compositions. Electrical conductivities were measured by a four probe technique using the low-frequency (19 Hz) resistance bridge LR700 (Linear Research) and a Physical Property Measurement System (Quantum Design) for temperature (T 1.8 K) and magnetic field (H 7 Tesla) controls. The Seebeck coefficients were measured between 300 K and 5 K employing a high precision ac technique with a dual heater system [23]. The error in the measurements is about 0.05 V/K.
3 Results and Discussion
3.1 Structure and lattice parameters
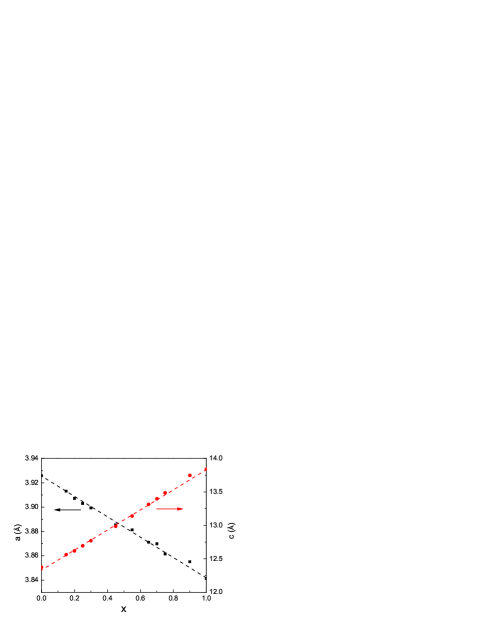
The room temperature X-ray diffraction data of all samples were indexed to the ThCr2Si2-type tetragonal I4/mmm structure. The systematic change of the a- and c-axis lattice constants (Fig. 1) indicate the formation of a uniform solution between the two compounds KFe2As2 and SrFe2As2. The increase of the c-axis by nearly 12 % with increasing x is consistent with the larger K atom replacing the smaller Sr atom. The change of the a-axis (2 % decrease from SrFe2As2 to KFe2As2) is much smaller. The systematic changes in the unit cell parameters result in an increase of the volume as well as the c/a ratio with x.
3.2 Resistivity at zero field: The phase diagram
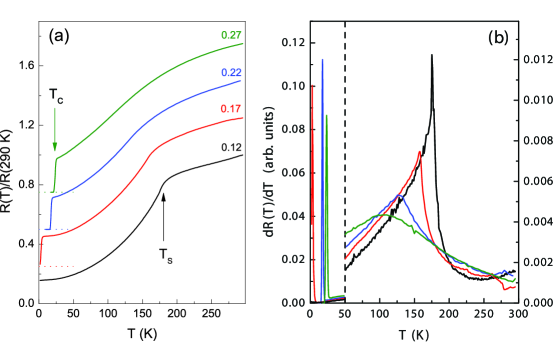
The resistivity of SrFe2As2 shows the distinct anomaly (inflection point) at the spin density wave (SDW) transition temperature, TS=204 K, as reported earlier [21]. This anomaly is very sharp and it was shown recently that the SDW transition in SrFe2As2 coincides with a structural deformation accompanied by a change of symmetry from tetragonal (TTS) to orthorhombic (TTS) [24, 25]. With increasing K content, the SDW anomaly shifts to lower temperatures as shown in Fig. 2. For x=0.12, the SDW transition temperature decreased to 175 K from 204 K (x=0). With further increasing x, the critical temperature TS drops quickly and the sharp anomaly of dR/dT disappears near x0.3, limiting the SDW state to the very strontium-rich region of the phase diagram. It is interesting to note that, before the SDW state is completely suppressed, superconductivity arises at a K concentration of about 0.17, with a Tc of 2.9 K (Fig. 2). Therefore, in a narrow range of chemical composition, between x=0.17 and x=0.3, KxSr1-xFe2As2 passes from a nonmagnetic into a SDW state at TS and then into the superconducting state at Tc. It is not clear, however, if the SDW order survives the transition into the superconducting state, and if both orders coexist at low temperatures.
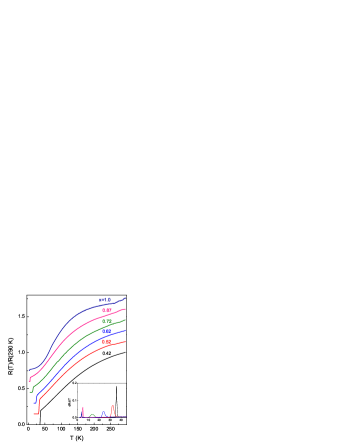
Upon further increasing x (hole doping) the superconducting Tc rises to a maximum of 37 K and decreases again between xmax=0.45 and x=0. The resistivity data for x0.3 are shown in Fig. 3. The temperature derivative, dR/dT, clearly defines the critical temperature and shows the sharp resistive transition into the superconducting state. The phase diagram, derived from the resistivity data and shown in Fig. 4, is slightly asymmetric with respect to x. The nearly parabolic Tc(x) curve develops a tail-like extension to large values of x, and the ternary KFe2As2 remains superconducting with a Tc of 3.8 K. The major part of the phase diagram is similar to that known for the high-Tc cuprate superconductors having a dome-shaped parabolic Tc dependence on the carrier density. The main qualitative difference is the tail of the phase boundary in the KxSr1-xFe2As2 system.
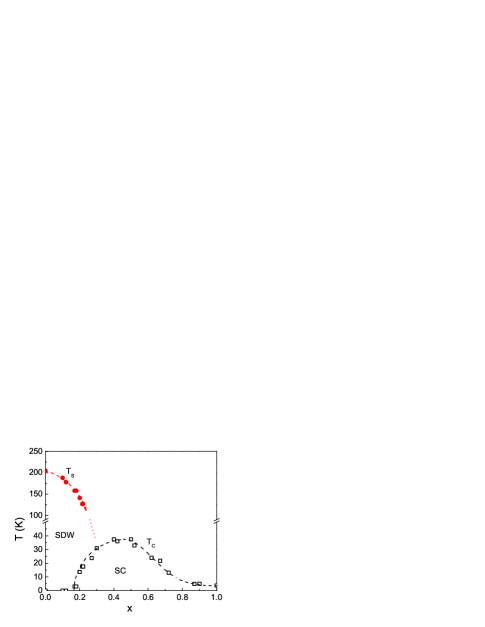
The extrapolation of the SDW phase boundary to lower temperatures suggests that the magnetically ordered state becomes unstable for values of x0.3. The coexistence of both, the SDW and the superconducting transitions between x=0.17 and x=0.3 is another distinct feature that is different from the cuprate superconductors. In the latter system the antiferromagnetic order of the copper spins is completely suppressed before superconductivity sets in at a higher doping level, and both transitions do not coexist at any point of the Tc(n) (n carrier density) phase diagram. The extrapolation of TS to zero temperature, as schematically shown in Fig. 4 (dotted line), may suggest a ”hidden” quantum critical point (QCP) at T=0 and superconductivity induced by magnetic fluctuations. The exact value of x defining the QCP is difficult to determine since the SDW phase boundary is cut off by the superconducting transition and, as shown in Fig. 2 (b), the resistive anomaly that is characteristic for the SDW transition broadens significantly with increasing x. If magnetic fluctuations are involved in the superconducting pairing mechanism one should expect a maximum of Tc close to the critical doping x of the QCP, where the magnetically ordered state comes closest to the superconducting state. In the phase diagram of Fig. 4, the highest Tc is observed at a K content of about 0.45. More detailed experiments are therefore needed near the maximum composition of the superconducting dome. Alternatively, the SDW and superconducting states may compete for the ground state in which case magnetic order would be counterproductive in stabilizing the superconducting state. Recent results of high-pressure experiments have shown that, in the narrow coexistence range of both transitions, the application of external pressure did drastically reduce the SDW temperature whereas the superconducting Tc was enhanced [20], suggesting a possible competition between both states.
3.3 Normal state properties: The Seebeck coefficient
The electrical resistivity of polycrystalline samples depends, to a large extent, on the grain boundary resistance and contributions from grain-grain contacts. It is therefore difficult to extract detailed information about the electronic states. The Seebeck coefficient is less sensitive to grain boundary effects (since it is a zero-current property) and it provides information about both thermodynamic and transport properties of the carriers. Its sensitivity to the electronic band structure makes it a perfect probe in detecting changes in the density of states and the Fermi surface. The Seebeck coefficient for a single band metal can be expressed as [26]
| (1) |
D(E), (E), and (E) are the density of states, an average charge velocity, and the carrier scattering relaxation time, respectively. The first term in the brackets shows the sensitivity of S with respect to changes of the band structure, shifts of the Fermi energy, or instabilities of the Fermi surface.
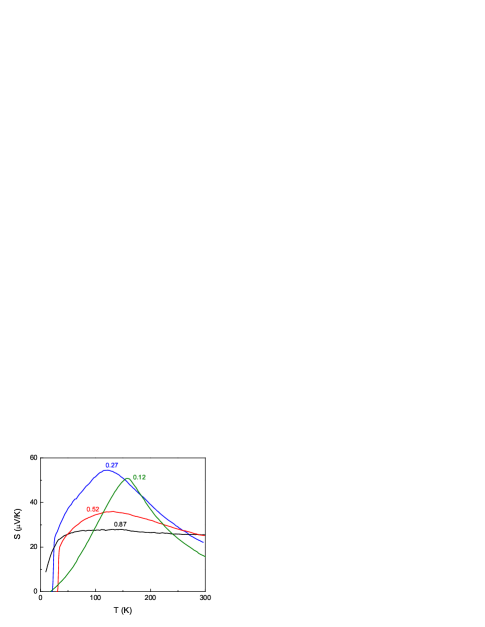
The Seebeck coefficients, S(T), for some selected compositions of KxSr1-xFe2As2 are shown in Fig. 5. S is positive over the whole temperature range (with the exception of SrFe2As2 where it is negative near room temperature and at low T), and drops to zero at the superconducting transition. The positive sign is consistent with the positive Hall coefficient [27] indicating that the majority carriers are holes in the system KxSr1-xFe2As2. However, band structure calculations [28] and ARPES measurements [29] have shown that the Fermi surface consists of states from four different bands, some with electron-like and others with hole-like states. The hole Fermi surfaces are located around the zone center whereas the electron surfaces are at the zone corner (M point) of the primitive tetragonal Brillouin zone. Contributions from all bands to the Seebeck coefficient are therefore expected and the doping and temperature dependence of S(T) will be more complex than expressed by the simple formula (1).
The room temperature values of S initially increase with x as a consequence of hole doping. This could be explained within a rigid band model by a lowering of the Fermi energy and an increase of the density of states. However, results of a recent density functional band structure calculation within a virtual crystal approximation [28] have questioned the validity of the rigid band model and have shown (for the related system KxBa1-xFe2As2) that the density of states depends only weakly on the doping level. The major effect of hole doping is a redistribution of states between the electron and hole pockets of the Fermi surface without significant change of the total N(EF). With increasing x the hole states tend to dominate as is also obvious from the positive signs of the Seebeck coefficient and the Hall number. This redistribution of states with x explains the increase of the room temperature value of S. Since different contributions from electron and hole carriers to S(T) partially cancel out, the weight shift towards the hole pockets at the Fermi surface results in an increase of S(T) even if N(EF) is not changed. The effect is even larger at lower temperatures and it is also reflected in the T-dependence of S.
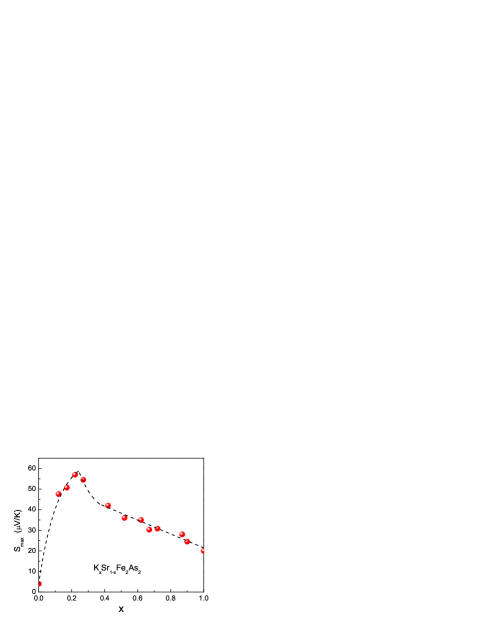
For small values of x, S(T) shows a pronounced maximum near the SDW transition. The maximum value, Smax, rapidly increases with hole doping until x reaches a critical value x0.3. At the critical x, the value of Smax peaks and decreases with further doping. The x-dependence of Smax is shown in Fig. 6. The sharp and distinct peak at the critical composition indicates a dramatic change of the Fermi surface and the density of states with the onset of the SDW order. This might be an indication of an important change in the electronic system and the possible existence of a magnetic quantum phase transition at T=0 that could only be revealed if the superconductivity was completely suppressed. Theoretical calculations show that the SDW state is close in energy to other magnetically ordered states such as ferromagnetism and checkerboard antiferromagnetism. Whenever different magnetic states are competing for the ground state spin fluctuations in the paramagnetic phase may be large and significant. The doping-induced instability of the magnetic order in the presence of large spin fluctuations, possibly giving rise to the pairing interaction in the superconducting state, can then be understood as a delicate balance between the SDW and the superconducting states. Experiments at much lower temperature are suggested to reveal more details about the critical behavior at the SDW phase boundary and the QCP. However, as shown in the phase diagram of Fig. 4, the onset of superconductivity at about 30 K (for x0.3) does not allow the study of the SDW phase boundary closer to zero temperature. The suppression of superconductivity, for example in high magnetic fields, is therefore suggested to investigate the QCP. However, as discussed in the following section, the superconducting critical field in this composition range is very high and static fields of this magnitude may not be available. It is also not clear how the high field would affect the SDW state.
3.4 Upper critical field of the superconducting state
The dependence of superconducting properties on external magnetic fields is an essential property which determines the performance of superconducting devices in magnets, for energy transport, etc. For type-II superconductors, the upper critical field (Hc2) limits the stability range of the superconducting state and its zero temperature value, Hc2(0), is a characteristic quantity that can be determined or extrapolated in high-field measurements. In the KxSr1-xFe2As2 system Hc2(0) can be very high, exceeding 100 Tesla, as shown for the optimally doped compounds [13].
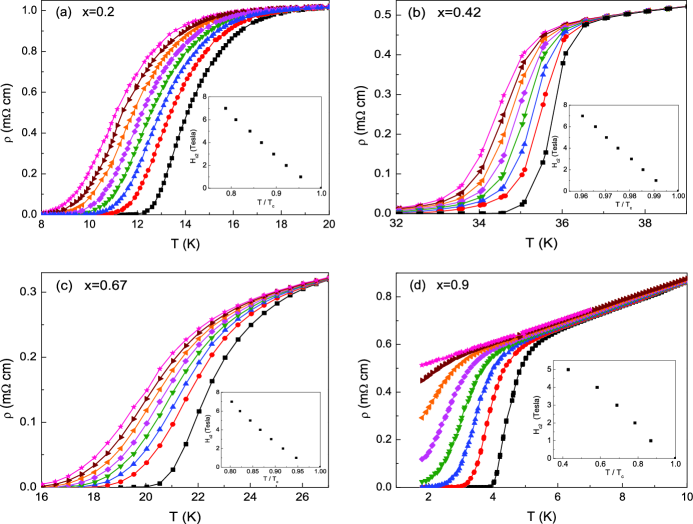
To extrapolate the zero temperature Hc2 for the complete series of KxSr1-xFe2As2 compounds we measured the resistivity in magnetic fields up to 7 Tesla. Some selected data for x=0.2, 0.42, 0.67, and 0.9 are shown in Figs. 7 (a) to (d). The insets to the figures show the temperature dependence of Hc2. Tc at different fields was determined from the midpoint of the resistivity drop. This Tc criteria may appear somewhat arbitrary and the exact value of the extrapolated Hc2(0) may depend on the way Tc was defined (alternative criteria, for example, are the 10 % or 90 % resistivity drop), however, since we are more interested in comparing the estimated Hc2 values for different x throughout the phase diagram the choice of the 50 % resistivity drop is reasonable. The zero temperature Hc2(0) was extrapolated using the Ginzburg-Landau formula, , with , from the data similar to those shown in the insets to Fig. 7. The estimated values are within 5 % of the Hc2 determined from the alternative relation using the slope of Hc2(T) near Tc.
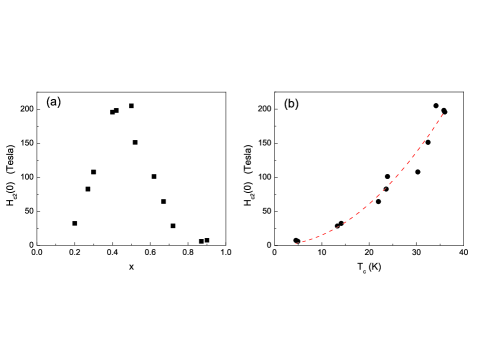
The extrapolated values for Hc2(0) as a function of the K content, x, are shown in Fig. 8 (a). Hc2(0) is very large, up to 200 Tesla, in the optimally doped region of the phase diagram with Tc’s up to 37 K. However, it is drastically reduced, on both sides, where Tc drops to zero (xxmax) or to small values for x1. This suggests that Hc2 scales with the critical temperature. Plotting Hc2(0) versus Tc in Fig. 8 (b) indeed shows a parabolic dependence, (dashed line in Fig. 8 (b), A=0.152 Tesla/K2). The large values of Hc2 are typical for a short Ginzburg-Landau coherence length, , that can be extracted through , where is the flux quantum. For the highest Tc’s in the KxSr1-xFe2As2 system coherence lengths of about 13 Å are thus obtained. The short coherence length in the superconducting state is another indication of the analogy of the FeAs-based superconductors to the high-Tc copper oxides. While the discussion about the pairing symmetry and the structure of the superconducting gap in FeAs superconductors is not yet decided there is increasing evidence for the existence of nodes in the superconducting gap function and two-gap superconductivity with carriers from two bands forming Cooper pairs [30]. A more detailed investigation of the superconducting properties of the FeAs superconductors has to take into account the specifics of the pairing symmetry and the different bands at the Fermi surface.
4 Summary
We have investigated the phase diagram and the normal state transport properties of the superconducting system KxSr1-xFe2As2. The dome-shaped phase diagram of the superconducting state resembles that of the high-Tc cuprates with a maximum of Tc near an optimal doping range. Magnetic order exists on the Sr-rich side and the spin density wave transition is followed by a superconducting transition within a narrow doping range. The Seebeck coefficient shows a distinct anomaly near x=0.3 where the SDW phase arises above the superconducting dome. This anomaly indicates a significant change of the Fermi surface and the possible existence of a quantum critical point is proposed. The most interesting property of the superconducting state is a very high upper critical field estimated from resistivity measurements in magnetic fields. The large values of Hc2(0) imply a short Ginzburg-Landau coherence length, similar to the high-Tc cuprate superconductors.
References
References
- [1] Y. Kamihara, T. Watanabe, M. Hirano and H. Hosono. J. Am. Chem. Soc., 130:3296, 2008.
- [2] G. F. Chen, Z. Li, D. Wu, G. Li, W. Z. Hu, J. Dong, P. Zheng, J. L. Luo and N. L. Wang. Phys. Rev. Lett., 100:247002, 2008.
- [3] X. H. Chen, T. Wu, G. Wu, R. H. Liu, H. Chen and D. F. Fang. Nature, 453:761, 2008.
- [4] H. Takahashi, K. Igawa, K. Arii, Y. Kamihara, M. Hirano and H. Hosono. Nature, 453:376, 2008.
- [5] Z. A. Ren, J. Yang, W. Lu, W. Yi, G. C. Che, X. L. Dong, L. L. Sun, and Z. X. Zhao. Mater. Sci. Innov., 12:1, 2008.
- [6] Z. A. Ren, J. Yang, W. Lu, W. Yi, X. L. Shen, Z. C. Li, G. C. Che, X. L. Dong, L. L. Sun, F. Zhou and Z. X. Zhao. Europhys. Lett., 82:57002, 2008.
- [7] G. F. Chen, Z. Li, D. Wu, J. Dong, G. Li, W. Z. Hu, P. Zheng, J. L. Luo and N. L. Wang. Chin. Phys. Lett., 25:2235, 2008.
- [8] Y. Kohama, Y. Kamihara, M. Hirano, H. Kawaji, T. Atake and H. Hosono. Phys. Rev. B, 78:020512(R), 2008.
- [9] C-H. Lee, T. Ito, A. Iyo, H. Eisaki, H. Kito, M. T. Fernandez-Diaz, K. Kihou, H. Matsuhata, M. Braden and K. Yamada. J. Phys. Soc. Jpn., 77:083704, 2008.
- [10] H. Luetkens, H.-H. Klauss, M. Kraken, F. J. Litterst, T. Dellmann, R. Klingeler, C. Hess, R. Khasanov, A. Amato, V. Baines, J. Hamann-Borrero, N. Leps, A. Kondrat, G. Behr, J. Werner and B. Büchner. arXiv:0806.3533 (unpublished).
- [11] J. Zhao, Q. Huang, C. de la Cruz, S. Li, J. W. Lynn, Y. Chen, M. A. Green, G. F. Chen, G. Li, Z. Li, J. L. Luo, N. L. Wang and P. Dai. Nature Materials, 7:953, 2008.
- [12] Z. A. Ren, G. C. Che, X. L. Dong, J. Yang, W. Lu, W. Yi, X. L. Shen, Z. C. Li, L. L. Sun, F. Zhou and Z. X. Zhao. Europhys. Lett., 83:17002, 2008.
- [13] K. Sasmal, B. Lv, B. Lorenz, A. Guloy, F. Chen, Y. Y. Xue and C. W. Chu. Phys. Rev. Lett., 101:107007, 2008.
- [14] X. C. Wang, Q. Q. Li, Y. X. Lv, W. G. Gao, L. X. Yang, R. C. Yu, F. Y. Li and C. Q. Jin. Solid State Commun., 148:538, 2008.
- [15] M. J. Pitcher, D. R. Parker, P. Adamson, S. J. C. Herkelrath, A. T. Boothroyd and S. J. Clarke. Chem. Commun., 5918, 2008.
- [16] J. H. Tapp, Z. Tang, B. Lv, K. Sasmal, B. Lorenz, P. C. W. Chu and A. M. Guloy. Phys. Rev. B, 78:060505(R), 2008.
- [17] M. Rotter, M. Tegel and D. Johrendt. Phys. Rev. Lett., 101:107006, 2008.
- [18] M. Rotter, M. Prangerl, M. Tegel and D. Johrendt. Angew. Chem. Int. Ed., 47:7949, 2008.
- [19] H. Chen, Y. Ren, Y. Qiu, W. Bao, R. H. Liu, G. Wu, T. Wu, Y. L. Xie, X. F. Wang, Q. Huang and X. H. Chen. arXiv:0807.3950 (unpublished).
- [20] M. Gooch, B. Lv, B. Lorenz, A. M. Guloy and C. W. Chu. Phys. Rev. B, 78:180508(R), 2008.
- [21] C. Krellner, N. Caroca-Canales, A. Jesche, H. Rosner, A. Ormeci and C. Geibel. Phys. Rev. B, 78:100504(R), 2008.
- [22] M. Rotter, M. Tegel, D. Johrendt, I. Schellenberg, W. Hermes and R. Pöttgen. Phys. Rev. B, 78:020503(R), 2008.
- [23] E. S. Choi, J. S. Brooks, J. S. Qualls and Y. S. Song. Rev. Sci. Instr., 72:2392, 2001; F. Chen, J. C. Cooley, W. L. Hults and J. L. Smith. Rev. Sci. Instr., 72:4201, 2001.
- [24] K. Kaneko, A. Hoser, N. Caroca-Canales, A. Jesche, C. Krellner, O. Stockert and C. Geibel. arXiv:0807.2608 (unpublished).
- [25] A. Jesche, N. Caroca-Canales, H. Rosner, H. Borrmann, A. Ormeci, D. Kasinathan, K. Kaneko, H. H. Klauss, H. Luetkens, R. Khasanov, A. Amato, A. Hoser, C. Krellner and C. Geibel. Phys. Rev. B, 78:180504(R), 2008.
- [26] N. F. Mott and H. Jones. Thermoelectricity: An Introduction to the Principles. Wiley, New York, 1962, p. 56.
- [27] G. F. Chen, Z. Li, G. Li, W. Z. Hu, J. Dong, X. D. Zhang, P. Zheng, N. L. Wang and J. L. Luo. Chin. Phys. Lett., 25:3403, 2008.
- [28] D. J. Singh. Phys. Rev. B, 78:094511, 2008.
- [29] H. Liu, W. Zhang, L. Zhao, X. Jia, J. Meng, G. Liu, X. Dong, G. F. Chen, J. L. Luo, N. L. Wang, W. Lu, G. Wang, Y. Zhou, Y. Zhu, X. Wang, Z. Zhao, Z. Xu, C. Chen and X. J. Zhou. Phys. Rev. B, 78:184514, 2008.
- [30] H. Ding, P. Richard, K. Nakayama, T. Sugawara, T. Arakane, Y. Sekiba, A. Takayama, S. Souma, T. Sato, T. Takahashi, Z. Wang, X. Dai, Z. Fang, G. F. Chen, J. L. Luo and N. L. Wang. Europhys. Lett., 83:47001, 2008.