Local structure of (Ga,Fe)N and (Ga,Fe)N:Si investigated by x-ray absorption fine structure spectroscopy
Abstract
X-ray absorption fine-structure (XAFS) measurements supported by ab initio computations within the density functional theory (DFT) are employed to systematically characterize Fe-doped as well as Fe and Si-co-doped films grown by metalorganic vapour phase epitaxy. The analysis of extended-XAFS data shows that depending on the growth conditions, Fe atoms either occupy Ga substitutional sites in GaN or precipitate in the form of -Fe3N nanocrystals, which are ferromagnetic and metallic according to the DFT results. Precipitation can be hampered by reducing the Fe content, or by increasing the growth rate or by co-doping with Si. The near-edge region of the XAFS spectra provides information on the Fe charge state and shows its partial reduction from Fe+3 to Fe+2 upon Si co-doping, in agreement with the Fe electronic configurations expected within various implementations of DFT.
pacs:
61.05.cj, 61.46.Hk, 61.72.uj, 75.50PpI Introduction
It has been realized in the recent years that a palette of nanocharacterization tools has to be employed in order to elucidate the origin of the surprising high-temperature ferromagnetism detected in a number of magnetically doped semiconductors and oxides.Kuroda et al. (2007); Bonanni (2007); Dietl (2007); Chambers et al. (2006); Ando:2008_PRL The application of state-of-the art analytic methods appears to reveal that the distribution of magnetic cations is generally highly non-uniform and that there is an ultimate relationship between the ion arrangement and the magnetic response of the system. In particular, randomly distributed localized spins account for the paramagnetic component of the magnetization, whereas regions with a high local density of magnetic cations are presumably responsible for ferromagnetic features. It has been found that the aggregation of magnetic ions – driven by a substantial contribution of open shells to the bonding – leads either to crystallographic phase separation, ı.e., to the precipitation of a magnetic compound or an elemental ferromagnet, or to the chemical phase separation into alternating regions with higher and lower concentration of magnetic cations, occurring without distorting the crystallographic structure. In the literature on diluted magnetic semiconductors (DMS), this chemical phase separation is commonly referred to as spinodal decomposition,Kuroda et al. (2007); Katayama-Yoshida et al. (2007) independently of its microscopic origin.
There are already experimental indications that the above scenario applies to the case of (Ga,Fe)N fabricated by means of metalorganic vapor phase epitaxy (MOVPE),Bonanni et al. (2007); Pacuski et al. (2008); Bonanni et al. (2008) where – depending on the growth parameters and on the Fe concentration – Fe is either randomly distributed over cation sites or non-uniformly incorporated, showing spinodal decomposition or the presence of precipitates that have been identified as hexagonal Fe3N, according to synchrotron radiation x-ray diffraction (XRD) and high-resolution transmission electron microscopy (HRTEM).Bonanni et al. (2007, 2008) Moreover, by employing these nanocale characterization methods it has been found that the aggregation of Fe cations is largely hampered by co-doping with Si donors or Mg acceptors.Bonanni et al. (2008)
In this work, we present results of x-ray absorption fine structure (XAFS) spectroscopyLee et al. (1981) carried out on (Ga,Fe)N and (Ga,Fe)N:Si samples. XAFS is a well established tool in the study of semiconductor heterostructures and nanostructures Boscherini (2008) and has proven its power as a chemically sensitive local probe for the site identification of Mn/Fe dopants in III-V DMS,Soo et al. (2001a, b, 2004); Bacewicz et al. (2005); D’Acapito et al. (2006) and of Mn-rich nano-columns in Ge.Rovezzi et al. (2008) In the present case it allows us to obtain information on the local atom arrangement in the vicinity of Fe ions as well as on the Fe charge state, depending on the Fe concentration, growth conditions, and co-doping. We then compare the experimentally determined bond lengths to the corresponding values expected from ab initio simulations. This combined experimental and computational effort makes it possible to identify the epitaxial parameters controlling the formation of -Fe3N precipitates in (Ga,Fe)N. However, no presence of bonds specific to -Fe3N has been detected in the (Ga,Fe)N films co-doped with Si. This finding provides a strong corroboration of the previous theoretical suggestionsDietl (2006) and experimental observationsBonanni et al. (2008) indicating that the alteration of the magnetic ions valence by shallow impurities can hinder their aggregation and, therefore, extend the solubility range.
Our paper is organized as follows. In Sec. II.1 we present the relevant characteristics of the studied samples and we briefly recall the employed growth and doping procedures. The XAFS method and the analysis of both the Extended (EXAFS) and Near-Edge (XANES) regions of collected spectra are described in Sec. II.2. The employed ab initio computation scheme are summarized in Sec. II.3 for the case of wurtzite (Ga,Fe)N and -Fe3N. Section III contains an interpretation of the experimentally determined values of the bond lengths in the light of the theoretical results. As discussed in Sec. IV, this insight allows to quantify the relative concentration of Fe in the -Fe3N precipitates depending on the growth conditions and co-doping with Si. The main conclusions and outlook of our work are summarized in Sec. V.
II Experimental
II.1 Samples production
The (Ga,Fe)N and (Ga,Fe)N:Si epilayers considered here are fabricated by MOVPE on -plane sapphire substrates following the growth procedures and applying the in situ and ex situ characterization methods we have formerly reported for (Ga,Fe)N.Bonanni et al. (2007) The total Fe concentration in the samples ranges from 41019 cm-3 to 31020 cm-3 for a Fe-precursor (Cp2Fe) flow-rate from 50 to 350 standard cubic centimeters per minute (sccm).Bonanni et al. (2007) In the Si-doped (Ga,Fe)N structures the Si-content is estimated to be 11019 cm-3. The growth-rate during deposition is regulated by the Ga-precursor (TMGa) flow-rate and varies from 0.08 nm/s for 5 sccm to 0.3 nm/s for 12 sccm of TMGa flow.
II.2 Experiments and data analysis
The XAFS measurements at the Fe-K edge (7112 eV) are carried out at the “GILDA” Italian collaborating research group beamline (BM08) at the European Synchrotron Radiation Facility in Grenoble.D’Acapito et al. (1998) The monochromator is equipped with a pair of Si(111) crystals and run in dynamical focusing mode.Pascarelli et al. (1996) Harmonics rejection is achieved by using a pair of Pd-coated mirrors with an estimated cutoff of 18 keV. Data are collected in the fluorescence mode (normal geometry) using a 13-element hyper pure Ge detector and normalized by measuring the incident beam with an ion chamber filled with nitrogen gas. In order to minimize the effects of coherent scattering from the substrate, the samples are mounted on a vibrating sample holderTullio et al. (2001) and measurements are carried out at liquid nitrogen temperature to reduce thermal disorder. For each sample the integration time for each energy point and the number of acquired spectra are chosen in order to collect counts on the final averaged spectrum. In addition, before and after each measurement a metallic Fe reference foil is measured in transmission mode to check the stability of the energy scale and to provide an accurate calibration. In this way we locate at 7112.0 eV the first inflection point of the absorption spectrum.Bearden and Burr (1967)
The EXAFS signal - - is extracted from the absorption raw data - - with the viper programKlementev (2001) employing a smoothing spline algorithm and choosing the energy edge value () at the maximum derivative. The quantitative analysis is carried out with the ifeffit-artemis programsNewville (2001); Ravel and Newville (2005) with the atomic models described below. Theoretical EXAFS signals are computed with the feff8.4 codeAnkudinov et al. (1998) using muffin tin potentials and the Hedin-Lunqvist approximation for their energy-dependent part. The free fitting parameters used in the analysis are: (common amplitude parameter), (the refinement of the edge position), and , the interatomic distance and the Debye-Waller factor for the atomic shell around Fe respectively. In addition, a linear combination parameter () is fitted when two theoretical models are used in the same fit. The fits are carried out in the Fourier-transformed space (R space) in the range [1.3 – 3.5] Å from the -weighted EXAFS data in the range [2.5 – 10.5] Å-1 using Hanning windows with slope parameter and , for the forward and backward Fourier transforms, respectively. In order to reduce the variables used in the fit and keep the theoretical models coherent for all samples, the fits are limited to Å. In fact, the substitutional site in the wurtzite lattice can be reduced to two average distances of Fe–N and Fe–Ga and for -Fe3N to the two average distances Fe–N and Fe–Fe. In addition, for simplicity, only one average Fe–N distance is reported in the text. On the other hand, for samples that present only the substitutional phase it is possible to expand the model to upper distances including multiple scattering (MS) contributions (as pointed out, for example, in the Wurtzite phase analysis section of Ref. Decremps et al., 2003) but the results are found to be equivalent. In the case of mixed phases, the expansion to longer distances and MS paths, reduces considerably the overall quality of the fits due to the lack of a model compound for -Fe3N.
The XANES spectra are normalized using the athena program,Ravel and Newville (2005) setting the edge jump value to unity. The peaks appearing in the energy region before the edge are analyzed with the fityk programWojdyr to a curve consisting in an arctangent backgroundNot (a) plus one or two pseudo-Voigt peaks.Galoisy et al. (2001); Westre et al. (1997)
II.3 Theoretical methods
The properties of a Fe atom substituting a Ga atom in GaN (FeGa) as well as of the -Fe3N hexagonal phase are investigated by density functional theory (DFT) methods by using both the local spin density - generalized gradient approximation (LSD-GGA)Perdew et al. (1996) and the LSD-GGA+U formalismAnisimov et al. (1997) as implemented with plane wave basis sets in quantum-espresso,Cococcioni and de Gironcoli (2005); Kulik et al. (2006); Giannozzi et al. in order to take into account the strong localization of the states of Fe, poorly described by LSD-GGA exchange-correlation functionals. Total energies are calculated in a supercell approach, by using ultrasoft pseudopotentialsVanderbilt (1990) planewave basis sets, the special-points technique for k-space integration, and the Perdew-Burke-Ernzerhof (PBE) exchange-correlation functional.Perdew et al. (1996)
In detail, for FeGa the (1,1,1) k-point Monkhorst-Pack mesh for a 72-atoms wurtzite supercell of GaN (corresponding to 3x3x2 unit cells), a gaussian smearing of the occupation numbers and plane waves cutoffs of 25 Ry for wavefunctions and 150 Ry for densities are used. The electronic channels considered in the atomic pseudopotentials are and for N, , , , , for Fe, and , , for Ga. One substitutional Fe atom is included in the 72-atoms supercell of GaN. A neutralizing background charge is imposed when dealing with charged states of FeGa. Geometry optimizations are performed by fully relaxing the positions of all the supercell atoms by minimizing the atomic forces. The spin state of the system is self-consistently determined during the wavefunction optimization. The position of electronic levels induced by the Fe impurity in the GaN energy gap is estimated by calculating the corresponding transition energy levels , that is, the Fermi-energy values for which the charge of the defect changes from to ; this gives the position of the Fermi energy (EF) with respect to the top of the valence band. These values are estimated from total energies (defect formation energies) as described in Refs. Bonapasta et al., 2003; de Walle and Neugebauer, 2004, where further details on the theoretical methods can be found. Transition energy values have to be located with respect to the GaN energy gap estimated here by the transition level relative to bulk GaN, thus permitting to compare defect transition levels with an energy gap calculated in a consistent way.Amore Bonapasta et al. (2004) Kohn-Sham electronic eigenvalues at the point and electronic density of states (DOS) have been also considered when discussing the electronic properties of the FeGa impurity.
In the case of -Fe3N, the starting point of the calculations is the hexagonal phase as found in literature on the nitridation process of Fe.Jack (1952); Jacobs et al. (1995) The space group is P6322 (No. 182) with the unit cell composed of 6 Fe atoms in the Wickoff site 6g [(, 0, 0); (0, , 0); (-, -, 0); (-, 0, 1/2); (0, -, 1/2); (, , 1/2)] where = 0.333 and 2 N in site 2c [(1/3, 2/3, 1/4); (2/3, 1/3, 3/4)], that is, iron atoms show the motif of a slightly distorted hexagonal close packing (hcp) structure and nitrogen atoms occupy only corner-sharing octahedra (Fig. 7 in Ref. Jacobs et al., 1995). Satisfactorily convergent results are achieved by using the (12,12,8) k-point Monkhorst-Pack mesh, plane waves cutoffs of 35 Ry for wavefunctions and 140 Ry for densities.
III Results
| Cp2Fe | TMGa | Fe–N | Fe–Fe | Fe–Ga | ||||
| (sccm) | (sccm) | (Å) | (Å-2) | (Å) | (Å-2) | (Å) | (Å-2) | (%) |
| A. (Ga,Fe)N as a function of Fe flow-rate | ||||||||
| 150 | 5 | 2.02(1) | 6(2) | — | — | 3.18(1) | 6(2) | 100(10) |
| 200 | 5 | 1.98(1) | 7(1) | 2.71(3) | 19(5) | 3.19(1) | 7(1) | 70(10) |
| 250 | 5 | 1.98(1) | 7(1) | 2.70(3) | 22(5) | 3.19(1) | 7(1) | 70(10) |
| 300 | 5 | 2.01(2) | 8(1) | 2.74(3) | 21(2) | 3.21(2) | 8(1) | 50(10) |
| 350 | 5 | 2.02(3) | 7(2) | 2.75(4) | 21(2) | 3.22(2) | 7(2) | 40(10) |
| B. (Ga,Fe)N as a function of Ga flow-rate | ||||||||
| 300 | 5 | 2.01(1) | 9(1) | 2.75(2) | 28(2) | 3.23(1) | 9(1) | 50(10) |
| 300 | 8 | 1.98(2) | 12(4) | — | — | 3.19(1) | 9(1) | 100(10) |
| 300 | 10 | 1.97(1) | 8(3) | — | — | 3.19(1) | 7(1) | 100(10) |
| 300 | 12 | 1.97(1) | 13(5) | — | — | 3.19(1) | 8(1) | 100(10) |
| C. (Ga,Fe)N:Si | ||||||||
| 300 | 5 | 1.99(2) | 13(3) | — | — | 3.19(1) | 9(1) | 100(10) |
| 300 | 10 | 1.98(2) | 9(2) | — | — | 3.18(1) | 7(1) | 100(10) |
| 250 | 10 | 1.99(2) | 14(3) | — | — | 3.18(1) | 8(1) | 100(10) |
| 100 | 10 | 2.01(3) | 11(4) | — | — | 3.19(1) | 9(1) | 100(10) |
| D. Crystallographic | ||||||||
| -Fe3N Jacobs et al. (1995) | 1.927(1) | 2.703(2) | — | — | ||||
| -Fe Swanson and Tatge (1955) | — | 2.499/2.886 | — | — | ||||
| GaN Schulz and Thiemann (1977) | 1.95 | — | 3.18 | — | ||||
| E. DFT | ||||||||
| -Fe3N | 1.89(1) | 2.67(1) | — | — | ||||
| Fe | 1.97(1) | — | 3.23(1) | — | ||||
| Fe | 1.99(1) | — | 3.22(1) | — | ||||
| Fe | 2.05(1) | — | 3.21(1) | — | ||||
III.1 Solubility limit as a function of Fe content
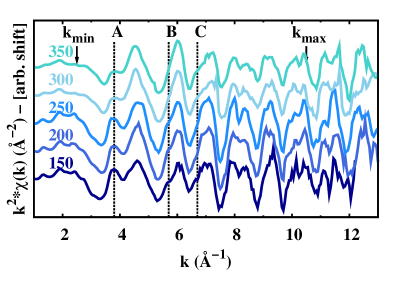
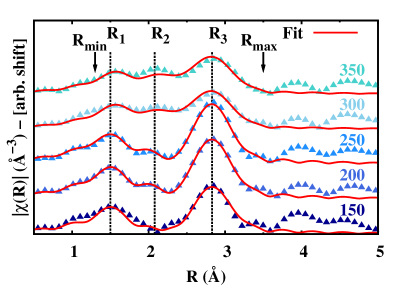
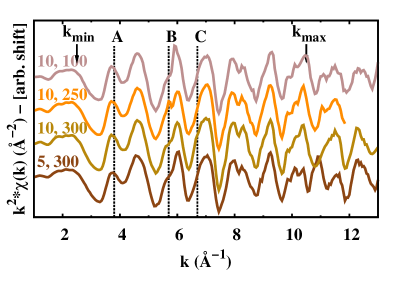
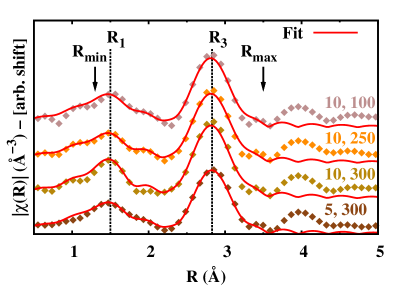
The first series systematically studied consists of samples prepared each with different Fe content (Cp2Fe from 150 to 350 sccm) at a fixed growth-rate (TMGa = 5 sccm). The recent investigation by HRTEM Li et al. (2008) shows on this series a solubility limit at 200 sccm at our growth conditions. This means that after this limit precipitates appear mostly as -Fe3N and only at the surface of selected samples as -Fe. In Fig. 1 are plotted the -weighted EXAFS data where qualitative differences are clearly visible and are highlighted by the peaks A, B and C. In particular, three different spectra are visible: for 150 sccm, for 200 and 250 sccm, for 300 and 350 scmm. This difference is also found in the Fourier transformed (FT) spectra shown in Fig. 2 where, in the range –, from a two-peaks situation ( and ) at 150 sccm, an intermediate third peak () appears and increases in amplitude with increasing Fe content.
In the quantitative fit, the data at 150 sccm can be reproduced with a two shell model consisting in a Fe–N () and Fe–Ga () shells. The intermediate peak () is obtained with a Fe–Fe shell. The numerical results are shown in Table 1A.
III.2 Fe incorporation dependence on growth rate
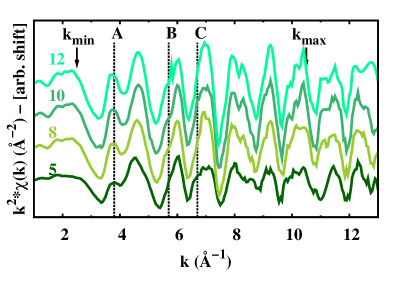
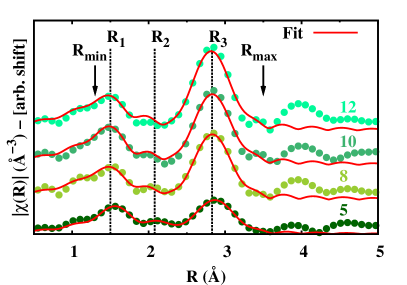
The second series studied permits to investigate how the Fe incorporation changes with the growth rate. In fact, by fixing the Fe content at 300 sccm (ı.e., well above the solubility limit estimated to be about 200 sccm), the TMGa flow-rate is increased from 5 to 12 sccm through the samples series. The EXAFS spectra for this series are shown in Fig. 3 and their respective FTs in Fig. 4. From a qualitative point of view we note that for high growth rate values (TMGa sccm) the EXAFS signal consists in two main frequencies (relative to the distances and in the FT) whereas in samples grown below that limit a further phase is detected and revealed by the peak . Also in this case the quantitative analysis is conducted by reproducing data either with a substitutional model or with a combination of substitutional plus -Fe3N phase. The results are reported in Table 1B.
III.3 Si co-doping
Finally, the effect of co-doping with Si is investigated in a samples series with variable TMGa and Cp2Fe. EXAFS spectra as a function of both TMGa and Cp2Fe are reported in Fig. 5 with their relative FTs in Fig. 6. By considering the same part of the spectra highlighted in the previous two series, it is visible in this case that no differences emerge between spectra Not (c) and all present a typical FeGa signal. The Fe full inclusion in substitutional sites is confirmed by the quantitative analysis reported in Table 1C.
III.4 Fe charge state
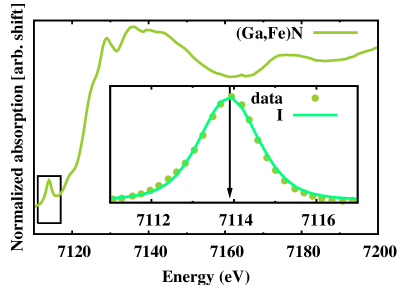
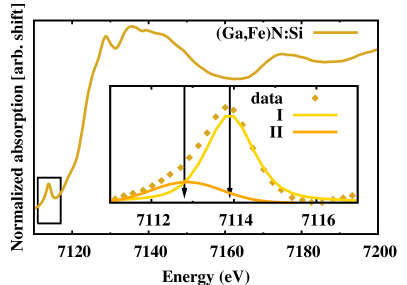
In order to get information on the charge state of Fe in the studied samples, the near-edge region of the absorption spectra (XANES) is analyzed. The amplitude and position of the peaks due to the partially forbidden transitions appearing in the pre-edge region of the absorption coefficient were widely investigated in literature as a function of the local symmetry (tetrahedral or octahedral) and valence state (Fe3+ or Fe2+) in Fe compounds.Galoisy et al. (2001); Westre et al. (1997) The general finding was that tetrahedrally coordinated compounds exhibit a single pre-edge peak with an amplitude above 10 % of the total edge jump and a position changing with the valence state from eV in the case of Fe2+ to eV in the case of Fe3+.Galoisy et al. (2001)
Here we present a systematic extension of a previous investigation.Bonanni et al. (2008) Quantitative results are reported in Table 2 and two representative fits are plotted in Fig. 7; undoped samples exhibit only a single peak of average amplitude % and positon eV whereas the doped samples present the same peak at eV with a slightly lower average amplitude of % and a further peak at eV of amplitude %. These data are explained by the presence of Fe3+ ions in the first series and a co-existence of Fe3+ and Fe2+ ions in the second case. The appearance of double peaks in the pre-edge region in case of co-existence of chemical species at different valence states was already pointed out in literature Giuli et al. (2002); Westre et al. (1997) and in our case evidences the partial reduction of the metal ions (Fe3+ Fe2+) upon Si addition.
| Cp2Fe | TMGa | peak I | peak II | ||
|---|---|---|---|---|---|
| center | height | center | height | ||
| (sccm) | (sccm) | (eV) | (%) | (eV) | (%) |
| (Ga,Fe)N | |||||
| 300 | 5 | 7113.8(1) | 8(1) | — | — |
| 300 | 8 | 7113.9(1) | 12(1) | — | — |
| 300 | 10 | 7113.9(1) | 14(1) | — | — |
| 300 | 12 | 7113.9(1) | 17(1) | — | — |
| (Ga,Fe)N:Si | |||||
| 300 | 5 | 7113.9(1) | 10(1) | 7112.9(1) | 2(1) |
| 300 | 10 | 7113.9(1) | 11(1) | 7112.9(1) | 3(1) |
| 250 | 10 | 7113.9(1) | 11(1) | 7112.7(1) | 3(1) |
| 100 | 10 | 7113.8(1) | 9(1) | 7112.5(1) | 4(1) |
III.5 Theoretical results
III.5.1 Substitutional Fe in GaN
The local structure of a FeGa in GaN is investigated through geometry optimization procedures both in the LSD and LSD+U frameworks. The estimated lattice constants of the 72-atoms supercell are = 9.66 Å, = 10.49 Å. Details of the atomic geometries produced by the (more reliable) LSD+U calculations are given in Table 1E for the charge states 0, +1 and -1 of FeGa, which correspond to the Fe, Fe and Fe forms of the impurity, respectively. Present results show that the FeGa-N bond distances for the -1 (+1) state are slightly longer (almost the same) with respect to those of the neutral state. Moreover, no significant differences are found between the FeGa-Ga distances estimated for the above three charge states of FeGa. A quite similar picture is provided by the LSD calculations.
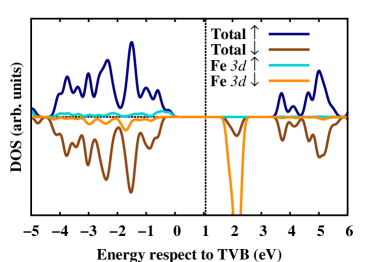
Regarding the electronic properties of FeGa, total spin DOS and spin DOS projected on the Fe atomic orbitals as given by the LSD+U calculations for the neutral state of the impurity are reported in Fig. 8 together with the calculated Fermi energy. These DOS have to be considered together with an estimate of 1.7 eV given by the Kohn-Sham electronic eigenvalues for the GaN energy gap (). Then, Fig. 8 shows that occupied electronic states induced by the substitutional Fe are mixed with GaN states at the top of the valence band (TVB), whereas unoccupied Fe states are resonant with the conduction band. A more reliable estimate of the location of the levels induced by a FeGa in the GaN energy gap is achieved by calculating the corresponding transition level where the Fe impurity changes its charge state from 0 to -1. The present evaluation of the level is 2.25 eV to be compared with a calculated of 2.93 eV. These results favorably compare with experimental results locating the Fe acceptor level at 2.86 eV,Malguth et al. (2006) on a band gap of 3.50 eV for wz-GaN at 0 K.Monemar (1974) It can be noted that an even better agreement with the experiment could be reached by assuming a linear scaling of with the energy gap. In this case, indeed, a value of 2.70 eV for the Fe level would correspond to the experimental energy gap.
The present results agree with a deep acceptor character of FeGa. They seem also to rule out a possible donor behavior of FeGa. In Fig. 8 it is shown indeed that there are no occupied Fe states in the GaN energy gap. Moreover, a value of eV has been estimated for the transition level indicating that a Fe3+/4+ donor level of FeGa would be resonant with the valence band. In agreement with this conclusion no such state has been found experimentally in the band gap of GaN:Fe.Malguth et al. (2008) However, the present ab initio findings do not rule out a possibility that the Fe impurity in GaN gives rise to a charge transfer state, Fe, acting as a hole trap, as postulated by some of us.Pacuski et al. (2008); Dietl (2008a)
The results of the present calculations permit also to asses estimate a change in the formation energies of FeGa in different charge states () as a function of the Fermi energy EF. For instance, for the magnitude of -, we estimate +0.40 eV and -1.35 eV for EF equal to and , respectively (in this case we use the experimental value of the energy gap ). This indicates that the formation of Fe is promoted in intrinsic GaN, while Fe is favored in the -doped material. On the contrary, the value of - is evaluated as +0.10 eV and +1.85 eV for the Fermi level at the top of the valence band and in the middle of the energy gap, respectively, that is, a donor behavior of Fe (corresponding to the formation of Fe) is never favored.
III.5.2 -Fe3N
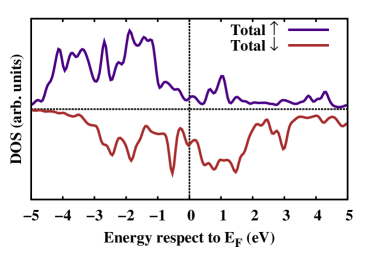
The cell parameters have been calculated by minimizing the total energy of the system. Optimal values have been found at the zero value of linear fits of the total stress, corresponding to the minimum of the total energy. Such a procedure gives = 4.64 Å and = 4.34 Å, that is 2% contraction of the experimental values = 4.7209(6) Å and = 4.4188(9) Å; this being a typical effect of the LSD approximation. The relaxation properly reproduces the experimental value of that is a 0.009 contraction from the 1/3 ideal value of for Fe in the hcp structure. The resulting atomic distances reported in Table 1E are slightly different from the crystallographic onesJacobs et al. (1995) (Table 1D). The above structural minimization corresponds to a magnetization of 2.2 /atom, in agreement with the experimental value found from neutron diffraction at 4.2 K.Leineweber et al. (1999) Finally, the total DOS shown in Fig. 9 gives a clear evidence of the metallic behavior of this system. These results are achieved by LSD calculations; the LSD+U scheme is also tested with different U values in the range 2–5 eV and no appreciable difference are found between the LSD and LSD+U results.
IV Discussion
IV.1 EXAFS
In the first series presented in this study the sample with a lower Fe content exhibits two coordination shells around Fe. These shells are identified as Fe–N end Fe–Ga contributions and the observed bond length values are in agreement with those calculated via DFT for a Fe ion in a Ga-substitutional site. Thus, we conclude that Fe substitutes Ga, as previously suggested by a qualitative analysis of EXAFS data.Kumagai et al. (2006) The closeness of the theoretical estimates of the Fe–N distances reported in Table 1E makes it difficult to exploit the FeGa local geometry to distinguish between its possible, different charge states. However, the theoretical results support a deep acceptor character of FeGa and locate the corresponding electronic level in the upper half of the GaN energy gap. Accordingly, the formation energy is 0.40 eV lower in energy than in intrinsic GaN, thus suggesting the presence of FeGa in the neutral state.
For samples grown with higher Fe content an additional shell appears, matching a coordination at Å. This value coincides with the experimental and calculated Fe–Fe second shell distance in -Fe3N. This suggests that Fe participates in the form of -Fe3N. It is worth noting that in this compound the first shell corresponds to the Fe–N bonds exhibiting the same structural parameters (length and number of neighbors) as those specific to Ga-substitutional Fe in GaN. These results provide an independent confirmation of our previous studies on (Ga,Fe)N,Bonanni et al. (2007); Li et al. (2008) according to which Fe-rich nanocrystals were evidenced by neither HRTEM nor HRXRD and a paramagnetic response was observed by SQUID in samples with a low-Fe content, whereas samples with a high Fe content showed the presence of Fe-rich nanocrystals and a ferromagnetic behavior.
From a reduction in the amplitude of the dominating Fe–Ga signal relative to the pure substitutional specimen it is possible to estimate the relative content of Fe in the two phases (GaN and -Fe3N), as shown in Table 1. From these data we infer that the flow-rate of 200 sccm Cp2Fe corresponds to the onset of -Fe3N precipitation at our growth conditions, though the spinodal decomposition, that is the aggregation of Fe cations without crystallographic phase separation may begin at lower Fe contents. Significantly, no presence of -Fe3N is detected in samples co-doped with Si.
It is worth to underline that no evidence is found for the -Fe phase that should be witnessed by a double Fe–Fe shell at 2.499 and 2.886 Å.Swanson and Tatge (1955) Actually, this phase was shown to be present only at the surface of samples grown under particular conditionsLi et al. (2008) and the overall Fe fraction in this phase presumably lies below the detection limit of EXAFS (about 15% in the present case).
We also observe that our data do not point to the presence of Fe in interstitial sites, at least in samples containing no secondary phases, for which the EXAFS signal is completely reproduced by a simple substitutional model. In the case of samples with precipitates, their contribution could a priori mask a signal coming from interstitials. This is in contrast to the case of (Ga,Mn)As where evidence for Mn interstitials has been found in EXAFS studies.Bacewicz et al. (2005); D’Acapito et al. (2006)
Turning to samples deposited at different growth rates we note that if the Fe content exceeds the previously determined solubility limit, we find again the presence of -Fe3N nanocrystals in the film grown at the lowest rate (TMGa = 5 sccm). For faster growth rates, however, the EXAFS spectra correspond exclusively to substitutional FeGa in GaN, emphasizing the effectiveness of the fast growth in suppressing the formation of segregated phases. This observation is in qualitative agreement with the previous study,Navarro-Quezada et al. (2008) where HRTEM carried out for samples grown at low and high rates (although at a noticeably higher Fe content) revealed the formation of -Fe3N only for slowly grown specimens.
IV.2 XANES
The XANES spectral region is characterized by the presence of a single pre-edge peak at about 7114 eV in all samples grown without Si. In agreement with the literature dataGaloisy et al. (2001); Westre et al. (1997); Giuli et al. (2002) this reveals that Fe assumes the Fe3+ charge state in a tetrahedral environment, and this result corroborates the conclusions derived from previous electron paramagnetic resonance studiesBonanni et al. (2007); Malguth et al. (2008) and from the present DFT calculation for (Ga,Fe)N. Co-doping with Si results in the appearance of an additional peak in the pre-edge region at about 7112.8 eV, which is attributed to Fe2+ ions in a tetrahedral environment, as already pointed out in our prior work.Bonanni et al. (2008) The fraction of the total Fe content in this particular valence state is below 20 %, the majority of Fe impurities still remaining in the Fe3+ configuration. This explains why we do not observe in the EXAFS data (and, in particular, in the values of the Fe–N bond length) any significant deviation when comparing the samples containing no Si impurities with the Si-doped ones. However, the co-deposition of Si hampers the aggregation of Fe and, thus, shifts the solubility limit to higher Fe concentrations.
The above interpretation of the XANES findings is consistent with the ab initio results, implying that the Fe2+/Fe3+ state, i.e. the level, resides in the GaN gap 2.25 eV above the top of the valence band. Thus, this state should be occupied by electrons provided by shallow donors, such as Si. This conclusion is further supported by the computed formation energy that results to be for the Fe3+ configuration by 1.35 eV higher than for the Fe2+ case.
V Conclusions and outlook
The present EXAFS results, together with previous HRTEM, electron dispersive spectroscopy, and synchrotron XRD,Bonanni et al. (2008) show how the Fe incorporation can be efficiently controlled by Fe flow, growth rate, and co-doping with Si. In particular, the aggregation of Fe cations can be minimized by increasing the growth rate and by co-doping with Si, shifting the solubility limit towards higher Fe content at given growth conditions. While there is agreement between the present DFT computations and both the previously Bonanni et al. (2007); Malguth et al. (2008) and here observed Fe charge state, including its evolution with the Si concentration, a detailed understanding of how co-doping and other growth parameters affect the aggregation of Fe ions awaits for a comprehensive theoretical treatment.
A strict correlation between magnetic properties and the presence of Fe-rich nanocrystals Bonanni et al. (2007, 2008) strongly suggests that the surprisingly robust ferromagnetism of (Ga,Fe)N as well as of other diluted magnetic semiconductors and oxides deposited under specific growth conditions results from the self-organized assembly of magnetic nanocrystals, whose high blocking temperatures account for the survival of ferromagnetic features at high temperatures. This emerging insight provides a promising starting point for exploiting a number of expected functionalities of these nanocomposite semiconductor/ferromagnetic metal systems.Katayama-Yoshida et al. (2007); Dietl (2008b).
VI Acknowledgements
We acknowledge the European Synchrotron Radiation Facility and the Italian Collaborating Research Group for the provision of the synchrotron radiation facilities. GILDA is a project jointly financed by CNR and INFN. M. R. is indebted to Piotr Bogusławski and Paweł Jakubas for valuable discussions during his visit in Warsaw and to CNR for financial support by the Short Term Mobility 2008 program (N.0002372). We also acknowledge Federico Boscherini for fruitful discussions. This work has been partly supported by the Austrian Fonds zur Förderung der wissenschaftlichen Forschung (P18942, P20065 and N107-NAN), by the ESF FoNe project SPINTRA (ERAS-CT-2003-980409), and by the FunDMS Advanced Grant within the European Research Council “Ideas” Programme of EC 7FP.
References
- Kuroda et al. (2007) S. Kuroda, N. Nishizawa, K. Takita, M. Mitome, Y. Bando, K. Osuch, and T. Dietl, Nat. Mater. 6, 440 (2007).
- Chambers et al. (2006) S. Chambers, T. Droubay, C. Wang, K. Rosso, S. Heald, D. Schwartz, K. Kittilstved, and D. Gamelin, Materials Today 9, 28 (2006).
- Kobayashi et al. (2008) M. Kobayashi, Y. Ishida, J. I. Hwang, G. S. Song, A. Fujimori, C. S. Yang, L. Lee, H.-J. Lin, D. J. Huang, C. T. Chen, et al., New J. Phys. 10, 055011 (2008).
- Bonanni (2007) A. Bonanni, Semicond. Sci. Technol. 22, R41 (2007), and references therein.
- Dietl (2007) T. Dietl, J. Phys.: Condens. Matter 19, 165204 (2007).
- Katayama-Yoshida et al. (2007) H. Katayama-Yoshida, K. Sato, T. Fukushima, M. Toyoda, H. Kizaki, V. A. Dinh, and P. H. Dederichs, Phys. Status Solidi A 204, 15 (2007).
- Bonanni et al. (2007) A. Bonanni, M. Kiecana, C. Simbrunner, T. Li, M. Sawicki, M. Wegscheider, M. Quast, H. Przybylinska, A. Navarro-Quezada, R. Jakiela, et al., Phys. Rev. B 75, 125210 (2007).
- Pacuski et al. (2008) W. Pacuski, P. Kossacki, D. Ferrand, A. Golnik, J. Cibert, M. Wegscheider, A. Navarro-Quezada, A. Bonanni, M. Kiecana, M. Sawicki, et al., Phys. Rev. Lett. 100, 037204 (2008).
- Bonanni et al. (2008) A. Bonanni, A. Navarro-Quezada, T. Li, M. Wegscheider, Z. Matej, V. Holy, R. T. Lechner, G. Bauer, M. Rovezzi, F. D’Acapito, et al., Phys. Rev. Lett. 101, 135502 (2008).
- Lee et al. (1981) P. A. Lee, P. H. Citrin, P. Eisenberger, and B. M. Kincaid, Rev. Mod. Phys. 53, 769 (1981).
- Boscherini (2008) F. Boscherini, X-ray absorption fine structure in the study of semiconductor heterostructures and nanostructures (Elsevier, 2008), chap. 9, p. 289.
- Soo et al. (2001a) Y. L. Soo, G. Kioseoglou, S. Huang, S. Kim, Y. H. Kao, Y. Takatani, S. Haneda, and H. Munekata, J. Synchrotron Rad. 8, 874 (2001a).
- Soo et al. (2001b) Y. L. Soo, G. Kioseoglou, S. Kim, S. Huang, Y. H. Kao, S. Kuwabara, S. Owa, T. Kondo, and H. Munekata, Appl. Phys. Lett. 79, 3926 (2001b).
- Soo et al. (2004) Y. L. Soo, S. Kim, Y. H. Kao, A. J. Blattner, B. W. Wessels, S. Khalid, C. S. Hanke, and C.-C. Kao, Appl. Phys. Lett. 84, 481 (2004).
- D’Acapito et al. (2006) F. D’Acapito, G. Smolentsev, F. Boscherini, M. Piccin, G. Bais, S. Rubini, F. Martelli, and A. Franciosi, Phys. Rev. B 73, 035314 (2006).
- Bacewicz et al. (2005) R. Bacewicz, A. Twaróg, A. Malinowska, T. Wojtowicz, X. Liu, and J. Furdyna, J. Phys. Chem. Solids 66, 2004 (2005).
- Rovezzi et al. (2008) M. Rovezzi, T. Devillers, E. Arras, F. d’Acapito, A. Barski, M. Jamet, and P. Pochet, Appl. Phys. Lett. 92, 242510 (2008).
- Dietl (2006) T. Dietl, Nat. Mater. 5, 673 (2006).
- D’Acapito et al. (1998) F. D’Acapito, S. Colonna, S. Pascarelli, G. Antonioli, A. Balerna, A. Bazzini, F. Boscherini, F. Campolungo, G. Chini, G. Dalba, et al., ESRF Newsletter 30, 42 (1998).
- Pascarelli et al. (1996) S. Pascarelli, F. Boscherini, F. D’Acapito, J. Hrdy, C. Meneghini, and S. Mobilio, J. Synchrotron Rad. 3, 147 (1996).
- Tullio et al. (2001) V. Tullio, F. D’Anca, F. Campolungo, F. D’Acapito, F. Boscherini, and S. Mobilio, Internal note, LNF-INFN (2001).
- Bearden and Burr (1967) J. A. Bearden and A. F. Burr, Rev. Mod. Phys. 39, 125 (1967).
- Klementev (2001) K. V. Klementev, J. Phys. D: Appl. Phys. 34, 209 (2001).
- Newville (2001) M. Newville, J. Synchrotron Rad. 8, 322 (2001).
- Ravel and Newville (2005) B. Ravel and M. Newville, J. Synchrotron Rad. 12, 537 (2005).
- Ankudinov et al. (1998) A. L. Ankudinov, B. Ravel, J. J. Rehr, and S. D. Conradson, Phys. Rev. B 58, 7565 (1998).
- Decremps et al. (2003) F. Decremps, F. Datchi, A. M. Saitta, A. Polian, S. Pascarelli, A. Di Cicco, J. P. Itié, and F. Baudelet, Phys. Rev. B 68, 104101 (2003).
- (28) M. Wojdyr, see http://www.unipress.waw.pl/fityk/.
- Not (a) The function has been parametrized as: , where , , , are fitted with a Levenberg-Marquardt algorithm.
- Galoisy et al. (2001) L. Galoisy, G. Calas, and M. A. Arrio, Chem. Geol. 174, 307 (2001).
- Westre et al. (1997) T. E. Westre, P. Kennepohl, J. G. DeWitt, B. Hedman, K. O. Hodgson, and E. I. Solomon, J. Am. Chem. Soc. 119, 6297 (1997).
- Perdew et al. (1996) J. P. Perdew, K. Burke, and M. Ernzerhof, Phys. Rev. Lett. 77, 3865 (1996).
- Anisimov et al. (1997) V. I. Anisimov, F. Aryasetiawan, and A. I. Lichtenstein, J. Phys.: Condens. Matter 9, 767 (1997).
- Cococcioni and de Gironcoli (2005) M. Cococcioni and S. de Gironcoli, Phys. Rev. B 71, 035105 (2005).
- Kulik et al. (2006) H. J. Kulik, M. Cococcioni, D. A. Scherlis, and N. Marzari, Phys. Rev. Lett. 97, 103001 (2006).
- (36) P. Giannozzi, S. Baroni, A. D. Corso, S. de Gironcoli, C. Cavazzoni, G. Ballabio, S. Scandolo, G. Chiarotti, P. Focher, A. Pasquarello, et al., see http://www.quantum-espresso.org.
- Vanderbilt (1990) D. Vanderbilt, Phys. Rev. B 41, 7892 (1990).
- Bonapasta et al. (2003) A. A. Bonapasta, F. Filippone, and P. Giannozzi, Phys. Rev. B 68, 115202 (2003).
- de Walle and Neugebauer (2004) C. G. V. de Walle and J. Neugebauer, J. Appl. Phys. 95, 3851 (2004).
- Amore Bonapasta et al. (2004) A. Amore Bonapasta, F. Filippone, and P. Giannozzi, Phys. Rev. B 69, 115207 (2004).
- Jack (1952) K. H. Jack, Acta Crystallographica 5, 404 (1952).
- Jacobs et al. (1995) H. Jacobs, D. Rechenbach, and U. Zachwieja, J. Alloys Compd. 227, 10 (1995).
- Not (b) For XAFS results, the error bars are the diagonal elements of the covariance matrix evaluated during the fit and rescaled by the square root of the reduced . For the DFT method, they are the resulting variance of convergence tests.
- Swanson and Tatge (1955) H. Swanson and E. Tatge, National Bureau of Standards 539, 1 (1955).
- Schulz and Thiemann (1977) H. Schulz and K. H. Thiemann, Solid State Commun. 23, 815 (1977).
- Li et al. (2008) T. Li, C. Simbrunner, A. Navarro-Quezada, M. Wegscheider, M. Quast, D. Litvinov, D. Gerthsen, and A. Bonanni, J. Cryst. Growth 310, 3294 (2008).
- Not (c) The spectrum (5,300) presents a peak at k = 11 Å-1 that is unphysical. It is due to a distorsion by diffraction effects (as discussed in the experimental section) and a consequent wrong background removal.
- Giuli et al. (2002) G. Giuli, G. Pratesi, C. Cipriani, and E. Paris, Geochim. Cosmochim. Acta 66, 4347 (2002).
- Malguth et al. (2006) E. Malguth, A. Hoffmann, W. Gehlhoff, O. Gelhausen, M. R. Phillips, and X. Xu, Phys. Rev. B 74, 165202 (2006).
- Monemar (1974) B. Monemar, Phys. Rev. B 10, 676 (1974).
- Malguth et al. (2008) E. Malguth, A. Hoffmann, and M. R. Phillips, Phys. Status Solidi B 245, 455 (2008).
- Dietl (2008a) T. Dietl, Phys. Rev. B 77, 085208 (2008a).
- Leineweber et al. (1999) A. Leineweber, H. Jacobs, F. Huning, H. Lueken, H. Schilder, and W. Kockelmann, J. Alloys Compd. 288, 79 (1999).
- Kumagai et al. (2006) Y. Kumagai, F. Satoh, R. Togashi, H. Murakami, K. Takemoto, J. Iihara, K. Yamaguchi, and A. Koukitu, J. Cryst. Growth 296, 11 (2006).
- Navarro-Quezada et al. (2008) A. Navarro-Quezada, T. Li, C. Simbrunner, M. Kiecana, G. Hernandez-Sosa, M. Quast, M. Wegscheider, M. Sawicki, T. Dietl, and A. Bonanni, J. Cryst. Growth 310, 1772 (2008).
- Dietl (2008b) T. Dietl, J. Appl. Phys. 103, 07D111 (2008b).