Measurements of the Muon Content of UHECR Air Showers with the Pierre Auger Observatory
Abstract
The Pierre Auger Observatory, recently completed, has been operational since 2004. As a hybrid experiment, it allows for a wide range of measurements of UHECR-induced extensive air showers (EAS), including measurements of the EAS particle content on ground which is sensitive to high-energy hadronic interactions. We present the results of several independent measurements of the EAS muon content on ground in Auger data at a primary energy of 10 EeV. We discuss implications on high-energy hadronic interaction models and cosmic ray composition.
1 Introduction
Cosmic ray interactions at ultra-high energies offer unique insights into particle collisions at center-of-mass energies exceeding 100 TeV. Due to their very small flux at these energies, cosmic rays can only be detected indirectly via the extensive air showers (EAS) they induce in the atmosphere. Hence, in order to infer the mass and energy of the primary cosmic rays as well as to gain insight into the physics of the high-energy collisions, one has to rely on detailed simulations of air showers. For this purpose, hadronic multiparticle production has to be simulated at energies exceeding by far those accessible at man-made accelerators and in phase space regions not covered in collider experiments. The secondary muons produced in these collisions which can be detected directly on ground, are a tracer of high-energy hadronic interactions. For this reason, the number of muons produced in simulated air showers depends strongly on the adopted hadronic interaction models [1]. In addition, muons are a sensitive indicator of the primary composition, as, for example, iron showers produce about 40% more muons than protons.
In this work we will employ air shower universality in order to determine the number of muons in air showers detected with Auger, using several independent methods. Air shower universality [2, 3] states that the average properties of air showers can be completely characterized by the primary energy, stage of shower evolution, and overall muon normalization, when viewing the shower around or after shower maximum. In particular, the electromagnetic particle content of the shower is already determined by its energy and stage of evolution. Physically, this is due to the fact that the electromagnetic cascade involves dozens of particle generations and of order particles, which washes out the details of high-energy hadronic interactions.
In order to infer the muon density of showers at a given energy, one has to rely on an energy scale of the surface detector. Using the universality of the electromagnetic contribution to the signal measured by the Auger surface detectors, , we are able to determine an energy scale independent of the fluorescence energy measurement. The muon density at ground which we infer using the surface detector and, independently, using hybrid events, does not rely on assumptions on the primary cosmic ray composition. This allows for a direct test of the predictions of hadronic interaction models.
2 Parameterization of the average surface detector signal using universality
Universality features of the longitudinal profile of showers have been studied by several authors. Here we exploit shower universality features to predict the surface detector signal expected for Auger Cherenkov tanks from the electromagnetic and muonic shower components at 1000 m from the shower core. In the following, we give a brief outline of the parameterization. For a detailed description, see [3].
A library of proton and iron showers covering the energy range from to eV and zenith angles between and was generated with CORSIKA 6.5 [4] and the hadronic interaction models QGSJET II.03 [5] and FLUKA [6]. For comparison, a smaller set of showers was simulated with the combinations QGSJET II.03/GHEISHA [7] and SIBYLL 2.1/FLUKA [8, 9]. Seasonal models of the Malargüe molecular atmosphere were used [10]. The detector response is calculated using look-up tables derived from a detailed GEANT4 simulation of the Auger surface detectors, which has been shown to match the data well [11]. Note that since the Auger detectors are calibrated against the cosmic ray muon background, we only rely on the correct simulation of the signal generated by electromagnetic particles relative to that of the muons.
Air shower universality states that the electromagnetic component of the predicted surface detector signal at the lateral distance of 1000 m depends only on primary energy and the stage of shower evolution, and not on the primary particle and hadronic model assumed. We define the electromagnetic component of the signal as that of electrons, positrons, and gamma rays excluding muon decay products, and measure shower evolution in terms of the distance between the shower maximum and the ground , measured along the shower axis. In fact, universality is slightly violated, and the electromagnetic contribution to of proton and iron showers differ by about 12% [3], see Fig. 1. The dependence on the hadronic model is much smaller, about 5%.
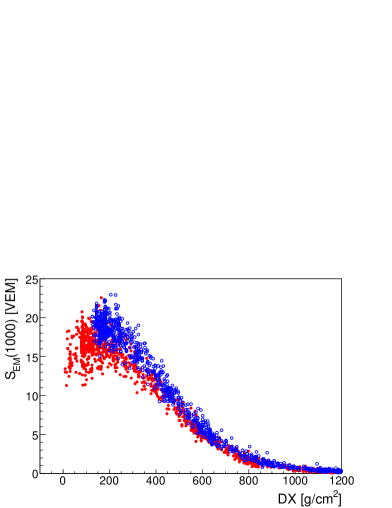
The muon contribution to , which includes muon decay products in our definition, depends strongly on the primary particle (40% difference between proton and iron) and the hadronic model (Fig. 1). However, the functional dependence on is universal.
After accounting for geometrical effects such as the projected tank surface area, the electromagnetic shower signal (averaged over proton and iron) is parameterized as function of the energy , distance to shower maximum , and zenith angle . The difference between proton and iron shower profiles is included in the calculation of the systematic uncertainties later on. Similarly, the universal shape of the muon signal profile is parameterized simultaneously using a Gaisser-Hillas function for all models and primaries (Fig. 1), leaving only normalization factors free. The expected detector signal at 1000 m can then be written as
| (1) |
where is the parametrized muon signal adopting the normalization for proton-QGSJET II at 10 EeV, so that is the number of muons relative to that of QGSJET-II proton showers at 10 EeV.
3 Measuring from the surface detector
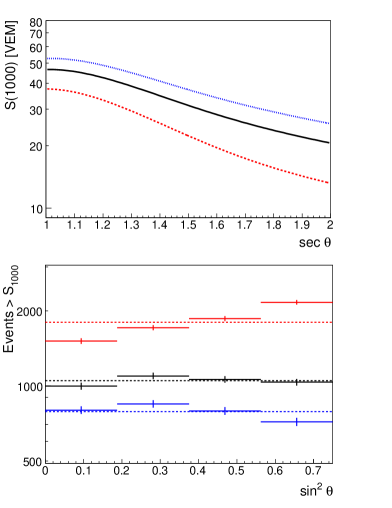
Within the current statistics, the arrival directions of high-energy cosmic rays around 10 EeV are found to be isotropic, allowing us to apply the constant intensity method to determine the muon signal contribution. Dividing the surface detector data into equal exposure bins, the number of showers with greater than a given threshold , should be the same for each bin.
| (2) |
Using the independently measured mean depth of shower maximum [13], the only remaining free parameter in Eq. (2) is the relative number of muons . For a given energy , is adjusted to obtain a flat distribution of events in .
More precisely, scanning through a range of values, we calculate the /dof of the event histogram relative to a flat distribution in . We then fit a two-branch parabola around the minimum of , which results in a best-fit and its asymmetric error, .
The sensitivity of this method to the muon number parameter in Eq. (1) is illustrated in Fig. 2. Clearly, (top histogram in the lower panel of Fig. 2) is ruled out by the data. The best description of the data above 10 EeV requires . However, we have to take into account shower-to-shower fluctuations and the finite resolution of which lead to a slightly biased measurement in this method.
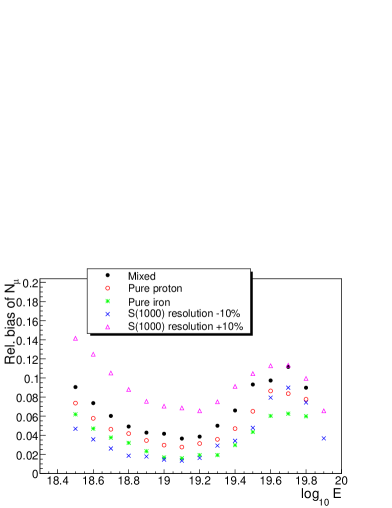
In order to estimate this bias, we have simulated a large number of Monte Carlo realizations of SD data sets of the same size as the Auger data set, distributed according to the observed cosmic ray spectrum and assuming different primary compositions (pure proton, iron, or mixed composition), and different “true” . For each shower, is obtained from distributions which closely match the observed distributions in the fluorescence data. The electromagnetic and muon signals are fluctuated according to the model predictions [3]. Note that the magnitude of fluctuations in and are robust predictions which only depend on the primary particle. Eq. (1) is then used to calculate the signal at 1000 m from the shower core, , which is smeared with an experimental reconstruction accuracy [12]. A realistic trigger probability is also applied.
For each simulated data set, we then apply exactly the same analysis as used on the real data. We found that is systematically overestimated by 36%. This bias is due to a combined action of shower-to-shower fluctuations and detector resolution which depends on the signal size. We have found that the bias in is independent of the “true” value of adopted, and primarily depends on the size of reconstruction uncertainties on and the primary composition. Fig. 3 shows the relative bias on as a function of primary energy, for different assumed compositions and increased/decreased detector resolution. Clearly, the bias is quite robust to rather extreme changes in those assumptions.
We then subtract the bias expected for a mixed composition (black dots in Fig. 3) from the measured , obtaining a corrected of:
| (3) |
Three main sources of systematics enter in the determination of using the constant intensity method: the uncertainty on the electromagnetic signal due to universality violation (Sec. 2); the uncertainty on at this energy; and the uncertainty on the bias of determined from the Monte Carlo simulations.
In order to quantify the first two systematics, we measure using an electromagnetic signal rescaled by 6%, bracketing the observed universality violation, and measuring with varying , adopting the systematic and statistical uncertainty reported by Auger [13]. For the uncertainty on the bias, we adopt %. Summing the different contributions in quadrature, we obtain the total systematic error on quoted in Eq. (3).
Once at 10 EeV is measured, and using the measured mean depth of shower maximum, the signal size at can be calculated:
| (4) |
Within the uncertainties, this value of is consistent with the energy scale from fluorescence detector measurements, whose systematic uncertainty (22% [14]) is dominated by the uncertainty on the fluorescence yield. Eq. (4) corresponds to assigning showers a % higher energy than done in the fluorescence detector-based Auger shower reconstruction ().
4 Measuring from hybrid events
The Pierre Auger Observatory has the unique capability of measuring hybrid events which have been simultaneously detected by the surface detector array and fluorescence telescopes. For each of these events, a calorimetric measurement of the energy and depth of shower maximum are available, in addition to the signal from the surface array. Hence, we can use our parameterization of the universal electromagnetic signal to determine the electromagnetic contribution to . The remainder of the signal is attributed to muons, and we can determine a muon normalization for each event:
| (5) |
where is again the reference muon signal (proton-QGSJetII at 10 EeV).
We select high-quality hybrid events for which the shower maximum is in the field of view of a telescope, , and the Mie scattering length is measured. Furthermore, the Cherenkov light fraction is limited to less than 50%, and we apply all cuts used in the measurement of the elongation rate [13] which have been carefully chosen in order to ensure an unbiased distribution of the air showers. The surface detector event has to satisfy the T5 selection cuts which are also applied in [14].
The average muon normalization in hybrid events at 10 EeV is found to be
| (6) |
in excellent agreement with the constant intensity method results, when compared at the same energy scale.
A similar study has been performed for inclined hybrid events (). While the statistics are limited, no subtraction of is necessary for these events, as the electromagnetic part has been attenuated in the large depth of atmosphere traversed. Thus, inclined hybrid events yield a clean measurement of , and good agreement between muon numbers of the inclined and the vertical data sets is found.
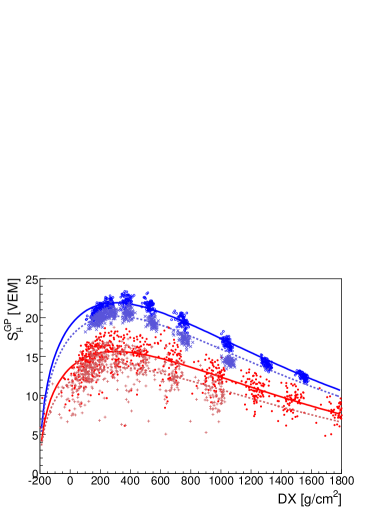
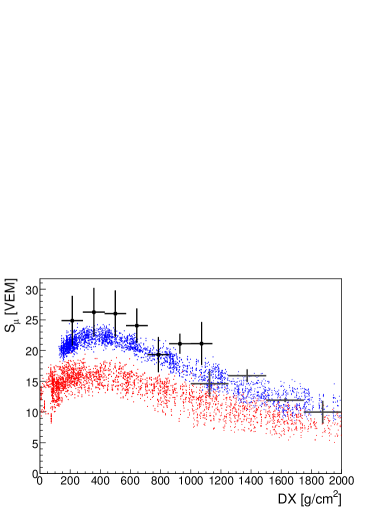
Fig. 4 shows the muon signal derived from the hybrid events as a function of shower evolution (). While the muon signal is clearly higher than that predicted in the simulations, the behavior as a function of follows the prediction very well, which serves as a consistency test of our method.
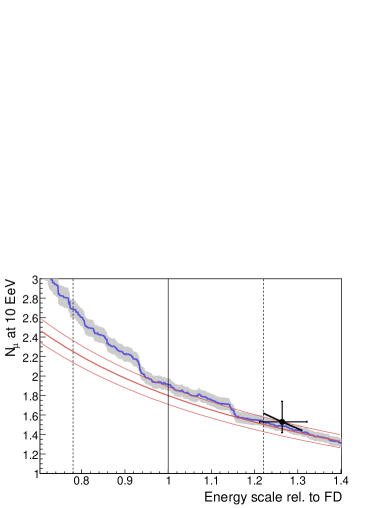
In Fig. 5 we compare the results of the different methods applied for inferring the muon density at 1000 m from the shower core. The relative number of muons is shown as function of the adopted energy scale with respect to the Auger fluorescence detector energy reconstruction. Only the constant intensity method yields an independent measurement of the energy scale. Good agreement between the presented methods is found, when compared at .
5 Discussion
Assuming air shower universality, which was tested with simulations of various primaries and hadronic interaction models, we have determined the muon density at 10 EeV and the energy scale with which the data of the Pierre Auger Observatory can be described self-consistently. The number of muons measured in data is about 1.5 (1.7) times larger than that predicted by QGSJET II (Sibyll) for proton showers, with statistical and systematic errors of the order of 0.1. This value of is even slightly larger than that predicted for iron showers, by a factor of 1.1 and 1.2 for QGSJetII and Sibyll, respectively. A similar excess has been found at energies from 3 EeV to 50 EeV.
Consistent results were obtained with several analysis methods on independent data sets: the constant intensity method (Sec. 3) uses only the surface detector data and is independent of the fluorescence energy scale. Vertical hybrid events (Sec. 4) allow for a direct and unbiased measurement of for each event, albeit depending on the flourescence energy. The signal in inclined hybrid events () is purely muonic, and the resulting independent of the subtraction of the electromagnetic signal. The fact that all three methods agree within errors for an energy scale of indicates that increasing the number of muons by 50% (relative to proton-QGSJetII) yields a consistent description of the Auger data.
If interpreted in terms of cosmic ray composition, the derived muon density would correspond to nuclei heavier than iron, which is clearly at variance with the measured values at this energy. The discrepancy between air shower data and simulations reported here is qualitatively similar to the inconsistencies found in composition analyses of previous detectors [15, 16, 17]. This points towards a deficiency of hadronic models in predicting the number of muons produced in air showers at large distances from the shower core. However, it is important to note that the method presented here relies on a correct description of the electromagnetic shower component in the simulations.
References
- [1] J. Knapp, D. Heck, S. J. Sciutto, M. T. Dova, and M. Risse, Astropart. Phys. 19 (2003) 77–99 and astro-ph/0206414.
- [2] P. Billoir, lecture given at CORSIKA School, http://www-ik.fzk.de/corsika/corsika-school, 2005; M. Giller et al., J. Phys. G31 (2005) 947–958; F. Nerling et al., Astropart. Phys. 24 (2006) 421–437; D. Gora et al., Astropart. Phys. 24 (2006) 484–494; A. S. Chou [Auger Collab.], Proc. 29th ICRC (Pune, India), p. 319, 2005.
- [3] F. Schmidt, M. Ave, L. Cazon, and A. Chou, Astropart. Phys. 29 (2008) 355–365 and arXiv:0712.3750 (astro-ph)
- [4] D. Heck, J. Knapp, J. Capdevielle, G. Schatz, and T. Thouw, Wissenschaftliche Berichte FZKA 6019, Forschungszentrum Karlsruhe, 1998.
- [5] S. Ostapchenko, Phys. Rev. D74 (2006) 014026 and hep-ph/0505259.
- [6] A. Fasso, A. Ferrari, J. Ranft, and R. P. Sala, in Proc. of MC 2000, Lisbon, Portugal, 23-26 Oct 2000, A. Kling, et al. eds., Springer-Verlag Berlin, p. 955, 2001.
- [7] H. Fesefeldt, preprint PITHA-85/02, RWTH Aachen, 1985.
- [8] R. S. Fletcher, T. K. Gaisser, P. Lipari, and T. Stanev, Phys. Rev. D50 (1994) 5710–5731.
- [9] R. Engel, T. K. Gaisser, P. Lipari, and T. Stanev, in Proc. 26th ICRC (Salt Lake City) vol. 1, p. 415, 1999.
- [10] B. Keilhauer, J. Blümer, R. Engel, H. O. Klages, and M. Risse, Astropart. Phys. 22 (2004) 249–261 and astro-ph/0405048.
- [11] I.L’Henry-Yvon [Auger Collab.], Proc. 30th ICRC (Mérida) #300, 2007.
- [12] M. Ave [Auger Collab.], Proc. 30th ICRC, (Mérida), ArXiv 0709.2125 (astro-ph), 2007.
- [13] M. Unger [Auger Collab.], Proc. 30th ICRC (Mérida) #594, 2007.
- [14] Abraham, J. et al. [Auger Collab.], Phys. Rev. Lett. 101 (2008), 061101, arXiv:0806.4302 (astro-ph)
- [15] T. Abu-Zayyad et al. (HiRes-MIA Collab.), Phys. Rev. Lett. 84 (2000) 4276 and astro-ph/9911144.
- [16] M.T. Dova, M.E. Mancenido, A.G. Mariazzi, T.P. McCauley and A.A. Watson, Astropart. Phys. 21 (2004) 597 and astro-ph/0312463.
- [17] A.A. Watson, Nucl. Phys. Proc. Suppl. 136 (2004) 290 and astro-ph/0408110.
- [18] W.R. Nelson, Report SLAC-265, Stanford Linear Accelerator Center, 1985.