The extended X-ray emission around HDF 130 at z=1.99: an inverse Compton ghost of a giant radio source in the Chandra Deep Field North
Abstract
One of the six extended X-ray sources found in the Chandra Deep Field North is centred on HDF 130, which has recently been shown to be a massive galaxy at with a compact radio nucleus. The X-ray source has a roughly double-lobed structure with each lobe about 41 arcsec long, or 345 kpc at the redshift of HDF 130. We have analyzed the 2 Ms X-ray image and spectrum of the source and find that it is well fit by a power-law continuum of photon index 2.65 and has a 2–10 keV luminosity of (if at ). Any further extended emission within a radius of 60 arcsec has a luminosity less than half this value, which is contrary to what is expected from a cluster of galaxies. The source is best explained as an inverse Compton ghost of a giant radio source, which is no longer being powered, and for which Compton losses have downgraded the energetic electrons, required for high-frequency radio emission. The lower energy electrons, produce X-rays by inverse Compton scattering on the Cosmic Microwave Background. Depending on the magnetic field strength, some low frequency radio emission may remain. Further inverse Compton ghosts may exist in the Chandra deep fields and beyond.
keywords:
X-rays: galaxies — galaxies: clusters — intergalactic medium — galaxies:individual (RG J123617)1 Introduction
The deepest published X-ray image of the Sky is the 2 Ms Chandra Deep Field North (CDFN: Alexander et al 2003). Bauer et al (2002) studied the 6 extended sources found in the first Ms exposure of this field and inferred that they were all due to clusters and groups. Casey et al (2008) have recently found that object HDF 130, at the centre of one of these extended sources (Source 2, CDFN J123620.0+621554, of Bauer et al 2002), is a massive elliptical galaxy at redshift , and not a starburst galaxy as earlier supposed. HST/NICMOS and Spitzer/IRAC imaging have revealed that the object has a massive () old stellar population with a large diameter of about 8 kpc. It is intrinsically weak at submillimetre wavelengths and has a compact radio source, indicative of a central Active Galactic Nucleus (AGN). We investigate here the possibility that the double-lobed structure of the extended X-ray source is not then due to a surrounding merging cluster, as suggested by Bauer et al (2002), but instead to inverse Compton (IC) emission from a past outburst of the galaxy. The object would in the past have appeared as a giant radio galaxy, but inverse Compton losses have downshifted the high energy electrons responsible for radio emission so what remains is X-ray IC emission produced by Lorentz factor electrons scattering on the Cosmic Microwave Background (CMB).
Extensive IC X-ray emission from large radio galaxies has been detected above redshift , such as 3C 294 (; Fabian et al 2003), 6C 0905+39 (, Blundell et al 2006; Erlund et al 2008) and 4C 23.56 (; Johnson et al 2007). The flux of the emission depends on the energy density of the target photons, which in the case of the CMB rises as so cancelling out the dimming expected from increased distance (Felten & Rees 1969; Schwartz 2002). In the case of 3C 294 there are distinct large patches of X-ray emission separate from the observed radio source (Erlund et al 2006) and in 6C 0905+39 most of the X-ray emission lies in between the hotspots where no radio emission is seen (Erlund et al 2008). The lifetime of the electrons in the sources scales as due to radiative losses. Lorentz factors of are required to upscatter the CMB photons and (depending on the magnetic field strength) to generate GHz synchrotron radiation in the radio band. Consequently when the AGN switches off and no further electron acceleration takes place, the IC X-ray emission can last ten or more times longer than the high-frequency radio source, as observed with current instruments.
The Compton lifetime of electrons at is about 30 Myr, so the X-ray ghost of a dead giant radio galaxy at that redshift may be detectable as an extended X-ray source for that time. Depending on the ratio of the radio to Compton lifetimes, and on adiabatic expansion losses, such X-ray sources could be common. Celotti & Fabian (2004) considered the relative numbers of radio galaxies and clusters as a function of redshift and showed that such extended ghosts could well outnumber low luminosity clusters at moderate to high redshifts. They predicted that such objects could account for some of the extended objects in the Chandra deep fields.
Here we investigate whether Source 2 in the extended CDFN source list of Bauer et al (2002) can be such a ghost of a radio source, given its double-lobed structure with a massive galaxy hosting a compact radio source at the centre. The case stands on the morphology and spectrum of the X-ray source and the coincidence with the massive galaxy. Fortunately the X-ray dataset has been doubled (from 1–2 Ms exposure) since the work of Bauer et al (2002).
The Hubble Deep Field region has been observed at radio frequencies (1.4 GHz) at the VLA (Richards et al 1999; Biggs & Ivison 2006) and Westerbork (Garrett et al 2000). Two faint VLA radio sources, unresolved in the 1.5 arcsec beam, appear at the position of the extended X-ray emission111One is HDF 130, which is unresolved ( mas) by MERLIN (Casey et al 2008); the other, 10 arcsec to the NNW and coincident with an X-ray emission peak (Alexander et al 2003), is a submillimetre galaxy at the same redshift as HDF130 (Chapman et al 2008, submitted)., with a flux totalling . This compares with a single unresolved WSRT source of at the same wavelength of 21 cm (see the map in Garrett et al 2000 which shows contours of the Westerbork source and marks the positions of the VLA sources). The much larger beam of the Westerbork array ( arcsec; the source size is quoted as arcsec) is more sensitive to extended radio flux which can explain the difference between the measured fluxes. In other words, the data appear consistent with the presence of an extended 1.4 GHz radio source of about at the position of the extended X-ray source. For the present, we treat it as an upper limit.
We assume , which translates into a scale of 8.5 kpc per arcsec at .
2 Data analysis
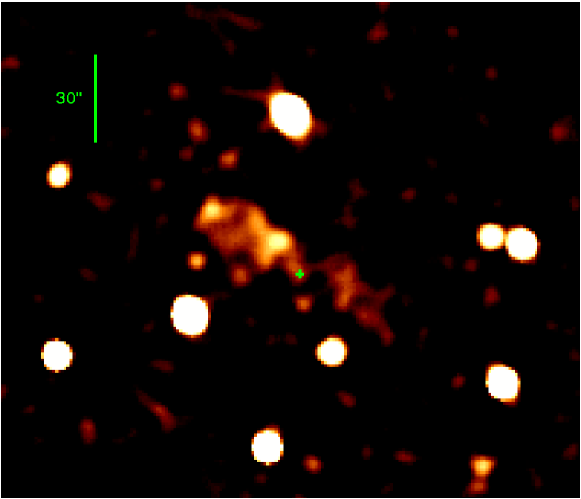
The X-ray image (Fig. 1) shows an extended source which is roughly linear in shape from NE to SW (aspect ratio of about 4 to 1) and with a minimum in the middle. The point-like radio source lies at the centre of the structure close to the minimum. Each lobe is 40.7 arcsec (345 kpc) long, so the whole X-ray source is 690 kpc across. This is not exceptional for a giant radio galaxy (e.g. Mullin et al 2008).
Thus on a purely morphological basis the source resembles what a ghost radio source should look like and is unlike a relaxed cluster of galaxies. Such a massive galaxy is plausibly in a cluster of some form and it would not be surprising for there to be some extended hot gas associated with it. An important test is how extended the X-ray emission appears; a cluster atmosphere should be very extended and appear roughly circular and not the limear shape we observe here.
The 2 Ms CDF-N data (see Alexander et al. 2003 for a full description of the data) were re-reduced following a procedure identical to that described by Luo et al. (2008) for the 2 Ms CDF-S data analysis. X-ray spectra of our source were then extracted from individual reduced and cleaned level 2 event files using routines and recipes from the ACIS Extract software package (AE; Broos et al. 2002), which automates and augments the basic reduction method within CIAO (v4.0). We adopted two formal extraction regions centred on HDF 130, an elliptical region that encompassed only the high-surface brightness emission (45″17″, i.e. major axis NE) and a circular region equivalent to 500 kpc in radius at (60 arcsec radius). Background spectra were extracted from an annulus between 60 arcsec and 100 arcsec centred on our source. In all regions, point sources from the catalog of Alexander et al. (2003) were excluded using circular regions a factor of two larger than the 99 per cent encircled energy radius at that position (4–10″). The individual spectra and associated calibration products were then merged, and the combined background spectrum was scaled to that of our source based on the mean ratio of the effective areas. We note that this effective area ratio is nearly constant over the entire energy range, with only a 3–4 per cent variation from end-to-end. The spectra were grouped at a signal-to-noise ratio of 5 and then fit with XSPEC (Version 12.4.0; Arnaud 1996).
The spectra from the smaller elliptical and the larger circular regions have both been fitted with power-law and thermal (Mekal) models, absorbed by the Galactic column density of . The observed spectra are similar (Fig. 2) and show no significant flux difference. The limit on any further extended emission from a hot medium in any surrounding cluster is a rest-frame 2–10 keV luminosity of (a temperature of 3 keV was assumed). For the elliptical region covering the obvious emission in Fig. 1 we find similar values of for 112 degrees of freedom for both the power-law and thermal models. The fitted photon index for the former and the temperature for the latter , where the uncertainties are quoted at 90 per cent confidence levels. The 0.5–5 keV flux of the source is (i.e. 0.6 nJy at 1 keV).
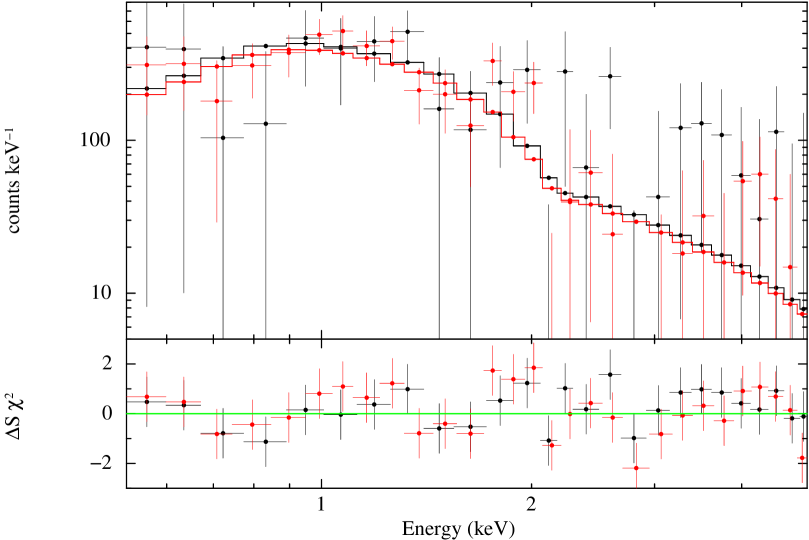
After correction for Galactic absorption, the 2–10 keV rest frame luminosity of the source is . This is about one half of that of the giant powerful radio galaxy 6C 0905+39 (; Erlund et al 2008), so the size and luminosity of the extended CDFN X-ray source are not exceptional. Although the spectrum does not distinguish power-law IC from thermal emission, the linear shape of the object and lack of more extensive emission strongly support a non-thermal origin; indeed there is no known evidence of any thermal material within FRII lobes. The photon index of the emission around HDF 130 is steeper () than that associated with 6C 0905+39 () but only marginally so when uncertainties are considered. This may indicate that spectral ageing is significant for the electrons in the HDF 130 source. The highest energy electrons lose their energy at a faster rate than lower energy ones, so leading to a steepening of the spectrum. It seems plausible that we are observing HDF130 at a later stage in its lifecycle than we observe 6C0905+39.
3 Discussion
We have shown that Extended Source 2 from the CDFN (Bauer et al 2002) is plausibly a ghost X-ray source with X-ray bright lobes. The total electron energy associated with the emission is considerable at about , using expression (6) in Erlund et al (2006) with the electron distribution extending from and the above keV luminosity. This estimate can increase considerably if the electron distribution is broader (particularly extending below ) and if energetic protons accompany the electrons. At the present time we have neither direct or indirect means to detect the protons, nor do we have any reason to invoke particles with Lorentz factors below (those that are madnated by the ICCMB emission). If the steep photon index is due to spectral ageing then a turnover in the electron distribution is expected there. The total energy of the source will have been larger in the past if the radio lobes were over-pressured with respect to the environment they were expanding into. Also it is expected that expansion losses will be important if the source is not confined in some way. We presume this source does lie in a poor cluster or group which has a hot medium with a low X-ray luminosity into which the lobes will be doing work as they expand.
The expected radio flux from the source relies on several assumptions. If we first assume that the magnetic field in the lobes is in energy equipartition with the relativistic electrons estimated above then we find a field of G. (The emission region has been approximated as a cylinder 690 kpc long and 170 kpc in diameter.) This means that the Lorentz factor for electrons giving 1.4 GHz synchrotron radio emission is . The synchrotron flux can then be predicted from the inverse Compton flux using, for example, expressions (4.53) and (4.54) of Tucker (1975). Assuming a power-law electron distribution for , we find a 1.4 Ghz synchrotron flux of Jy (Jy at 300 MHz) for a photon index and Jy for . Only for a steep spectral index (consistent with an ageing electron population) are the present 1.4 Ghz radio observations consistent with this prediction. The synchrotron flux varies with the total energy as , so a broader energy distribution increases the predicted flux, thus strengthening this conclusion. For example, if and the electron spectrum turns over below then the predicted 1.4 GHz synchrotron flus is just consistent with the flux density of Jy hinted at by the discrepancy between the Westerbork and VLA images.
If the powerful jets have switched off and electron acceleration ended within the hotspots then there will not be a simple power-law electron distribution from , but a steep turnover above the energy where the inverse Compton cooling time equals the time since the acceleration stopped;
| (1) |
This could mean that the radio source is only detectable at low radio frequencies (few 100 MHz) and thus, for example, with the giant metrewave radio telescope (GMRT) or in the future with Low Frequency Array (LOFAR) and similar instruments.
Bauer et al (2002) note that there may be about 150 extended X-ray sources per square degree. If even 10 per cent of them are similar to the HDF 130 source then they have a space density of roughly Mpc-3 ( Mpc-3 in comoving units), close to the estimate of Celotti & Fabian (2004) for sources of luminosity . The Compton cooling time at is about 30 Myr, whereas the time from to 1.5 is about 1.7 Gyr. Therefore the space density of objects giving rise to ghosts (assuming they each only undergo one jet-active phase) is 50 times the above value or Mpc-3 in comoving units, comparable to the number density of massive galaxies (; Cole et al 2001). It is even higher if expansion losses dominate, as expected.
A direct demonstration of our IC explanation for the extended X-ray emission around HDF130 would be the clear detection and mapping of the radio source itself at low radio frequencies (e.g. 100 MHz), where the Compton losses are less and the emitting electrons closer in energy to the X-ray ones.
We conclude that the X-ray Sky may be littered with faint inverse Compton ghosts.
Acknowledgements
We acknowledge financial support from the Royal Society (ACF and KMB) and Chandra grant SP8-9003B (FEB). CMC thanks the Gates-Cambridge Trust.
References
- Alexander et al. (2003) Alexander, D. M., et al. 2003, AJ, 126, 539
- (2) Arnaud, K.A., 1996, Astronomical Data Analysis Software and Systems V, eds. Jacoby G. and Barnes J., p17, ASP Conf. Series volume 101
- Bauer et al. (2002) Bauer, F. E., et al. 2002, AJ, 123, 1163
- (4) Blundell, K.M., Fabian, A.C., Crawford, C.S., Erlund, M.C., Celotti, A., 2006, ApJ, 644, L13
- (5) Biggs, A.D., Ivison, R.J., 2006, MNRAS, 371, 963
- Broos et al. (2002) Broos, P. S., Townsley, L. K., Getman, K., & Bauer, F. E. 2002, ACIS Extract, An ACIS Point Source Extraction Package (University Park: The Pennsylvania State Univ.) http://www.astro.psu.edu/xray/docs/TARA/ae_users_guide.html
- (7) Casey, C.M., Chapman, S.C., Muxlow, T.W.B., Beswick, R.J., Alexander, D.M., Conselice, C.J., 2009, MNEAS, in press (arXiv:0902.1528)
- (8) Celotti, A., Fabian, A.C., 2004, MNRAS,353, 523
- (9) Cole, S., et al, 2001, MNRAS, 326, 255
- (10) Erlund, M.C., Fabian, A.C., Blundell, K.M., Celotti, A., Crawford, C.S., 2006, MNRAS, 371, 29
- (11) Erlund, M.C., Fabian, A.C., Blundell, K.M., 2008, MNRAS, 386, 1774
- (12) Fabian, A.C., Sanders J.S., Crawford, C,S., Ettori, S., 2003, MNRAS, 341, 729
- (13) Felten, J.E, Rees, M.J., 1969, Nature, 221, 924
- (14) Garrett, M,A., de Bruyn, A.G., Giroletti, M., Baan, W., Schilizzi, R.T., 2000, A&A, 361, L41
- Getman et al. (2005) Getman, K. V., et al. 2005, ApJS, 160, 319
- (16) Johnson, O., Almaini, O., Best, P.N., Dunlop, J., 2007, MNRAS, 386, 151
- Luo et al. (2008) Luo, B., et al. 2008, in press (arXiv:0806.3968)
- (18) Mullin, L. M., Riley, J. M., Hardcastle, M. J., 2008, MNRAS, 390, 595
- (19) Richards, E.A., et al. 1999, ApJ, 526, L73
- (20) Schwartz, D.A., 2002, ApJ, 569, L23
- Townsley et al. (2003) Townsley, L. K., Feigelson, E. D., Montmerle, T., Broos, P. S., Chu, Y.-H., & Garmire, G. P. 2003, ApJ, 593, 874
- (22) Tucker, W.H., Radiation Processes in Astrophysics, 1977, MIT Press