On the trapping of stars by a newborn stellar supercluster
Abstract
Numerical experiments conducted by (2006) suggest that a supercluster may capture up to about 40 per cent of its mass from the galaxy where it belongs. Nevertheless, in those experiments the cluster was created making appear its mass out of nothing, rather than from mass already present in the galaxy. Here we use a thought experiment, plus a few simple computations, to show that the difference between the dynamical effects of these two scenarios (i.e., mass creation vs. mass concentration) is actually very important. We also present the results of new numerical experiments, simulating the formation of the cluster through mass concentration, that show that trapping depends critically on the process of cluster formation and that the amounts of gained mass are substantially smaller than those obtained from mass creation.
keywords:
methods: N–body simulations – galaxies: dwarf – galaxies: star clusters1 Introduction
Fellhauer et al. (2006, FKE06 hereafter) have recently proposed the capture of old stars by massive stellar superclusters during their formation process as a possible explanation for the different age and metallicity populations found in some clusters (e.g., Centauri). They used numerical experiments to show that up to about 40 per cent of the initial mass of the cluster can be gained from stars of the galaxy where the cluster belongs and they even suggest that the captured mass might exceed the mass of the cluster in some cases.
One problem with the numerical simulations of FKE06 is that, since essentially all the captures take place during the formation of the cluster, it is obvious that the formation process itself should strongly affect the dynamics of capture and, therefore, it is crucial to use an adequate model of the formation process in order to get reasonable estimates of the gained mass. Nevertheless, in FKE06 the clusters are created as Plummer models whose masses increase linearly from zero to their final values. In other words, the mass of the cluster is created rather than, as it should, taken from mass already present in the galaxy. Although they acknowledged that problem, FKE06 argued that, since the cluster is much less massive than the galaxy, the adjustment of the galaxy potential due to the cluster formation is a tiny effect, which is true, but of little relevance to the process of capture. Besides, they perform a test using a Plummer model of constant mass that starts with a large scalelength which is subsequently reduced (i.e., simulating the collapse that forms the cluster), obtaining almost exactly the same result as with the Plummer model with variable mass. Although this outstanding coincidence seems to give strong support to the results of FKE06 we will explain below that, in fact, it does not.
Here we will show that, although the trapping effect invoqued by FKE06 indeed exists, when the supercluster is created from mass already present in the galaxy the amount of captured mass is substantially smaller than what they found. The next section presents a thought experiment and some computed results to show that the difference between aggregating matter already present and creating it is absolutely crucial for the result of the capture process and, besides, we explain why the test done by FKE06 does not avoid the problem of creating matter from nothing. The third section describes our own numerical experiments, using the FKE06 scenario and our own, and their results are presented in the fourth section. The fifth and final section discusses our results.
2 The dynamical difference between creating and concentrating mass
Let us consider a spherical galaxy with a cluster being formed at its centre, so that we can apply Newton’s theorems for spherical systems (see, e.g., Binney and Tremaine, 2008), and let us further assume that, except for the mass related to the cluster formation, the rest of the mass of the galaxy keeps its original distribution. If, following FKE06, we start with a zero mass cluster and increase its mass up to a final value, all the masses of the system will experience an additional central force of an amount depending on the distance of the mass to the centre of the system. If, instead, we mimic the cluster formation selecting as the primordial cloud a sphere centered at the centre of the stellar system, with a radius smaller than that of the system, and we take from every spherical shell of that sphere a certain fraction of its mass and move it to the centre of the system to form there the cluster, the result is very different: 1) Any mass at a radius that places it outside the primordial cloud will experience no extra force, because the mass within that radius will be the same; 2) The masses within the radius of the primordial cloud will experience new radial forces that will be very small near the border of the cloud and will increase as we consider masses closer to the centre. Notice that, as the largest differences between the two cases correspond to the largest radii, they also involve the largest volumes within the galaxy.
Of course, the parameter relevant to the capture process is not the force but the potential: a star will be captured by the cluster if, after the cluster formation, the potential at the location of the star is reduced by an amount larger than one half the squared velocity of the star; that is, the quantity we should be interested in is the variation of the potential due to the formation of the cluster. We used the force in the previous discussion because, while in a spherically symmetric case the force at a certain radius depends only on the mass within that radius, the potential depends also on the distribution of mass outside that radius (see, e.g., Binney and Tremaine, 2008) and that would have complicated the discussion. Nevertheless, if we supplement our thought experiment with a few simple computations, we can use the potential rather than the force for our analysis. Let us consider again a spherical galaxy with a cluster being formed at its center —either by creating or concentrating mass— and let us assume that, except for the matter used to form the cluster by concentration, the density distribution of the galaxy is not altered by the formation of the cluster. If the mass of the cluster is created, the difference in the potential at a certain point of the galaxy, before and after the creation of the cluster, will be independent of that density distribution. Instead, when the cluster is created taking matter from the primordial cloud centered at the center of the system, the potential will not change outside that cloud and its change within the cloud will depend only on the density distribution within the cloud.
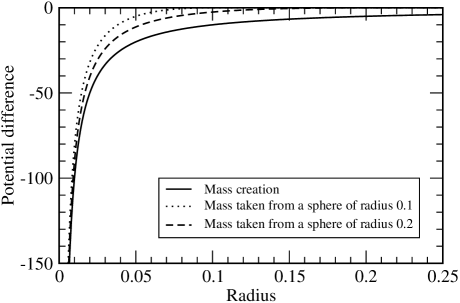
A simple numerical example will illustrate this. Let us consider the cluster as a point mass, , and let us take the gravitational constant as . We took the density distribution of the primordial cloud as , where is the radius, and and are parameters of the distribution (we recall that the density distribution beyond the cloud radius, , is irrelevant for this computation); two different radii were chosen for the primordial cloud, i.e., and . To form the cluster by concentration, we simply reduced by the amount needed to take from the primordial cloud a mass equal to and we placed that mass at the centre of the galaxy. Fig. 1 presents our results: the full line gives the change in the potential for the case of mass creation and the dotted and dashed lines give the same for the case of mass concentration, respectively for and ; here, we adopted , but the result is very similar with . Now, if we draw a horizontal line at an ordinate equal to where is the star’s velocity, the captured stars will be those at radii such that the full line (in case of mass creation), or the dotted or dashed lines (in case of mass concentration), lie below that horizontal line. Thus: 1) There will be captured stars beyond , or , in the case of mass creation, but not in the case of mass concentration; 2) Within , or , there will always be more captures in the case of mass creation, and the difference with the case of mass concentration will diminish as we go to smaller radii, becoming zero only at the centre of the system; 3) The smaller the radius of the primordial cloud, the larger is the difference between the mass creation and mass concentration scenarios. As indicated previously, the difference between the mass gain in both cases is smaller for smaller volumes, but we now see that in those smaller volumes can be captured stars that move faster than those that can be captured in larger volumes, so that there is some compensation of the volume effect.
It is now evident that the dynamics of capture will be strongly affected by the process of formation of the cluster and that creating matter leads to more captures than concentrating it. Nevertheless, our thought experiment and simple computations do not allow us to go beyond this qualitative conclusion and, to reach quantitative results, we need to resort to numerical experiments. However, before turning to them, let us analyze why the check perfomed by FKE06 attempting to simulate mass concentration, rather than creation, offers no check at all.
FKE06 adopt their set-up corresponding to (small disc, heavy supercluster, one scalelength distance), they create a cluster with a mass of and a scalelength equal to the disc scalelength (0.5 kpc) and, finally, they shrink that scale distance to the one of the cluster (25 pc) on a time scale equal to the crossing time of the cluster (3.7 My). The problem is that, again, they create mass from nothing. If we assume that the shrinking process is fast enough so that the stars of the galaxy change their positions very little during that process, it is obvious that, in the end, they would have gained essentially the same (negative) potential energy as if the cluster had been created instantaneously with the final scalelength. From Fig. 1 of FKE06 we can estimate the velocity dispersion at one disc scalength radius as about 40 km s-1 for the small disc, that is, it will take an average star about 10 My to traverse the scale length of the original cloud which is an interval long enough, compared to that of the scalelength change, to accept that the stars have not moved much during the shrinking process. In other words, the coincidence of the result of this model with the original one is exactly what one could have expected, and it is no proof that the creation of matter to build the cluster does not affect the amount of gained mass.
3 Description of the numerical experiments
In order to establish a quantitative proof of the abovementioned qualitative discussion, we performed a series of numerical experiments. We first set up a background galaxy in equilibrium composed of a disc and an analytic halo, without a bulge. The disc is realized using particles laid down according to the following distribution function:
| (1) | |||||
that is, isothermal in the vertical direction with scaleheight (Spitzer, 1942), exponential in the radial direction with scalelength , and axisymmetric. The velocities are Gaussian, with dispersions , and in each direction respectively, and a mean acimutal velocity . The parameters and are input parameters, as well as the total mass of the disc . From these, the dispersions and were computed following the recipe of Barnes (1992).
The potential of the halo is given by
| (2) |
that is, a spherical logarithmic potential with asymptotic circular velocity and core radius . Both and are input parameters.
We choose units such that the gravitational constant , and . With this choice, we set , , and . Using the equivalences and kpc, these units correspond to the high-mass galaxy of FKE06, although our model differs somewhat from theirs in the velocity space, as can be seen comparing Fig. 2 with Figure 1 of FKE06.

Our cluster is built up in two different ways: a) By letting the potential of an analytical Plummer sphere with scalelength and total mass to grow from zero to its maximum strength. The growing up is achieved by varying linearly with time during an interval equal to the crossing time of the final Plummer sphere. The centre of the potential is put in a circular orbit of radius . b) By letting a fraction of the particles inside a sphere of total mass and radius to move as if, besides their original velocities, they were in free fall with respect to the centre of the sphere. The particles are randomly chosen among those inside the radius . The total mass of the falling particles is , the mass of the future cluster. This in turn determines the radius as that which is required for to be the desired fraction. The centre of the sphere is put in a circular orbit of radius . The free fall is achieved by adding the potential of a homogeneous sphere chosen so that the free fall time is a desired value . This potential is not seen by the rest of the particles of the galaxy. The falling particles are kept under the influence of the added potential until they reach a small fiducial radius with respect to the centre of the sphere, from which point they are given the velocity of that centre and freed from the falling. After that, if any of those particles leaves the sphere of radius , it is forced to fall again. The first approach (Plummer sphere) implies assuming that the mass of the cluster is taken from outside the galaxy, whereas in the second one (free fall sphere) the mass of the cluster is taken from the galaxy itself.
| Model | , | , | , | , | , | ||
|---|---|---|---|---|---|---|---|
| P1 | 0.025 | 0.002 | 0.175 | 1.5 | – | – | 0.099 |
| P1b | 0.015 | 0.002 | 0.081 | 1.5 | – | – | 0.101 |
| C1 | 0.015 | 0.002 | 0.175 | 1.5 | 0.54 | 0.10 | 0.039 |
| P2 | 0.025 | 0.002 | 0.175 | 3.0 | – | – | 0.149 |
| C2 | 0.015 | 0.002 | 0.175 | 3.0 | 0.56 | 0.10 | 0.032 |
| C2b | 0.015 | 0.002 | 0.175 | 3.0 | 0.77 | 0.05 | 0.042 |
| C2c | 0.015 | 0.002 | 0.175 | 3.0 | 0.41 | 0.20 | 0.027 |
| P3 | 0.025 | 0.001 | 0.250 | 1.5 | – | – | 0.055 |
| C3 | 0.015 | 0.001 | 0.250 | 1.5 | 0.54 | 0.05 | 0.013 |
| P4 | 0.025 | 0.003 | 0.143 | 1.5 | – | – | 0.140 |
| C4 | 0.015 | 0.003 | 0.143 | 1.5 | 0.54 | 0.15 | 0.029 |
| P5 | 0.025 | 0.010 | 0.078 | 1.5 | – | – | 0.295 |
| C5 | 0.015 | 0.010 | 0.078 | 1.5 | 1.13 | 0.10 | 0.226 |
| C5b | 0.015 | 0.010 | 0.078 | 1.5 | 0.81 | 0.20 | 0.198 |
| C5c | 0.015 | 0.010 | 0.078 | 1.5 | 0.54 | 0.50 | 0.119 |
| S1 | 1.5 to 0.025 | 0.002 | 0.175 | 1.5 | – | – | 0.099 |
| S1b | 0.25 to 0.025 | 0.002 | 0.175 | 1.5 | – | – | 0.098 |
Table 1 shows the parameters used for the different cluster models in our experiments. Model names starting with P refer to experiments in which the cluster is simulated through a Plummer sphere; names starting with C indicate simulations in which the mass of the cluster is concentrated from the environment, that is, the free fall generated clusters (although these models are not free fall experiments in a strict sense, we will still call them free fall models for simplicity). Model P1 is our basic model: the growing time corresponds to the crossing time of the Plummer sphere, the radius of the circular orbit equals the scalelength of the disc, and the mass of the cluster is 1/500 of the mass of the disc. Model P1b is like model P1 but has a Plummer’s scalelength equal to the radius of the free fall final sphere. This is to verify whether the difference between and is affecting the comparison between the Plummer and the free fall models. Model C1 has the same mass as model P1, and the same circular orbit. The free fall time was chosen equal to that of Model P1, and the free fall radius was chosen 1/100 of the scalelength of the disc, comparable to the scalelength of model P1. The falling mass corresponds to a 10 per cent of the mass inside radius . Models P2 and C2 are the same as P1 and C1, respectively, but the radius of the circular orbit is doubled, in order to probe a different ambient for the cluster. Models C2b and C2c are identical to model C2, but the falling masses correspond to a 5 per cent and a 20 per cent of the mass inside the sphere of radius , respectively. These models, which vary only the radius of the sphere from which the mass to be concentrated is taken, allow a verification of what was said in Section 2 with respect to changing the size of the cloud. Models P3 and C3 are also the same as P1 and C1, but the respective clusters have half the mass, and, correspondingly, a larger crossing/free fall time. Models P4 and C4 have 1.5 times the mass of models P1 and C1, respectively, and a corresponding shorter crossing/free fall time. These four last models were run in order to assess how much the results are affected when the mass of the cluster is changed. Model P5 corresponds to a Plummer sphere that grows to a whole 1 per cent of the mass of the disc. Model C5 is the corresponding free fall experiment, where the mass of the cluster is 10 per cent of the mass inside the sphere of radius . Models C5b and C5c are identical to model C5, but the falling masses correspond to a 20 per cent and a 50 per cent of the mass inside the sphere of radius , respectively. Model S1 corresponds to a Plummer sphere that is born with all its mass, but with an initial scalelength equal to the scalelength of the disc, . This scalelength is shrunk according to
| (3) |
where is the final value of the scalelength, after a time equal to the crossing time of the final Plummer sphere. This model corresponds to a cluster similar to that of the last numerical experiment of FKE06 (by the way, there is probably an error in their Equation (3), since at the Plummer radius is not the initial radius). Model S1b is similar to model S1 but with the initial Plummer radius reduced to a sixth, in order to probe whether the size of the initial radius has any influence in the capture of mass during the shrinking stage.
The experiments were run until , corresponding to almost one period of the cluster when put in a circular orbit of radius . The code used was a FORTRAN77MPI version of the paralellized tree code of Viturro and Carpintero (2000). It ran in a cluster of twenty-four 1.86 GHz processors; each experiment took approximately hours of CPU time.
In order to assess which particles were added to a cluster when modelled as a Plummer sphere, following FKE06, we computed the energy of the particles with respect to the sphere, as well as the tidal radius of the latter. We then considered as acquired by the cluster those particles with both negative energy and position inside . In order to determine the value of for each experiment, we followed the working out of Binney and Tremaine (2008, §8.3.1), but replacing the acceleration of a point mass galaxy by that of our disk plus halo system, and the acceleration of a point mass satellite by that of our cluster. The resulting equation is:
| (4) |
where , is the mass of the halo inside distance of its center, is the mass of the cluster inside distance of its center, and is the squared circular velocity of the disk at a distance of its center given by (see, e.g. Binney and Tremaine, 2008)
| (5) |
where is the surface density of the disc, and , , and are modified Bessel functions. The value of that satisfies Eq. (4) is our tidal radius .
We also used the tidal radius as one of the criteria to define membership in the free fall models. In these cases, however, we have replaced in Eq. (4) by , that is, the total mass of the cluster. This amounts to considering the cluster as a point mass, which is a good approximation provided that the free fall has already finished and that its radius is smaller than the computed —that was the case in all the experiments. The other criterion, negative energy, was computed by first finding which particles were geometric neighbours of the center of the free fall with the aid of a friend-of-friend algorithm, taking 0.70 of the mean interparticle distance of the 90 per cent most bounded disc particles as the fiducial maximum neighbour distance, which sufficed to neatly isolate the cluster from its surroundings. We then computed the energy of these particles with respect to the set, and discarded those with positive energy and/or outside the tidal radius. This step –computation of the energy and discarding– was repeated with the remaining particles until only particles inside the tidal radius and with negative energy were left; these particles were considered the members of the cluster. Also, during the free fall, the list of members was considered empty, since the tidal radius along that period is not well defined.
4 Results

Fig. 3 shows the percentage of trapped particles of the basic models P1 and C1, when the orbit of the cluster is at (models P2 and C2), and when the mass of the cluster is half and one and a half that of models P1 and C1 (models P3, C3, P4 and C4, respectively). It is clearly seen that the analytical Plummer model traps more mass than the free fall in all the cases, that is, the trapped mass depends on whether the mass of the cluster is taken from outside the galaxy or from the galaxy itself. Model P3 (the less masive Plummer model) is the only one that captures a mass comparable with the free fall models (but substantially larger than that captured by its equivalent model C3). In all cases, the fluctuations in the captured mass after the cluster finished its growth are due to particles close to the tidal radius and with energies close to zero, therefore oscilating between trapped and non trapped stages.
Table 1 shows in its last column the mass acquired by the cluster in each experiment, as a fraction of the mass of the cluster or . These data were taken at a representative time , that is, after about two thirds of an orbit of the cluster since its birth, a long enough interval compared to the growing time of any of the models. Clearly, all the free fall models captured considerably less mass than the corresponding Plummer models. We can see that there is no significant difference between model P1 and model P1b; therefore, the accreted mass does not depend significantly on the details of the final scalelength of the Plummer sphere. We can also see that model C2b traps more mass than model C2: as we had anticipated, it is the expected behaviour when a larger initial radius is used. Model C2c, on the other hand, having a smaller than model C2, acquires a little less mass than the latter.
The heavy models P5, C5, C5b and C5c also show the same trends. Although in the case of model C5 the trapped mass is of the same order of that in the corresponding Plummer model, the other two acquired much less mass. These models clearly show that the percentage of trapped mass depends on how the mass of the cluster is gathered from the galaxy: the smaller the region of ambient mass that is used to build the cluster, the more additional mass is acquired after the cluster is formed.
Finally, the trapped mass of the experiments S1 and S1b, as expected, is almost the same as in model P1, that is, the shrinking of the scalelength of the Plummer sphere has no effect whatsoever on the accumulated mass, as could be expected from our discussion of Section 2. Besides, since the crossing time of the original cloud is reduced by to one–sixth when going from model S1 to model S1b (from 1.54 units of time to 0.25), whereas the shrinking time is held constant (equal to the crossing time of the final configuration, 0.175 units of time), a typical galactic star can cross almost the entire radius of the cloud in the time that that cloud reduces its size. Therefore, the assumption of instant collapse, adopted in the discussion of Section 2, is not critical.
5 Conclusions
Our results confirm the finding of FKE06 that, during the formation of a supercluster in a dwarf galaxy, some mass can be additionally gained from trapped disc stars and that the capture process essentially ends with the formation of the cluster, with virtually no gains afterwards; the exceedingly small amount of captures by an already formed cluster has been also found by Mieske and Baumgardt (2007).
Nevertheless, while FKE06 do not assign much importance to the process of formation of the cluster and simply simulate it with a mass that grows linearly with time from zero to its final value, we consider that the details of such process are crucial for the trapping dynamics. We have shown in Section 2 that, in particular, creating the mass of the cluster from nothing originates forces and potentials fairly different from those that appear when the cluster is formed concentrating matter already present in the galaxy and that, as a result, less trapping should be expected from the latter scenario.
We performed several numerical simulations similar to those of FKE06, where the mass of the cluster is created out of nothing (our P models), together with others that only differ from the former in that the cluster is formed concentrating mass from the galaxy (our C models). In all cases, the mass gained by the C models was smaller than that gained by the P models, the most extreme examples being those of models C2c and C4 which gain only about one–fifth of the mass gained by their equivalent models P2 and P4, respectively.
The difference in gain depends critically on the size of the primordial cloud from which the C models get their cluster material: the smaller the primordial cloud, the larger the difference in gained material. Since in our models the mass taken from the cloud to build the cluster is uniformly distributed all over the cloud, the size of the cloud correlates inversely with the fraction of mass taken, i.e., the larger the fraction of mass the smaller the cloud. Most of our models take that fraction between 0.05 and 0.20, i.e., one might assume that that is the fraction of gas in the galaxy and that all the gas within a certain region (our primordial cloud) collapses to form the cluster. As a result, the less massive clusters are formed from smaller regions and for them the differences between the mass creation and mass concentration scenarios are the largest. On the other hand, our model runs into trouble for the most massive superclusters. To create a supercluster with one–hundredth the mass of the galaxy we need either to assume an implausibly high fraction of collapsing mass of 0.50 (model C5c) or, for a more reasonable fraction of 0.10 (C5) or 0.20 (C5b), to accept that the mass comes from a primordial cloud of radius ( kpc) or ( kpc), respectively. Now, clouds of such size should be suffering the effect of the differential rotation and the tidal forces of the galaxy, making very unlikely their collapse to form the supercluster. The formation of such a huge supercluster probably proceeds by separate stages, with smaller clusters being formed first and later coallescing to create the supercluster, so that the amounts of trapping predicted for this case by the simple models of FKE06 and ours should be regarded, at best, as very doubtful.
Cluster formation is certainly a very complex process with effects ignored by the models of FKE06 and ours, such as gas dynamics and magnetic fields playing a significant role (see, e.g. Stahler and Palla, 2004), and supercluster formation is probably even more complex. It is clearly an understatement to say that our models are only a very crude representation of the dynamics of this process, but our point is precisely that, since the trapping takes place during the cluster formation, it is vital to take into account the details of that process to correctly evaluate the amount of matter trapped. Crude as they are, our models have over those of FKE06 the big advantage that they use mass already present in the galaxy in a way that is undoubtedly far from how real clusters are formed, but which is certainly closer to reality than creating mass from nothing. Moreover, the results of our models confirm what a simple reasoning suggests, i.e., the amount of matter trapped in our somewhat more realistic scenario of mass concentration is substantially smaller than that which results from creating the mass of the cluster out of nothing.
Acknowledgments
The technical assistance of Ruben E. Martínez and Héctor R. Viturro and helpful discussions with G. L. Bosch on cluster formation are gratefully acknowledged. This work was done with the support of grants from the Universidad Nacional de La Plata, the Agencia Nacional de Promoción Científica y Tecnológica and the Consejo Nacional de Investigaciones Científicas y Técnicas de la República Argentina (CONICET). In particular, the cluster of twenty four processors (Athena) used for this work was built and configured by H. R. Viturro, and paid with those grants.
References
- Barnes (1992) Barnes J.E., 1992, ApJ, 393, 484
- Binney and Tremaine (2008) Binney J., Tremaine S., 2008, Galactic Dynamics, Princeton University Press, Princeton
- (3) Fellhauer M., Kroupa P., Evans N. W., 2006, MNRAS, 372, 338
- Mieske and Baumgardt (2007) Mieske S., Baumgardt H., 2007, A&A, 475, 851
- Spitzer (1942) Spitzer L., 1942, ApJ, 95, 329
- Stahler and Palla (2004) Stahler S. W., Palla F., 2004, The Formation of Stars, Wiley–VCH, Federal Republic of Germany
- Viturro and Carpintero (2000) Viturro H. R., Carpintero D. D., 2000, A&AS, 142, 157