21-cm absorbers at intermediate redshifts.
Abstract
Damped Lyman- systems (DLAs) seen in the spectra of high- QSOs allow us to probe the physical conditions in protogalaxies. Our understanding of physical conditions in DLAs at high- is primarily based on the absorption lines of H2 molecules and fine-structure transitions. Another important way of probing the thermal state of interstellar medium in these systems is by studying the 21-cm absorption in the spectra of background quasars. Here we report the main results of our GMRT survey to search for 21-cm absorption in a representative and unbiased sample of 35 DLA candidates at 1.101.45. Our sample of DLA candidates is drawn from the strong Mg ii systems in SDSS DR5 and has resulted in discovery of 9 new 21-cm absorbers. Prior to our survey only one 21-cm absorber was known in the redshift range: 0.72. This survey has allowed us to investigate the dependence of detectability of 21-cm absorption on the properties of UV absorption lines detected in SDSS spectra and estimate the number per unit redshift of 21-cm absorbers. Our GMRT survey provides a representative sample of systems that can be used in combination with various follow-up observations: (1) for investigating the physical conditions in the absorbing gas using spin temperature (TS) measurements, (2) for investigating the effect of metallicity and dust content on the detectability of 21-cm absorption, (3) for studying the morphology of the absorbing gas and (4) for probing the time evolution of various fundamental constants. Results from the first phase of our survey are presented in Gupta et al. (2007). Detailed description of the entire sample and results from the survey are presented in Gupta et al. (2009).
1Australia Telescope National Facility, CSIRO, Australia
2IUCAA, India
3Institut d’Astrophysique de Paris-CNRS, France
4NCRA-TIFR, India
1. Introduction
Observations of high- galaxies suggest that the global comoving star-formation rate density peaks at and then sharply decreases towards (e.g. Madau et al. 1996, Hopkins 2004). The determination of the mass density of the gas and its content (molecules, dust and cold H i gas) over the same redshift range provides an independent and complementary understanding of the redshift evolution of star-formation at similar epochs. While the H i content of galaxies can be best probed by the surveys of 21-cm emission, limited sensitivity of current radio telescopes does not allow them to reach beyond the local Universe (e.g., Zwaan et al. 2005). On the contrary, detection of H i in the spectra of distant QSOs in the form of damped Lyman- absorption provides a luminosity unbiased way of probing the evolution of the H i content in the universe (Wolfe, Gawiser & Prochaska 2005).
Our understanding of physical conditions in DLAs at is largely based on the analysis of H2 and/or atomic fine-structure transitions (Ledoux, Petitjean & Srianand 2003). Unfortunately for the time being the above mentioned tracers can not be used to probe the physical state of the absorbing gas at because the useful transitions are located below the atmospheric cut-off. It has been shown by Rao, Turnskek & Nestor (2006) that DLAs essentially have Mg ii rest equivalent width, Wr(Mg ii)0.6Å. Therefore, the search of 21-cm absorption in a sample of strong Mg ii absorbers is an unique way to probe the redshift evolution of physical conditions in DLAs like absorption systems at intermediate and low-.
2. Our GMRT sample
Our sample is drawn from the identification of strong Mg ii systems, Wr(Mg ii )1.0Å, by Prochter, Prochaska & Burles (2006, hereafter P06) in SDSS DR3 and by us using our automatic procedure for additional systems in DR5. We select the absorbers that are in the redshift range: 1.101.45 such that the redshifted 21-cm frequency lies in the GMRT 610-MHz band. GMRT is the only radio telescope available at present in the relatively RFI-clean environment (say compared to Green Bank Telescope or Westerbork Synthesis Radio Telescope) for covering this redshift range. These absorbers are then cross-correlated with NVSS and FIRST surveys to select the Mg ii absorbers in front of compact radio sources brighter than 50 mJy and hence suitable for the 21-cm absorption search. We plot in Fig. 1 the redshift distribution of the 35 Mg ii absorption systems observed as part of our GMRT survey along with the sample of Lane (2000). Latter is the only large survey at low- for which both detections and non-detections are systematically reported. It includes 62 systems observed with the WSRT and 10 other systems from the literature satisfying their selection criterion (see Lane 2000 for details). The detections shown as a hatched histogram include detections reported in Lane (2000) together with detections from better quality data by Kanekar & Chengalur (2003) and Curran et al. (2007) for systems that were originally reported as non-detections. In the same figure, the filled histogram shows the distribution of Mg ii systems in our GMRT sample. For equivalent width cutoff of 1Å, our GMRT sample has more than twice the number of systems investigated by Lane (2000).
We observed 35 Mg ii systems with GMRT 610-MHz band using in total 400 hrs of telescope time mostly spread over the years 2006-2008. For our survey, we have usually used the 1 MHz baseband bandwidth split into 128 frequency channels yielding a spectral resolution of 4 km s-1. GMRT data were reduced using the NRAO Astronomical Image Processing System (AIPS) following the standard procedures.
3. Results and Discussion
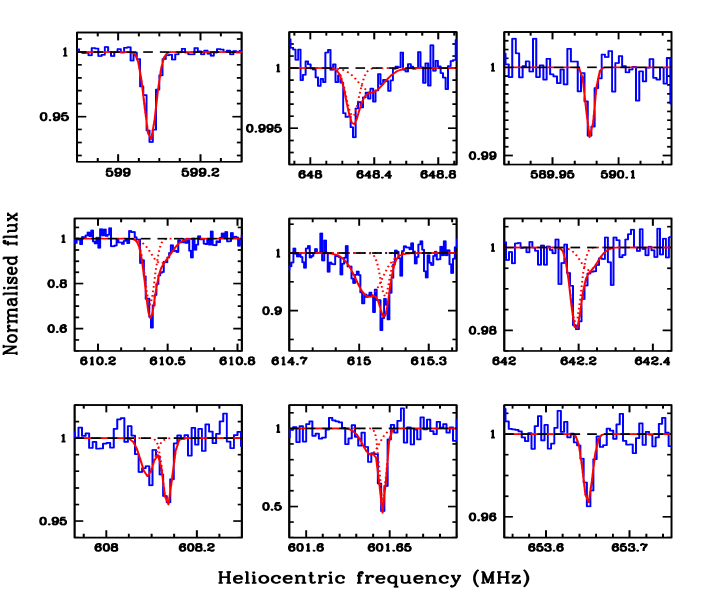
We present the results of a systematic Giant Metrewave Radio Telescope (GMRT) survey of 21-cm absorption in a representative and unbiased sample of 35 strong Mg ii systems in the redshift range: 1.101.45, 33 of which have W1 Å. The survey using 400 hrs of telescope time has resulted in 9 new 21-cm detections and good upper limits for the remaining 26 systems (Fig. 2). This is by far the largest number of systems detected in a single systematic survey in a narrow redshift range. Two of these systems also show 2175 Å dust feature at the redshift of the absorbers (Srianand et al. 2008). Results from the first phase of our survey are presented in Gupta et al. (2007). Detailed description of the entire sample and results from the survey are presented in Gupta et al. (2009). In the following we summarise the main results.
We study the dependence of detectability of 21-cm absorption on different properties of the UV absorption lines detected in the SDSS spectra (Fig. 3). We find that if absorption systems are selected with a Mg ii doublet ratio, DR 1.3, and a ratio Wr(Mg i)/Wr(Mg ii) 0.3, the success rate for 21-cm detection is very high (up to %; see right panel of Fig. 3). We notice that the detections found in a low- sample by Lane (2000) also obey these joint constraints (see left panel of Fig. 3). In our sample, we find an apparent paucity of 21-cm absorption among systems with Wr(Mg ii2796)1.8 Å, the median Wr of our sample. This is contrary to what has been seen at low- (Lane 2000). Interestingly most of these high Wr systems have high DR and low values of Wr(Mg i)/Wr(Mg ii). This strongly suggests that the equivalent width in these systems is dominated by velocity spread and not by line saturation.
We estimate the number of 21-cm absorption systems per unit redshift interval for a given limiting value of the integrated 21-cm optical depth and Wr(Mg ii2796). We show that the fraction of Mg ii systems with 21-cm absorption and the number per unit redshift decrease from to . The decrease is larger when we use higher equivalent width cutoff. Using a sub-sample of compact sources, with high frequency VLBA observations available, we show that this can not be accounted for by simple covering factor effects. As mentioned above and based on the available data, it appears that most likely the main reason behind this cosmological evolution is the decrease of the CNM covering factor (and volume filling factor) in the strong Mg ii absorbers. Indeed, it is known that the number of Mg ii systems per unit redshift increases with increasing redshift. The evolution is steeper for stronger systems (Steidel & Sargent, 1992 and P06 for recent reference). Using the data of Steidel & Sargent (1992), Srianand (1996) found that the strongest redshift evolution was seen among the Mg ii absorbers with Wr(Fe ii)2383/Wr(Mg ii)27960.5. This clearly means the physical conditions in strong Mg ii absorbers are different at high and low-.
We have estimated the velocity spread of the 21-cm absorption systems using the apparent optical depth method (Ledoux et al. 2006). We do not find any statistically significant correlation between Wr(Mg ii2796) and the 21-cm velocity width in our sample. A marginal correlation is found for the low- sample. The absence of correlation in the high- sample is related to the lack of 21-cm absorbers among Mg ii systems with Wr(Mg ii)1.8 Å in the GMRT sample. This is probably due to a true evolution with redshift of the physical state of the Mg ii systems and consistent with the idea that the Mg ii equivalent width is mostly correlated with the overall kinematics of the gas in the absorbing system and not with the column density in the component associated with the cold gas. When high spectral resolution data are available, we note that the 21-cm absorption is not always associated with the strongest Mg ii component.
We selected systems with W1 Å but detected by chance a 21-cm absorption in a system with Wr = 0.43 Å(at = 1.3710 toward J01080037). Efforts are underway at GMRT to extend our survey to weaker (W1 Å ) Mg ii systems. This will be crucial for understanding the physical state of Mg ii systems and to determine the detectability of 21-cm absorption versus Wr. Ideally one would like to estimate the number density of 21-cm absorbers and measure the cosmological evolution without preselection from the UV absorption lines. This can be achieved only by a blind survey of 21-cm absorption in front of radio loud QSOs. It will be possible to embark upon such a survey with the upcoming Square Kilometer Array (SKA) pathfinders such as the Australian Square Kilometer Array Pathfinder (ASKAP) and Karoo Array Telescope (meerKAT). In particular, the ASKAP with its instantaneous wide bandwidth of 300 MHz and large field of view (30 degree2) is an ideal instrument for this (Johnston et al. 2008). An ASKAP survey with 150 pointings of 16 hrs each (i.e 2400 hrs in total) in the 700-1000 MHz frequency band would yield detection of 100 to 250 intervening 21-cm absorbers in the redshift range 0.41.
As the energy of the 21-cm transition is proportional to , high resolution optical and 21-cm spectra can be used together to probe the combined cosmological variation of these constants (Tubbs & Wolfe 1980). Our GMRT survey provides systems in a narrow redshift range in which this measurement can be done. Thus high resolution optical spectroscopy of the corresponding QSOs are suitable to perform this test at .
Acknowledgments.
We thank Rajaram Nityananda for useful discussions and DDTs, and the GMRT staff for their co-operation during the observations. GMRT is run by the National Centre for Radio Astrophysics of the Tata Institute of Fundamental Research. We acknowledge the use of SDSS spectra from the archive (http://www.sdss.org/) and the radio images from NVSS and FIRST surveys.
References
- (1) Curran S.J., Tzanavaris P., Murphy M.T., Webb J.K., Pihlstrom Y.M., 2007, MNRAS, 381, L6
- (2) Gupta N., Srianand R., Petitjean P., Khare P., Saikia D.J., York D.G., 2007, ApJ, 654, L111
- (3) Gupta N., Srianand R., Petitjean P., Noterdaeme P., Saikia D.J., 2009, MNRAS, Submitted
- (4) Hopkins A.M., 2004, ApJ, 615, 209
- (5) Johnston S., et al., 2008, ExA, 22, 151
- (6) Kanekar N., Chengalur J.N., 2003, A&A, 399, 857
- (7) Lane W., 2000, PhD Thesis, University of Groningen
- (8) Ledoux C., Petitjean P., Srianand R., 2003, MNRAS, 346, 209
- (9) Ledoux C., Petitjean P., Fynbo J.P.U., Moller P., Srianand R., 2006, A&A, 457, 71
- (10) Madau P., Ferguson H.C., Dickinson M.E., Giavalisco M., Steidel C.C., Fruchter A., 1996, MNRAS, 283, 1388
- (11) Prochter G.E., Prochaska J.X., Burles S.M., 2006, ApJ, 639, 766
- (12) Rao S.M., Turnshek D.A., Nestor D.B., 2006, ApJ, 636, 610
- (13) Srianand R., 1996, ApJ, 462, 643
- (14) Srianand R., Gupta N., Petitjean P., Noterdaeme P., Saikia D.J., 2008, MNRAS, 391, L69
- (15) Steidel C.C., Sargent W.L.W., 1992, ApJS, 80, 1
- (16) Tubbs A.D., Wolfe A.M. 1980, ApJ, 236, L105
- (17) Wolfe A.M., Gawiser E., Prochaska J.X., 2005, ARA&A, 43, 861
- (18) Zwaan M.A., Meyer M.J., Staveley-Smith L., Webster R.L., 2005, MNRAS, 359, L30