Effective nucleon mass and the nuclear caloric curve
Abstract
Assuming a schematic form of the nucleon effective mass as a function of nuclear excitation energy and mass, we provide a simple explanation for understanding the experimentally observed mass dependence of the nuclear caloric curve. It is observed that the excitation energy at which the caloric curve enters into a plateau region, could be sensitive to the nuclear mass evolution of the effective nucleon mass.
pacs:
25.70.Pq, 25.70.MnThe experimentally observed “plateau” in the nuclear “caloric curve” (temperature versus excitation energy) has long been seen as a signature of liquid-gas phase transition, similar to that in real fluids. Recently, Sobotka et al. SOB04 ; SOB06 , have shown that the plateau in the nuclear caloric curve is a consequence of a combined effect of decreasing density due to thermal expansion, and the evolution of in-medium nucleon effective mass, rather than an indication of liquid-gas phase coexistence. This model for describing the caloric curve is based on the relaxation of density profile of the mononucleus that results in maximum entropy under a local density approximation for the level density parameter. A parametric form of the base density was assumed and the entropy was calculated in the Fermi-gas model. The evolution of effective mass with density and excitation was included in a schematic fashion as it is currently unknown.
The plateau in the caloric curve from this model is established at a rather modest excitation energy (about 2 MeV/nucleon), well below the excitation energy where the experimentally observed caloric curve enters into a plateau region. Also, the value of the plateau temperature remains the same for a mass, = 90 system as it does for a mass, = 197 system. However, experimentally determined caloric curve NAT02 shows plateau temperature that decreases with increasing mass, .
In this work, we investigate how the mass dependence of the caloric curve, can be understood using the above concept of effective nucleon mass and thermal expansion in a simple phenomenological approach. In particular, we present a schematic expression to understand the experimentally observed plateau in the caloric curve, and show that the observed mass dependence of the caloric curve can be reproduced using effective nucleon mass as a function of excitation energy, that is mass dependent.
We begin with the assumption that the relation between the temperature, , and the experimentally measured total excitation energy, , for an expanding nucleus of mass , can be expressed by a form analogous to that for the Fermi gas,
| (1) |
where is the inverse nuclear level density parameter of the hot and dilute nucleus at density , and written as,
| (2) |
where, , is the Fermi energy of the finite and expanding nucleus and given as,
| (3) |
The quantity , is the ratio of the effective mass of the nucleon to the mass of the free nucleon, assuming the nucleus to be a Fermi gas and at ground state ( = 0). The quantity is the ratio of the effective mass of the nucleon to the mass of the free nucleon, in hot ( 0) and expanding finite nucleus density .
From the above equations, one can write the inverse nuclear level density parameter of the hot and dilute nucleus as NOR02 ,
| (4) |
where, 15, is the inverse level density parameter of uniform, nondissipative Fermi gas. , and are the Fermi energy and the nuclear saturation density at = 0 MeV.
From the above two expressions, Eqs. 1 and 4, one can write the temperature versus the excitation energy for a nucleus expanding to an equilibrium density ,
| (5) |
Alternatively, one can also start with the assumption that the total excitation energy , of an expanding nucleus can be written as,
| (6) |
where, is the thermal part of the excitation energy, and is the expansion energy of the finite nucleus. The expansion energy assumed in the above expression is a simple upside down bell shaped, suggested by Friedman FRI88 , with the ground state binding energy, = 8 MeV. The temperature versus the total excitation energy relation for a nucleus expanding to an equilibrium density, , can then be written as,
| (7) |
Using equations, 5 and 7, we can now study the experimental caloric curve and its mass dependence.
Fig. 1 shows the experimentally measured caloric curve for the mass range of = 100 - 140, from various measurements compiled by Natowitz et al. NAT02 . The data from all different measurements are shown collectively in the figure by inverted triangle symbols and no distinction is made between them. The dotted (black) curve in the figure is the simple Fermi gas relation, , with the inverse level density parameter, = 15. The results of the equations 5 and 7 are shown by the solid (blue) and dashed (red) curves, respectively. In both equations, the density , for a given excitation energy , was taken to be that adopted by Bondorf et al. BON85 ; BON98 (shown by the solid black curve in Fig. 2(b)).
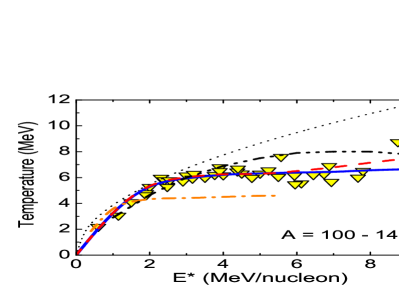
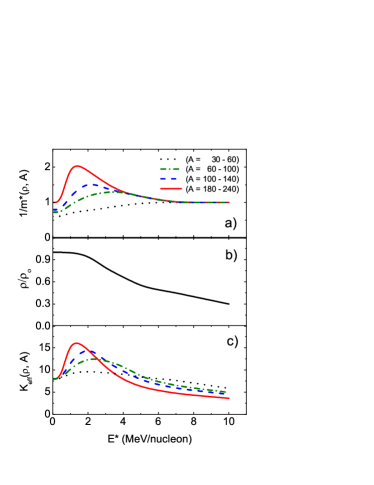
The effective mass , as a function of excitation energy was assumed to have an empirical dependence of the form shown by the dashed (blue) curve in Fig. 2(a). From Fig. 1, one observes that Eq. 5 (solid, blue curve) and Eq. 7 (dashed, red curve) with the same effective mass and density dependence of the excitation energy gives similar results up to excitation energy of 6 MeV/nucleon, with a small difference at higher excitation energies. The difference at higher energies is due to the different form of the expansion energy assumed in the two expressions. Both calculations, show a plateau at excitation energy above 3 MeV/nucleon, in good agreement with the experimental data.
| Mass () | ||
|---|---|---|
| 30 - 60 | 0.87 | |
| 60 - 100 | 0.73 | |
| 100 - 140 | 0.67 | |
| 180 - 240 | 0.53 |
The caloric curve obtained from Eq. 5 and 7 is in much better agreement with the data compared to those obtained by Sobotka et al. SOB06 . The result of Sobotka et al., is shown by the dot-dashed (orange) curve. Also shown in the figure is the result of De et al. DE06 , for = 150 (dot-dot-dashed, black curve). The calculation of De et al. uses a realistic effective Hamiltonian to calculate the base density profile in a Thomas-Fermi framework with the entropy calculated microscopically. The above comparison shows that the phenomenological expressions 5 and 7 can be used to understand the characteristic features of the caloric curve.
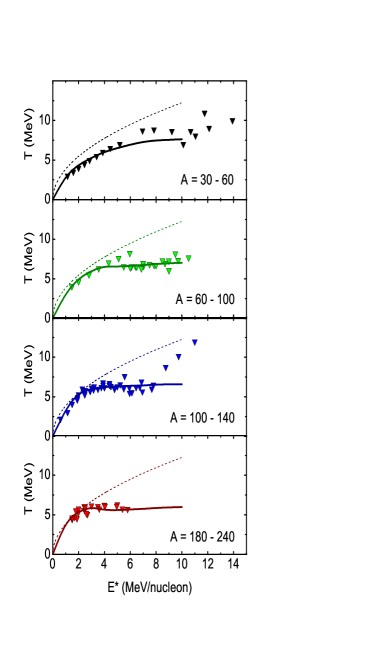
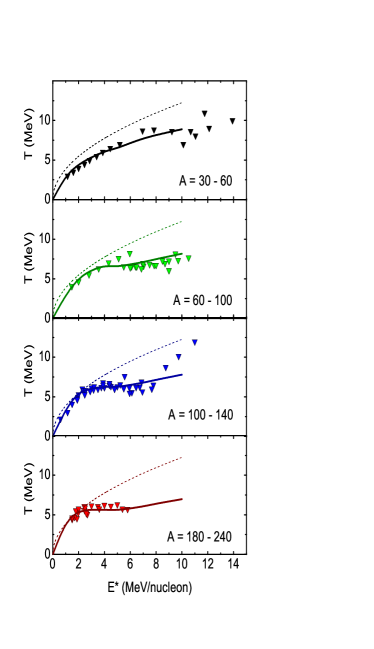
In the following we use Eq. 5 and 7, to study the mass dependence of the caloric curve. Fig. 3 and 4 shows the experimental caloric curve data (inverted triangles) for the different mass ranges obtained from the work of Natowitz et al. NAT02 . The results of Eq. 5 and 7 are shown by the solid curves in Fig. 3 and 4, respectively. The empirical form of the effective nucleon mass and the density as a function of excitation energy used in Eq. 5 and 7 for different mass regions are as shown in Fig. 2(a) and 2(b). These were obtained by tuning the data with a fixed parameter. The effective mass for the ground state nucleus , is as shown in Table I. The choice of the value was dictated by its sensitivity to the temperature at which the caloric curve reaches the plateau region. This is discussed in the following paragraph. The Fermi gas caloric curve is shown by the dotted curves in Fig. 3 and 4.
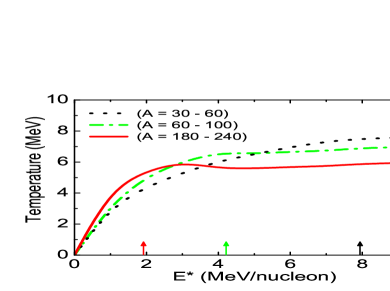
An important point to note in Fig. 3 and 4 is the evolution of the excitation energy of the entry point into the caloric curve plateau with nuclear mass. To illustrate this point more clearly, we show in Fig. 5, a comparison between the caloric curves for = 30 - 60, = 60 - 100, and = 180 - 240 mass regions, obtained using Eq. 5. The arrows in the figure correspond to the approximate values of the excitation energy at which the caloric curve for each of the three masses enter into a plateau region. The figure shows that the temperature at which the plateau is reached is sensitive to the value of the . A higher results in higher plateau temperature for lighter mass. The excitation energy at which the plateau is reached is, on the other hand, sensitive to the mass dependence of the effective nucleon mass, . This excitation energy corresponds to the energy at which the 1/, shown in Fig. 2(a), peaks. The shift in the peak to higher excitation energy for decreasing mass of the system results in a plateau being reached at higher excitation energy for lighter mass. To explain the experimentally observed caloric curve, effective nucleon mass ratio that is dependent on the excitation energydensity and the nuclear mass therefore seems imperative. The effective nucleon mass as a function of excitation energy for different masses, shown in Fig. 2(a), and used in the above analysis, is an empirical deduction. At present, we do not know of any formal approach to deduce such a dependence. Qualitatively such a dependence is expected in the interior of the nucleus, where the effective mass is reduced in the bulk, peaks at the surface and reduces to one with decreasing density and increasing excitation energy HAS86 . In such a prescription, the effective nucelon mass is often given by phenomenological expressions that includes a momentum dependent and a frequency dependent term. The detailed density and excitation energy dependence of these terms are unknown. Theoretical investigation in this direction would therefore be interesting. While a formal understanding of the effective nucleon mass as a function of excitation energy and density over a range of nuclear mass would be very fruitful, the emperical approach utilizing the caloric curve in this work can aid in studying the isospin () dependence of the effective mass in asymmetric nuclei.
In the following we show that the mass dependence of the inverse level density parameter , obtained using the above empiricaly deduced effective nucleon mass, , is consistent with the experimentally and theoretically deduced inverse level density parameter at low exciation energy. In the past, temperature dependence of the nuclear level density parameter has been investigated extensively by studying the spectra of light particles emitted in hot nuclei populated at 1 MeV/nucleon ( 2 MeV). It has been shown from these studies NEB86 ; HAG88 that the inverse level density parameter , increases from 8 to 13 for temperature increasing from = 2 MeV to = 5.5 MeV in nuclei of mass 160. However, similar studies CHB91 ; FOR91 ; YOS92 carried out for light nuclei, such as 40, failed to show an increase. The remaining nearly constant at 9 - 10 in the excitation energy range of 2.5 to 5.0 MeV/nucleon. In Fig. 2(c), we show the effective inverse level density parameter, , of the hot and dilute nucleus for various mass regions obtained from the present analysis. For = 0 MeV, one observes that the inverse level density parameter, 8, in agreement with the low excitation energy studies. For light nuclei, = 30 - 60, the remains essentially constant up to excitation energy of 5 MeV/nucleon. While for heavier nuclei it varies between 8 and 16 for excitation energies below 2 - 3 MeV. Similar dependence was also obtained from the theoretical calculations of Ref. SHL91 ; DE98 that investigated the mass dependence of the level density parameter at low exciation energy. For higher excitation energies, Fig. 2(c) shows a steady decline in the inverse level density parameter, which results in a plateau like behavior in the caloric curve (temperature versus excitation energy plot) for the hot and expanding nucleus.
In conclusion, it is shown that the mass dependence of the nuclear caloric curve can be modelled using Equations 5 and 7, with the effective nucleon mass of the form shown in Fig. 2(a), or alternatively, using Eq. 1 with the inverse level density parameter of the form shown in Fig. 2(c). The mass dependence of the inverse level density parameter thereby obtained is consistent with the experimentally and theoretically deduced level density parameter for low excitation energies. Furthermore, the present study demonstrates that the caloric curve can be used as a tool to fine tune the effective nucleon mass and study the nuclear interaction. A natural extension of the present study would be to apply the present approach to fine tune the effective mass further by including the isospin () dependence. Such a study would require caloric curve measurements of asymmetric ( 1) nuclei using beams of radioactive nuclei. This would provide a complete understanding of the interaction under extreme conditions of excitation energy, density and isospin ().
This work was supported in part by the Robert A. Welch Foundation through grant No. A-1266, and the Department of Energy through grant No. DE-FG03-93ER40773.
References
- (1) L.G. Sobotka, R.J. Charity, J. Toke, and W.U. Schroder, Phys. Rev. Lett. 93, 132702 (2004).
- (2) L.G. Sobotka and R.J. Charity, Phys. Rev. C 73, 014609 (2006).
- (3) J.B. Natowitz, R. Wada, K. Hagel, T. Keutgen, M. Murray, A. Makeev, L. Qin, P. Smith, and C. Hamilton, Phys. Rev. C 65, 034618 (2002).
- (4) W. Norenberg, G. Papp, and P. Rozmej, Eur. Phys. J. A14, 43 (2002).
- (5) W.A. Friedman, Phys. Rev. Lett. 60, 2125 (1988).
- (6) J.P. Bondorf, R. Donangelo, I.N. Mishustin, and H. Schulz , Nucl. Phys. A444, 460 (1985).
- (7) J.P. Bondorf, A.S. Botvina, and I.N. Mishustin, Phys. Rev. C 58, 27 (1998).
- (8) J.N. De, S.K. Samaddar, X. Vinas, and M. Centelles, Phys. Lett. B638, 160 (2006).
- (9) R.W. Hasse and P. Schuck, Phys. Lett. B179, 313 (1986).
- (10) G. Nebbia et al., Phys. Lett. B 176, 20 (1986).
- (11) K. Hagel et al., Nucl. Phys. A486, 429 (1988).
- (12) A. Chbihi, L.G. Sobotka, N.G. Nicolis, D.G. Sarantities, D.W. Stracener, Z. Majka, D.C. Hensley, J.R. Beene, and M.L. Halbert, Phys. Rev. C 43, 666 (1991).
- (13) B. Fornal et al., Phys. Rev. C 44, 2588 (1991).
- (14) K. Yoshida et al., Phys. Rev. C 46, 961 (1992).
- (15) S. Shlomo and J.B. Natowitz, Phys. Rev. C 44, 2878 (1991).
- (16) J.N. De, S. Shlomo, and S.K. Samaddar, Phys. Rev. C 57, 1398 (1998).