Nernst effect as a probe of superconducting fluctuations in disordered thin films
Abstract
In amorphous superconducting thin films of and , a finite Nernst coefficient can be detected in a wide range of temperature and magnetic field. Due to the negligible contribution of normal quasi-particles, superconducting fluctuations easily dominate the Nernst response in the entire range of study. In the vicinity of the critical temperature and in the zero-field limit, the magnitude of the signal is in quantitative agreement with what is theoretically expected for the Gaussian fluctuations of the superconducting order parameter. Even at higher temperatures and finite magnetic field, the Nernst coefficient is set by the size of superconducting fluctuations. The Nernst coefficient emerges as a direct probe of the ghost critical field, the normal-state mirror of the upper critical field. Moreover, upon leaving the normal state with fluctuating Cooper pairs, we show that the temperature evolution of the Nernst coefficient is different whether the system enters a vortex solid, a vortex liquid or a phase-fluctuating superconducting regime.
pacs:
74.81.Bd, 72.15.Jf, 74.25.Fy1 Introduction
Those past years have witnessed the emergence of the Nernst effect as an important probe of superconducting fluctuations, following the observation of an anomalous Nernst signal in the high temperature phase of underdoped cuprates [1]. Because of the small superfluid stiffness expected in underdoped cuprates[2], and because vortices are a well-known source of a Nernst response[3], these authors proposed the vortex-like excitations of a phase-disordered superconductor as a natural source of this Nernst signal[4].
This discovery motivated numerous experimental and theoretical works on the Nernst effect. On one hand, numerous studies on correlated metals of various families resolved an unexpectedly large Nernst coefficient (for a review see [5]). In some cases, this was in total absence of superconductivity. The most illuminating example was bismuth, the semi-metallic element in which Nernst and Ettingshausen discovered in 1886 the effect which bears their name[6]. The Nernst coefficient in bismuth[7] is three orders of magnitude larger than what is typically seen in any type II superconductor. In fact, the large magnitude of the Nernst coefficient in bismuth is in agreement with the implications of the semiclassic transport theory[8, 5, 9] and therefore, a large Nernst signal does not necessarily imply superconducting fluctuations [either of phase or amplitude of the order parameter].
On the other hand, this led to the first theoretical study of the Nernst response of fluctuating Cooper pairs[10]. These fluctuations are usually described in the Gaussian approximation within the Ginzburg-Landau framework[11] and are known to give rise to the phenomena of paraconductivity[12], i.e. an excess of conductance due to short lived Cooper pairs in the normal state, and to the so-called fluctuations diamagnetism[13]. Theoretical calculations by Ussishkin, Sondhi and Huse (USH)[10] have shown that Cooper pair fluctuations should also produce a sizable Nernst signal, despite the absence of well defined vortex-like excitations.
This prediction was put to test through measurements of the Nernst effect in amorphous thin films of superconductors. The normal state of these systems is a simple dirty metal with a totally negligible Nernst response. These last studies[14, 15, 16] demonstrated that the Nernst signal of amorphous superconducting films is exclusively generated by superconducting fluctuations, thus, providing a remarkable testboard for theories. In quantitative agreement with USH theory close to , these measurements established that conventional Gaussian fluctuations does indeed generate a Nernst signal.
Following this observation, we now need to learn how to distinguish other regimes of superconducting fluctuations from those simple Cooper pair fluctuations, in particular, regimes with only thermal or quantum fluctuations of the phase of the Superconducting Order Parameter (SOP) as expected in the underdoped cuprates, or in the vicinity of quantum superconductor-insulator transitions. Furthermore, in presence of an applied magnetic field, we want to learn how to distinguish the regime of Cooper pair fluctuations from the vortex fluid with long-lived vortices that exist in any type-II superconductor. Thus, one major ambition in the field is to identify the characteristic signatures of those different regimes of fluctuations in the Nernst data.
In this manuscript, we review our observation of the Nernst signal by Cooper pair fluctuations and our identification of the Ghost Critical Field (GCF) in the amorphous superconducting films [14, 15] and [16]. Then we describe the evolution of the Nernst signal within their superconducting phase diagram, from the regime of Cooper pair fluctuations to the vortex solid, across the vortex liquid. In finite magnetic field, a large increase in the Nernst signal is observed in the crossover from the regime of Copper pair fluctuations to the vortex liquid phase, i.e. one non-superconducting dissipative state. In the zero magnetic field limit, where a true second order transition takes place between the regime of Cooper pair fluctuations and the dissipationless vortex solid, the Nernst coefficient diverges at the approach of the superconducting transition, i.e. following the diverging correlation length, and becomes zero in the vortex solid region. No abrupt increase of the Nernst signal due to vortices is observed as the temperature range for the existence of the vortex liquid shrinks to zero in the zero magnetic field limit.
The organization of this paper is as follows. Section 2 describes different regimes of superconducting fluctuations, whose existence has been speculated in amorphous thin films or cuprates. Section 3 reviews samples characteristics and experimental setup. Section 4 describes the Nernst signal generated by the vortex flow; Section 5, the Nernst signal generated by Cooper pair fluctuations. Section 6 describes the evolution of the Nernst coefficient across the transition from the regime of Cooper pair fluctuations, i.e. normal state, to the vortex solid. Finally, we discuss the effect of thermal and quantum fluctuations of SOP on the Nernst response of the vortex fluid.
2 Regimes of superconducting fluctuations
According to BCS theory, cooling a superconductor below its superconducting transition temperature leads simultaneously to both the Cooper pairs formation and their Bose condensation into a macroscopically coherent quantum state. However, several subjects of contemporary studies in superconductivity ask us to consider the possibility that Cooper pairs may exist without macroscopic phase coherence, mostly as a consequence of thermal or quantum fluctuations of the SOP[17, 18, 19, 2]. The magnitude of these fluctuations and their predominance in the phase diagram depends on materials parameters such as the amount of random impurities, i.e. quenched disorder, dimensionality or correlation length value[17].
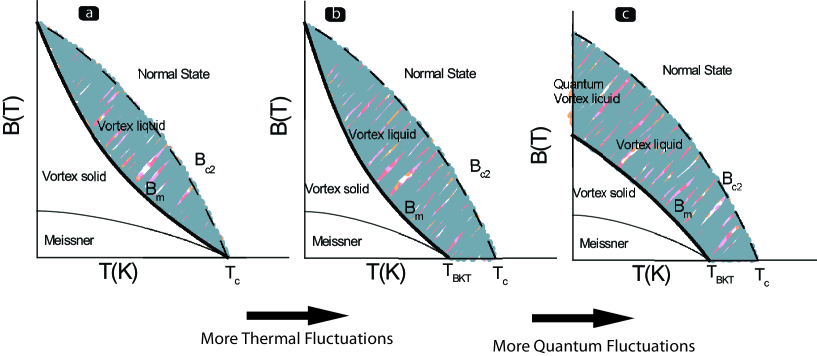
One such electronic phase is well known, found in many conventional and non-conventional superconductors, the vortex-liquid phase. This vortex fluid results from the melting of the vortex-solid above some magnetic field scale [18, 17], as a consequence of thermal fluctuations of the phase of SOP. This vortex fluid is separated from the normal state only by a crossover at the upper critical field , as shown on the phase diagram, panel a) of figure 1.
In superconductors, a combination of high temperature, small correlation length, large magnetic penetration depth and quasi-two-dimensionality, conspire to increase the effects of thermal fluctuations and can be significantly smaller than the upper critical field .
In contrast, in bulk superconductor, almost coincides with . However, as the vortex lattice is unstable against the introduction of quenched disorder[20], i.e. random pinning sites, the superconducting phase diagram of amorphous thin films usually displays a large vortex liquid region.
As the effects of thermal fluctuations are enhanced, either by increasing disorder, reducing dimensionality, or reducing superfluid density, a phase-disordered vortex liquid state may survive in the limit of zero magnetic field [18, 17], giving rise to a phase diagram as shown panel b) of figure 1. In this diagram, in the zero magnetic field limit, a second temperature scale emerges for the establishment of superconductivity, where macroscopic coherence sets in.
One similar situation has been intensively studied theoretically in two dimensions by Berezinsky, Kosterlitz and Thouless (BKT)[19, 21]. They found that, in two dimensions and zero magnetic field, there exists a temperature scale that correspond to a transition between two distinct regimes of superconducting fluctuations where only the phase degree of freedom are altered by the transition. The low temperature state () is quasi-ordered with algebraically decaying correlation functions. The high temperature state () is phase-disordered due to thermally generated vortex-antivortex pairs that dissociate and populate the ground state. This leads to a phase-incoherent superconducting state with exponentially decaying correlation functions. Strict experimental realizations of this model for charged superfluid is still lacking; however, some variations of it are being considered to apply in some part of the phase diagram of the cuprates and in the vicinity of the quantum superconductor-insulator transition observed in amorphous and granular superconducting thin films[22].
In cuprates, the observation of a pseudo-gap above , in the underdoped region of their phase diagram, was interpreted as a possible signature of two temperature scales for superconductivity. The higher temperature scale, where the pseudo-gap forms in the electronic spectrum, may correspond to Cooper-pairs formation, and the second, lower temperature scale, akin to , would correspond to the transition toward the phase-coherent superconducting state[23]. This regime of phase-only fluctuations is fundamentally different from the order parameter fluctuations as described in the context of Ginzburg-Landau theory[11]. In this last theory only one single temperature scale, , or magnetic field scale, , corresponding to the Cooper pair formation, is required to describe the fluctuations. Remarkably, within the Ginzburg-Landau framework, there is no upper temperature limit for the existence of these fluctuations; they are expected to survive far above in the normal state. In contrast, the regime of phase-only fluctuations implies two distincts temperature or magnetic field scales: one higher temperature scale for Cooper pair formation and one lower temperature scale for the establishment of phase coherence. Between these two temperatures, there exists a fluctuation regime characterized by long-lived, phase-incoherent, Cooper pairs and freely moving vortex-antivortex pairs. In the context of cuprates physics, Emery and Kivelson[2] extended the concept of phase-coherence temperature introduced by BKT. They suggested that, for any superconductor in any dimension, vortex-antivortex pairs should appear spontaneously when the thermal energy is larger than the energy cost for their formation; this energy cost results from the kinetic energy associated with superfluid flow around the vortices. This defines a temperature scale for phase coherence, , above which spontaneous nucleation of vortices is possible. In conventional superconductors, this coherence temperature largely exceeds , the Cooper pair forming temperature, and superconducting fluctuations exist only as fluctuations of both the amplitude and phase of the SOP. In contrast, for low density superfluid, as the underdoped cuprates, . This implies that the temperature for the superconducting transition is controlled by the superfluid density. In the context of cuprates physics, this provides an explanation of the Uemura plot[24] where is found to scale with the magnetic penetration depth, which is inversely proportional to superfluid density.
Finally, in addition to quenched disorder and thermal fluctuations, quantum fluctuations of the SOP provides another origin for the quantum melting of the vortex solid. This leads to a phase diagram as shown panel c) of figure 1, where a quantum liquid of vortices is expected in the zero-temperature limit, separated from the superconducting state by a second order transition whose critical behavior is controlled by quantum fluctuations [25]. Fine-tuning of the transition can be achieved either by applying a perpendicular magnetic field [26, 27, 28, 29, 30, 31, 32, 33, 34, 35] or by varying the sheet resistance of the films – using film thickness[36, 37, 38] or electrostatic field[39].
The systems discussed in this manuscript are amorphous superconducting films for which distinct regimes of superconducting fluctuations are possible. Well above the mean field superconducting transition , we expect the conventional Cooper pair fluctuations; below , different regimes may exists according to the amount of thermal or quantum phase fluctuations. One quantum origin is possible as quantum superconductor-insulator transitions have been observed in both systems[34, 35].
3 The compounds studied and the experimental technique used
In this paper we present the evolution of the Nernst signal across the phase diagram of two different disordered superconductors, and .
The two amorphous thin films of Nb0.15Si0.85 used for this study were prepared by L. Dumoulin’s group. The samples are deposited by co-evaporation of Nb and Si in an ultra-high vacuum chamber, as described elsewhere[40, 41]. On the other hand, the 300 Å-thick amorphous InOx film was prepared by Z. Ovadyahu’s group. The sample is deposited on a glass substrate by -gun evaporation of In2O3 in oxygen atmosphere [42]. The as-prepared film has an insulating-like behavior down to the lowest measured temperature of 60 mK. After thermal annealing at C under vacuum as described elsewhere [43], the room temperature sheet resistance decreases by about 30 % and a superconducting state appears. During all measurements, the film has been kept below liquid nitrogen temperature to avoid aging effects.
Several characteristics of indicate that effects of thermal or quantum fluctuations are stronger in this system than in . While has a high carrier density , comparable to any ordinary metal, the carrier density of is 80 times smaller, , comparable to values found for the underdoped cuprates. According to an argument put forward by Emery and Kivelson[2], this low carrier density increases the probability for the spontaneous nucleation of vortices and so the amount of phase fluctuations. A second difference between both systems is the larger sheet resistance of , , which implies enhanced quantum fluctuations with respect to , . Finally, one last striking difference between both system is the observation of a large negative magnetoresistance in . This phenomena has been interpreted as a possible indication of the pair-breaking effect of magnetic field on localized Cooper pairs[32, 44, 45]
The Nernst effect is the transverse thermoelectric response of a sample submitted to a thermal gradient and a magnetic field applied perpendicular to sample plane. One usually defines the Nernst coefficient , and within linear response theory, one also defines the Peltier conductivity tensor:
| (1) |
From the condition, , one gets:
| (2) |
For all samples discussed, the Hall angle is small, and so is . This leads to a simple relationship between the Nernst coefficient and the Peltier coefficient .
| (3) |
In our experimental setup, the Nernst signal is measured using a one heater - two thermometers setup. It allows measurements of diagonal and off-diagonal thermoelectric and electric transport coefficients with the same contacts. At low temperature, , a DC voltage of can be resolved and typical relative resolution of on the magnitude of temperature gradient can be achieved.
In superconductors, the two most important contributions expected are, below , the vortex contribution, , and above , the normal electrons contribution, . The measured Nernst signal is the sum of both contributions.
| (4) |
In the amorphous superconductors studied here, the Nernst signal due to normal quasiparticles is particularly low as this contribution scales with electron mobility[5]. This characteristic of amorphous superconductors is of the utmost importance as it allows to identify unambiguously the Nernst signal measured deeply into the normal state with the contribution of superconducting fluctuations.
Part of the Nernst data presented here have been discussed previously, where we have shown that, in , Cooper pair fluctuations could generate a Nernst signal up to very high temperature () and high magnetic field () in the normal state[14, 15]. In this regime, we found that the magnitude of the Nernst coefficient is set by the size of superconducting fluctuations and led to emergence of a field scale above , the Ghost Critical Field (GCF), whose value is set by the correlation length[15]. Tracking the temperature dependence of the GCF in and demonstrates that both systems have characteristically distinct behaviors across the transition. In , a true superconducting transition is observed, while is characterized by a large region of superconducting fluctuations that prevent the establishment of the superconducting order[16].
4 Long-lived vortices and Nernst effect
Previous works on conventional superconductors[46, 3] and cuprates[47, 4] have shown that a large Nernst signal is generated by vortices as they are displaced by an applied heat current. This can be described phenomenologically by considering the forces exerted on the vortices. There is the force exerted by the thermal gradient, where is the entropy transported per vortex. Moving vortices with speed are also subject to the frictional force , where the damping viscosity may be inferred from the the flux-flow resistivity where is the superconducting flux quantum. In the steady state, when the frictional force balances the thermal force, the Nernst signal is given by :
| (5) |
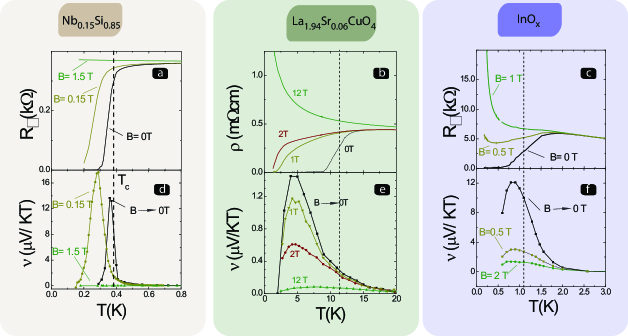
Figure 2 shows the temperature dependence of resistivity and Nernst coefficient data across the superconducting transition of one thick film of , one thick film of and the undedoped cuprate , taken from references [14, 15], [16] and [48] respectively. For , we observe a sharp increase of the Nernst coefficient at the superconducting transition. As we will see later, in the zero magnetic field limit, this large enhancement of the Nernst coefficient reflects the diverging correlation length at the approach of the superconducting transition. While the Nernst signal due to superconducting fluctuations appears simply as the high temperature tail of the large vortex-induced Nernst signal observed below . We will show that a comparison of the magnetic field dependence of the Nernst signal, figure 3, measured above and below , allows to establish a fundamental distinction between the data measured above and below . At finite magnetic field, as the only genuine superconducting phase is the dissipation-less vortex solid, the large enhancement of the Nernst coefficient actually reflects a crossover between two regimes of fluctuations, the regime of Cooper pair fluctuations and the vortex fluid with frozen amplitude fluctuations of the order parameter.
For and , figure 2 shows that the Nernst coefficient changes continuously across the transition and does not increase abruptly at the transition. For , this reflects the absence of a true phase transition, with diverging correlation length, and so the absence of long range superconducting order in this system.
5 Cooper pair fluctuations and Ghost critical field
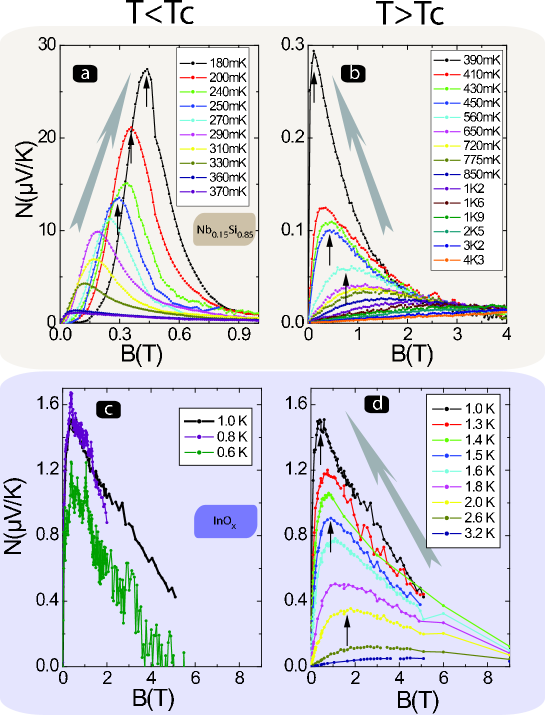
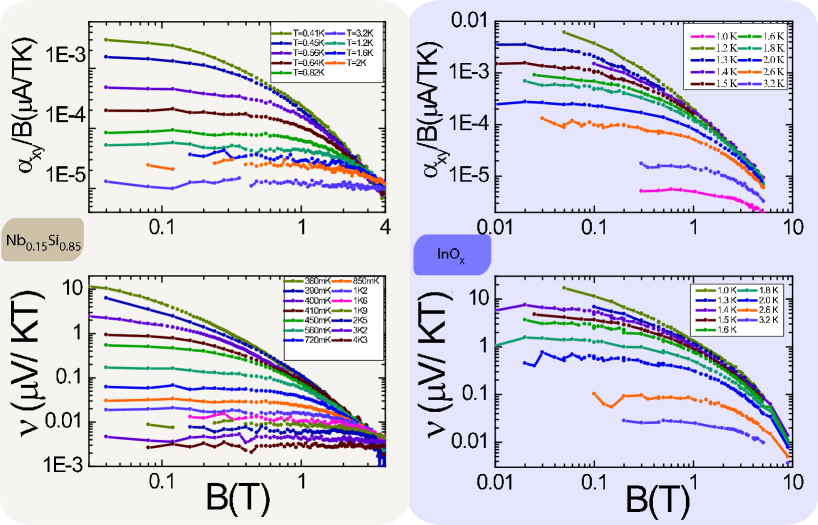
Figure 3 shows the magnetic field dependence of the Nernst signal for and . In the normal state, for both systems, the Nernst data follow a characteristic tilted tent profile with a maximum at the field scale whose magnitude is observed to increase with temperature.
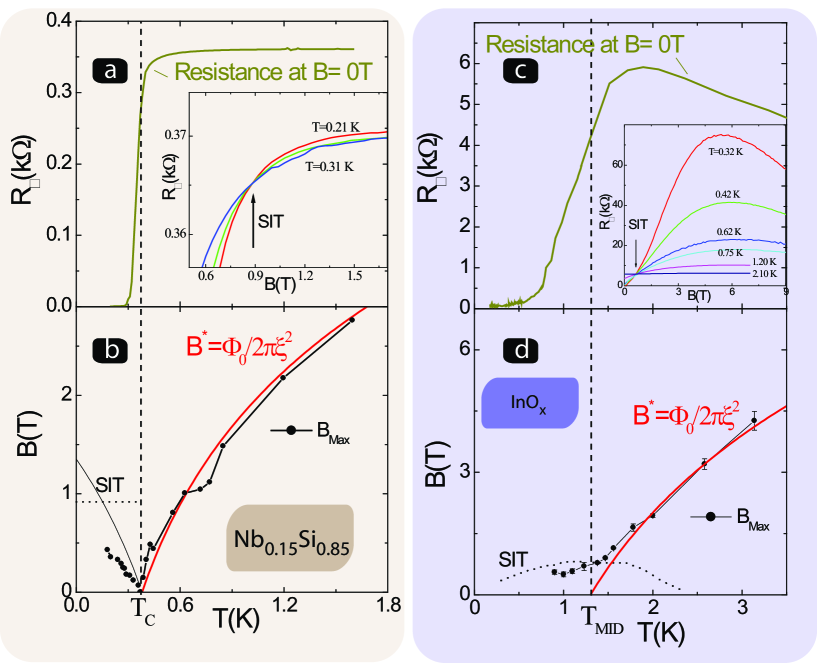
Below , for , the vortex-induced Nernst signal increases steeply with magnetic field, when the vortices become mobile following the melting of the vortex solid state. It reaches a maximum and decreases at larger magnetic fields when the excess entropy of the vortex core is reduced. In contrast to the high temperature regime, the position of the maximum shifts toward higher magnetic fields upon decreasing the temperature. This is not surprising, since in the superconducting state, all field scales associated with superconductivity, as and , are expected to increase with decreasing temperature. Plotting the position of , above and below , on the phase diagram figure 4 shows that goes to zero just at . This observation is the most definitive signature that the superconducting fluctuations at the origin of the Nernst signal observed above are of a fundamentally distinct nature than below . Below , the Nernst signal is generated by the long-lived vortices of the vortex fluid, above , the Nernst signal is generated by Cooper pair fluctuations.
These fluctuations correspond to spatial and temporal fluctuations of the SOP and are described by the Ginzburg-Landau theory[11]. The typical size of these superconducting fluctuations is set by the correlation length . It characterizes the length scale on which the correlation function decreases to zero. Upon cooling, this correlation length increases and diverges at the approach of the superconducting transition as where is the reduced temperature. At the microscopic level, these fluctuations correspond to short-lived Cooper pairs whose life-time is controlled by their decay into free electrons :
| (6) |
These Cooper pairs fluctuations give rise to the phenomena of paraconductivity[12] and fluctuation diamagnetism[13]. As normal quasiparticles contribute significantly to conductivity and magnetic susceptibility, the sensitivity of these probes to superconducting fluctuations is limited to a narrow region close to the superconducting transition[49]. In contrast, in these amorphous films, as the elastic mean free path is only a few Angstrom long, the contribution of free electron to the Nernst signal is particularly weak, orders of magnitude lower than the measured Nernst signal due to superconducting fluctuations. This explains that the Nernst signal generated by short-lived Cooper pairs can be detected up to very high temperatures () and high magnetic field (), deep into the normal state[14, 15]. Furthermore, because of this weak contribution of normal quasiparticles excitations, a direct and unambiguous comparison of Nernst data with superconducting fluctuations theories is possible.
Treating the fluctuations of the SOP in the Gaussian approximation, USH obtained a simple analytical formula, valid close to and in the zero-magnetic field limit, relating the off-diagonal Peltier coefficient to fundamental constants and the correlation length[10].
| (7) |
where is simply related to the Nernst coefficient and the measured conductivity through the formula . Above , as the conductivity of samples change only weakly with temperature and magnetic field, the evolution of the Peltier coefficient is mostly controlled by the Nernst coefficient value, as shown figure 5 where and are plotted side by side.
One remarkable characteristic of formula 7 is that the coefficient is independent of magnetic field. A plot of this coefficient obtained experimentally for and , Figure 5, shows that this is indeed the case at low magnetic field.
From those plots, the value of in the zero magnetic field limit, , is extracted and compared to USH equation 7, as shown figure 6.
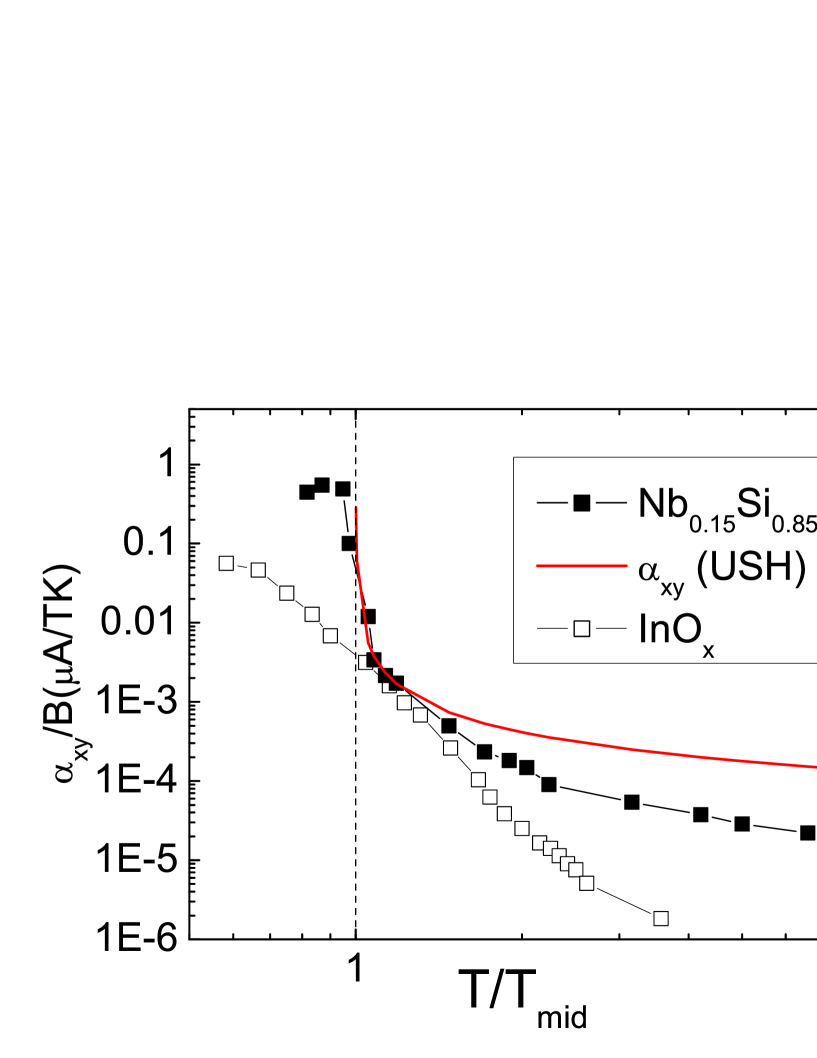
For , a quantitative agreement with a theoretical prediction is found close to . At high temperature, the data deviates from the USH theoretical expression. Recent theoretical works have extended the calculations of the Nernst effect due to Gaussian fluctuations beyond the regime of validity of USH theory, to higher temperature and magnetic field[50, 51] and have been found to be in quantitative agreement with those data as well.
Thus, these last experimental and theoretical works have established that well defined vortex-like excitations are not required for superconducting fluctuations to generate a Nernst signal, and that the magnitude of the Nernst coefficient in the regime of Gaussian fluctuations is simply related to the correlation length. Remarkably, these measurements also demonstrated that even at high magnetic field and high temperature, the Nernst coefficient is simply related to that single length scale, the size of superconducting fluctuations [15, 16]. In the zero-field limit, this size is set by the correlation length . In the high field limit, the size of superconducting fluctuations is set by the magnetic length when this length becomes shorter than the correlation length at zero magnetic field.
The shrinking effect of the magnetic field on superconducting fluctuations is well known from studies of fluctuations diamagnetism in low temperature superconductors[13] and cuprates[52]. While in the low field limit, the magnetic susceptibility should be independent of the magnetic field – i.e. in the Schmidt limit[53] –, the magnetic susceptibility is experimentally observed to decrease with the magnetic field, following the Prange’s formula[54]; which is an exact result within the Ginzburg-Landau formalism. At high magnetic field, the superconducting fluctuations are described as evanescent Cooper pairs arising from free electrons with quantized cyclotron orbits[49].
As a consequence of this phenomena, at a given temperature , the size of superconducting fluctuations decreases from the value , at low magnetic field, to the magnetic length value , when the magnetic field exceeds . This field scale was identified the first time by Kapitulnik et al. in the magnetoresistance data of mixture films of InGe[55]. As it mirrors, above , the upper critical field below , it has been dubbed the ”Ghost critical Field”, by these last authors.
As shown in figure 3, above , this crossover is responsible for the observed maximum in the field dependence of the Nernst signal. Upon increasing the magnetic field, the Nernst signal increases linearly with field, reaches a maximum at and decreases beyond that field scale. As extensively discussed in our previous publications[15, 16], we recall here the arguments demonstrating that the Nernst coefficient is set by the size of superconducting fluctuations and that is set by the GCF.
-
•
At low magnetic field, the Nernst coefficient depends only on the temperature and is independent of the magnetic field. Indeed, when , the size of the superconducting fluctuations is set by the temperature dependent correlation length . See figure 5.
-
•
Above , the magnitude and the temperature dependence of follows the field scale set by the Ginzburg-Landau correlation length through the relation where is the flux quantum and the reduced temperature. See [14] and [16] for the details regarding the determination of the correlation length in and respectively. The position of the maximum is the field scale where . As shown in the panel b of figure 4 for , it mirrors above , the upper critical field below .
-
•
At high magnetic field, , the data for Nernst coefficient converge toward a weakly temperature-dependent curve. Indeed, when , the size of superconducting fluctuations is set by the magnetic length, which is obviously independent of temperature. See figure 5.
-
•
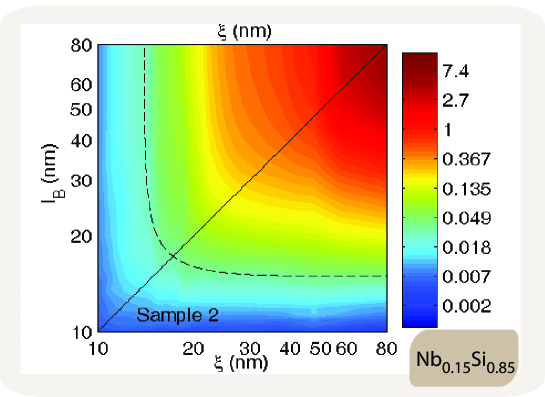
As shown figure 7 for , when one substitutes temperature and magnetic field by their associated length scales: the zero-field superconducting correlation length and the magnetic length , we find that the Nernst coefficient is symmetric with respect to the diagonal . This shows that the Nernst coefficient depends only on the size of superconducting fluctuations, no matter what sets it, the magnetic length or the correlation length.
Finally, we noticed previously for that goes to zero at . It appears now clearly that this is the consequence of the divergence of the correlation length at the transition, which drives the GCF to zero. This characteristic temperature dependence of is a remarkable signature of the superconducting transition and is expected in any conventional superconductor with a phase diagram as depicted in the panel a of figure 2.
A quite distinct phenomena is observed in . keeps decreasing on the temperature range where the superconducting transition is expected, according to resistivity measurements. This indicates that the correlation length does not diverge in this sample, implying the absence of a true superconducting transition. Most likely, strong superconducting fluctuations prevent the establishment of the superconducting order in this sample[16]. These fluctuations could also be hold responsible for the weak vortex-induced Nernst signal in this system. Indeed, the nature of vortices existing in conventional vortex fluids is quite distinct from the vortex-like excitations expected in BKT-type fluctuating regime. While vortices are long-lived in the vortex fluid, they have a short life-time in presence of phase fluctuations of the SOP. Most likely, such a reduction of the life-time of vortices should reduce the Nernst signal.
This situation bears much similarity with the underdoped cuprates, where the weak Nernst signal observed at high temperature has been attributed to short-lived vortex excitations of a regime with phase-only superconducting fluctuations. However, in contrast to our sample, where the superconducting order is never reached in our measurements, a genuine superconducting transition, with diverging correlation length, occurs in the cuprates. Consequently, as for , it is expected that the GCF should decrease to zero at . While this field scale has never been discussed and identified in the magnetic field dependence of the Nernst signal in cuprates, it appears clearly in the Nernst data shown figures 11, 12, 15, 16 from[4] for , , and , respectively.
Despite the distinct characteristics of the three family of materials discussed, , and the cuprates, we find that the GCF is a robust feature of the Nernst signal generated by superconducting fluctuations, no matter the precise nature of those fluctuations, i.e. Cooper pair fluctuations or phase-only fluctuations of the SOP. As a measure of the temperature dependence of the correlation length, the GCF provides a remarkable tool for the characterization of superconducting fluctuations.
6 From Cooper pair fluctuations to the vortex fluid
As discussed earlier, , the melting field of the vortex solid is believed to be the only second order transition within the temperature-magnetic field phase diagram of disordered type-II superconductors. On the other hand, the upper critical field line is believed to represent only a crossover between the vortex fluid and the regime of Cooper pair fluctuations. As we established that, in the zero magnetic field limit, the Nernst coefficient diverges at the transition as the correlation length, this led us to speculate that the evolution of the Nernst coefficient across the superconducting transition should be markedly different at finite magnetic field. Indeed, while in the zero field limit, the transition occurs directly between the regime of Cooper pairs fluctuations and the vortex solid; at finite magnetic field, the vortex fluid emerges between those two phases and prevents the divergence of the correlation length within the regime of Cooper pair fluctuations.
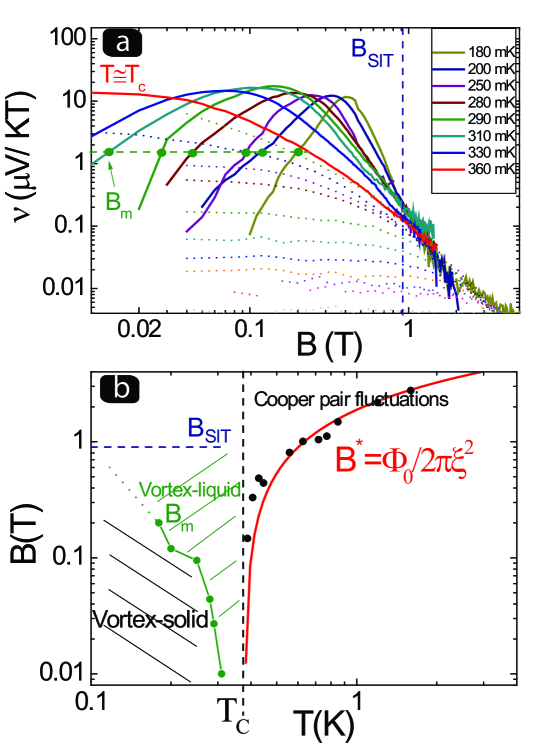
To locate the vortex fluid within the phase diagram of , figure 8, panel a) shows the Nernst coefficient as function of magnetic field measured at temperatures above and below .
The high field boundary of the vortex fluid phase is defined as the field scale below which the Nernst signal exceeds values expected for Cooper pair fluctuations. On this figure, we see that the curve at provides an upper envelop for the Nernst curves measured above (the dotted lines) and a separatrix with the curves measured below . All these curves merge with the curve measured at above a field scale about . This field scale turns out to be close to the critical field for the superconductor-insulator transition. This transition is identified through the observation of a crossing point in the field dependence of resistivity curves, as shown in insets of figure 4, and finite size scaling of the data[35]. Our measurements show that the vortex-induced Nernst signal may be damped by this transition. This is an unexpected observation as the usual understanding of the superconductor-insulator transition implies that the insulating phase should correspond to a quantum fluid of vortices.
The low field boundary of the vortex fluid phase is obtained as the field scale where the Nernst coefficient approaches zero. While it should be recognized that this criterion depends on experimental resolution, it provides a reasonable estimate of the melting field of the vortex solid.
Those two field scales, and , are reported on the phase diagram shown on a log scale, figure 8, panel b), together with the GCF line obtained from the position of the maximum in the field dependence of the Nernst data, measured above .
This diagrams shows that in the low field limit, the temperature range for the existence of the vortex liquid is very narrow, and explains why the temperature dependence of the Nernst coefficient shows a sharp peak centered at , figure 2, panel d). This peak is the consequence of the diverging correlation length for Cooper pair fluctuations and is not due to the vortex fluid motion. Just below , the Nernst coefficient decreases as the system enters the vortex solid.
At finite magnetic field, see curve at , figure 2 panel d), the temperature dependence of the Nernst coefficient shows a peak that becomes broader than in the zero field limit as a consequence of the intervening vortex fluid.
7 Conclusion
Superconducting fluctuations are at the center of important contemporary issues in strongly correlated electronic systems. In cuprates, the identification of the nature of superconducting fluctuations in the underdoped - high temperature part of the phase diagram may help elucidating the origin of the pseudo-gap observed in the electronic spectrum. If so, this will undoubtedly bring us closer to the solution of the high-Tc problem. In amorphous superconducting thin films, the proper characterization of the superconducting fluctuations on the insulating side of the quantum superconductor-insulator transition would shed light on the nature of this transition and the characteristics of the Bosonic insulator.
This context explains the large attention devoted to the Nernst effect. While it has been known for a long time to be highly sensitive to the vortices of the vortex fluid, only recently, did we discover that it is also highly sensitive to Cooper pair fluctuations. Theoretically, while the vortex-induced Nernst signal is exceedingly difficult to analyze as it depends on microscopic details such as the vortex pinning, the Nernst signal arising from Cooper-pair fluctuations is simple to analyze as it only depends on the size of the superconducting fluctuations. This leads to a simple relationship between the Nernst coefficient and the superconducting correlation length, as expressed by USH formula close to , and gives rise to a GCF in the field dependence of the Nernst signal. Our description of the evolution of the Nernst coefficient across the superconducting phase diagram of those superconducting films shows that the examination of unconventional superconducting fluctuations should be done by considering the deviations with respect to the Nernst signal generated by Cooper pair fluctuations, which are expected to exist in any superconductor.
References
References
- [1] Z. A. Xu, N. P. Ong, Y. Wang, T. Kakeshita, and S. Uchida. Vortex-like excitations and the onset of superconducting phase fluctuation in underdoped . Nature, 406(6795):486–488, 2000.
- [2] V. J. Emery and S. A. Kivelson. Importance of phase fluctuations in superconductors with small superfluid density. Nature, 374(6521):434–437, 1995.
- [3] F. Vidal. Low-frequency ac measurements of entropy flux associated with moving vortex lines in a low-kappa type-ii superconductor. Phys. Rev. B, 8(5):1982–1993, 1973.
- [4] Y. Wang, L. Li, and N. P. Ong. Nernst effect in high- superconductors. Phys. Rev. B, 73(2):024510, 2006.
- [5] Kamran Behnia. The nernst effect and the boundaries of the fermi liquid picture. J. Phys.: Condens. Matter, 21:113101, 2009.
- [6] A. V. Ettingshausen and W. Nernst. Wied. Ann., 29:343, 1886.
- [7] K. Behnia, M. A. Measson, and Y. Kopelevich. Oscillating nernst-ettingshausen effect in bismuth across the quantum limit. Phys. Rev. Lett., 98(16):4, 2007.
- [8] V. Oganesyan and I. Ussishkin. Nernst effect, quasiparticles, and d-density waves in cuprates. Phys. Rev. B, 70(5):8, 2004.
- [9] A. A. Varlamov and A. V. Kavokin. cond-mat/, page 0811.2614, 2008.
- [10] I. Ussishkin, S. L. Sondhi, and D. A. Huse. Gaussian superconducting fluctuations, thermal transport, and the nernst effect. Phys. Rev. Lett., 89(28), 2002.
- [11] Anatolii Ivanovich Varlamov Andre Andreevich Larkin. Theory of fluctuations in superconductors. Oxford , Clarendon Press New York , Oxford University Press – 2005.
- [12] R. E. Glover. Ideal resistive transition of a superconductor. Physics Letters A, A 25(7):542, 1967.
- [13] J. P. Gollub, M. R. Beasley, Callarot.R, and M. Tinkham. Fluctuation-induced diamagnetism above in superconductors. Phys. Rev. B, 7(7):3039–3058, 1973.
- [14] A. Pourret, H. Aubin, J. Lesueur, C. A. Marrache-Kikuchi, L. Berge, L. Dumoulin, and K. Behnia. Observation of the nernst signal generated by fluctuating cooper pairs. Nat. Phys., 2(10):683–686, 2006.
- [15] A. Pourret, H. Aubin, J. Lesueur, C. A. Marrache-Kikuchi, L. Berge, L. Dumoulin, and K. Behnia. Length scale for the superconducting nernst signal above in . Phys. Rev. B, 76(21), 2007.
- [16] P. Spathis, H. Aubin, A. Pourret, and K. Behnia. Nernst effect in the phase-fluctuating superconductor . Eur. Phys. Lett., 83(5), 2008.
- [17] G. Blatter, M. V. Feigelman, V. B. Geshkenbein, A. I. Larkin, and V. M. Vinokur. Vortices in high-temperature superconductors. Rev. Mod. Phys., 66(4):1125–1388, 1994.
- [18] D. S. Fisher, M. P. A. Fisher, and D. A. Huse. Thermal fluctuations, quenched disorder, phase-transitions, and transport in type-ii superconductors. Phys. Rev. B, 43(1):130–159, 1991.
- [19] J. M. Kosterlitz and D. J. Thouless. Ordering, metastability and phase-transitions in 2 dimensional systems. Journal of Physics C-Solid State Physics, 6(7):1181–1203, 1973.
- [20] A. I. Larkin and Y. N. Ovchinnikov. Pinning in type-ii superconductors. Journal of Low Temperature Physics, 34(3-4):409–428, 1979.
- [21] V. Ambegaokar, B. I. Halperin, D. R. Nelson, and E. D. Siggia. Dynamics of superfluid films. Phys. Rev. B, 21(5):1806–1826, 1980.
- [22] A. M. Goldman and N. Markovic. Superconductor-insulator transitions in the two-dimensional limit. Physics Today, 51(11):39–44, 1998.
- [23] P. A. Lee, N. Nagaosa, and X. G. Wen. Doping a mott insulator: Physics of high-temperature superconductivity. Rev. Mod. Phys., 78(1):17–85, 2006.
- [24] Y. J. Uemura, G. M. Luke, B. J. Sternlieb, J. H. Brewer, J. F. Carolan, W. N. Hardy, R. Kadono, J. R. Kempton, R. F. Kiefl, S. R. Kreitzman, P. Mulhern, T. M. Riseman, D. L. Williams, B. X. Yang, S. Uchida, H. Takagi, J. Gopalakrishnan, A. W. Sleight, M. A. Subramanian, C. L. Chien, M. Z. Cieplak, G. Xiao, V. Y. Lee, B. W. Statt, C. E. Stronach, W. J. Kossler, and X. H. Yu. Universal correlations between and ns/m-star (carrier density over effective mass) in high-tc cuprate superconductors. Phys. Rev. Lett., 62(19):2317–2320, 1989.
- [25] S. L. Sondhi, S. M. Girvin, J. P. Carini, and D. Shahar. Continuous quantum phase transitions. Rev. Mod. Phys., 69(1):315–333, 1997.
- [26] A. F. Hebard and M. A. Paalanen. Magnetic-field-tuned superconductor-insulator transition in 2-dimensional films. Phys. Rev. Lett., 65(7):927–930, 1990.
- [27] M. A. Paalanen, A. F. Hebard, and R. R. Ruel. Low-temperature insulating phases of uniformly disordered 2-dimensional superconductors. Phys. Rev. Lett., 69(10):1604–1607, 1992.
- [28] A. Yazdani and A. Kapitulnik. Superconducting-insulating transition in 2-dimensional thin-films. Phys. Rev. Lett., 74(15):3037–3040, 1995.
- [29] D. Ephron, A. Yazdani, A. Kapitulnik, and M. R. Beasley. Observation of quantum dissipation in the vortex state of a highly disordered superconducting thin film. Phys. Rev. Lett., 76(9):1529–1532, 1996.
- [30] N. Markovic, C. Christiansen, and A. M. Goldman. Thickness magnetic field phase diagram at the superconductor-insulator transition in 2d. Phys. Rev. Lett., 81(23):5217–5220, 1998.
- [31] N. Markovic, A. M. Mack, G. Martinez-Arizala, C. Christiansen, and A. M. Goldman. Evidence of vortices on the insulating side of the superconductor-insulator transition. Phys. Rev. Lett., 81(3):701–704, 1998.
- [32] V. F. Gantmakher, M. V. Golubkov, V. T. Dolgopolov, G. E. Tsydynzhapov, and A. A. Shashkin. Scaling analysis of the magnetic field-tuned quantum transition in superconducting amorphous in-o films. Jetp Letters, 71(4):160–164, 2000.
- [33] E. Bielejec and W. H. Wu. Field-tuned superconductor-insulator transition with and without current bias. Phys. Rev. Lett., 88(20):4, 2002.
- [34] G. Sambandamurthy, L. W. Engel, A. Johansson, and D. Shahar. Superconductivity-related insulating behavior. Phys. Rev. Lett., 92(10):4, 2004.
- [35] H. Aubin, C. A. Marrache-Kikuchi, A. Pourret, K. Behnia, L. Berge, L. Dumoulin, and J. Lesueur. Magnetic-field-induced quantum superconductor-insulator transition in . Phys. Rev. B, 73(9):094521, 2006.
- [36] H. M. Jaeger, D. B. Haviland, B. G. Orr, and A. M. Goldman. Onset of superconductivity in ultrathin granular metal-films. Phys. Rev. B, 40(1):182–196, 1989.
- [37] N. Markovic, C. Christiansen, A. M. Mack, W. H. Huber, and A. M. Goldman. Superconductor-insulator transition in two dimensions. Phys. Rev. B, 60(6):4320–4328, 1999.
- [38] C. A. Marrache-Kikuchi, H. Aubin, A. Pourret, K. Behnia, J. Lesueur, L. Berg , and L. Dumoulin. Thickness-tuned superconductor-insulator transitions under magnetic field in -nbsi. Phys. Rev. B, 78:144520, 2008.
- [39] K. A. Parendo, K. H. Sarwa, B. Tan, A. Bhattacharya, M. Eblen-Zayas, N. E. Staley, and A. M. Goldman. Electrostatic tuning of the superconductor-insulator transition in two dimensions. Phys. Rev. Lett., 94(19):4, 2005.
- [40] L. Dumoulin, L. Berge, J. Lesueur, H. Bernas, and M. Chapellier. Nb-si thin-films as thermometers for low-temperature bolometers. In 5th International Workshop on Low Temperature Detectors ( Ltd-5 ), pages 301–306, Berkeley, Ca, 1993. Plenum Publ Corp.
- [41] S. Marnieros, L. Berge, A. Juillard, and L. Dumoulin. Dynamical properties near the metal-insulator transition: Evidence for electron-assisted variable range hopping. Phys. Rev. Lett., 84(11):2469–2472, 2000.
- [42] Z. Ovadyahu. Optical-absorption and disorder in an amorphous metal. Phys. Rev. B, 47(10):6161–6164, 1993.
- [43] Z. Ovadyahu. Some finite temperature aspects of the anderson transition. Journal of Physics C-Solid State Physics, 19(26):5187–5213, 1986.
- [44] V. F. Gantmakher and M. V. Golubkov. Width of the zero-field superconducting resistive transition in the vicinity of the localization threshold. Jetp Letters, 73(3):131–134, 2001.
- [45] M. A. Steiner, G. Boebinger, and A. Kapitulnik. Possible field-tuned superconductor-insulator transition in high-tc superconductors: implications for pairing at high magnetic fields. Phys Rev Lett, 94(10):107008, 2005.
- [46] R. P. Huebener and A. Seher. Nernst effect and flux flow in superconductors .2. lead films. Physical Review, 181(2):710, 1969.
- [47] H. C. Ri, R. Gross, F. Gollnik, A. Beck, R. P. Huebener, P. Wagner, and H. Adrian. Nernst, seebeck, and hall-effects in the mixed-state of and thin-films - a comparative-study. Phys. Rev. B, 50(5):3312–3329, 1994.
- [48] C. Capan, K. Behnia, Z. Z. Li, H. Raffy, and C. Marin. Anomalous dissipation in the mixed state of underdoped cuprates close to the superconductor-insulator boundary. Phys. Rev. B, 67(10):4, 2003.
- [49] W. J. Skocpol and M. Tinkham. Fluctuations near superconducting phase-transitions. Rep. Prog. Phys., 38(9):1049–1097, 1975.
- [50] M. N. Serbyn, M. A. Skvortsov, A. A. Varlamov, and V. Galitski. Giant nernst effect due to fluctuating cooper pairs in superconductors. cond-mat/, page 0806.4427, 2008.
- [51] Karen Michaeli and Alexander Finkel’stein. Fluctuations of the superconducting order parameter as an origin of the nernst effect. cond-mat/, page 0812.4268, 2008.
- [52] C. Carballeira, J. Mosqueira, A. Revcolevschi, and F. Vidal. First observation for a cuprate superconductor of fluctuation-induced diamagnetism well inside the finite-magnetic-field regime. Phys. Rev. Lett., 84(14):3157–3160, 2000.
- [53] A. Schmid. Diamagnetic susceptibility at transition to superconducting state. Physical Review, 180(2):527, 1969.
- [54] R. E. Prange. Diamagnetic susceptibility at transition to superconducting state. Phys. Rev. B, 1(5):2349, 1970.
- [55] A. Kapitulnik, A. Palevski, and G. Deutscher. Inhomogeneity effects on the magnetoresistance and the ghost critical-field above in thin mixture films of in-ge. Journal of Physics C-Solid State Physics, 18(6):1305–1312, 1985.