The nature of HH 223 from long-slit spectroscopy. ††thanks: Based on observations made with the 2.6 m Nordic Optical Telescope operated at the Observatorio del Roque de los Muchachos of the Instituto de Astrofísica de Canarias.
Abstract
Context. HH 223 is a knotty, wiggling nebular emission of length found in the L723 star-forming region. It lies projected onto the largest blueshifted lobe of the cuadrupolar CO outflow powered by a low-mass YSO system embedded in the core of L723.
Aims. We analysed the physical conditions and kinematics along HH 223 with the aim of disentangling whether the emission arises from shock-excited, supersonic gas characteristic of a stellar jet, or is only tracing the wall cavity excavated by the CO outflow.
Methods. We performed long-slit optical spectroscopy along HH 223, crossing all the bright knots (A to E) and part of the low-brightness emission nebula (F filament). One spectrum of each knot, suitable to characterize the nature of its emission, was obtained. The physical conditions and the radial velocity of the HH 223 emission along the slits were also sampled at smaller scale () than the knot sizes.
Results. The spectra of all the HH 223 knots appear as those of the intermediate/high excitation Herbig-Haro objects. The emission is supersonic, with blueshifted peak velocities ranging from to km s-1. Reliable variations in the kinematics and physical conditions at smaller scale that the knot sizes are also found.
Conclusions. The properties of the HH 223 emission derived from the spectroscopy confirm the HH nature of the object, the supersonic optical outflow most probably also being powered by the YSOs embedded in the L723 core.
Key Words.:
ISM: jets and outflows — ISM: individual objects: L723, HH 223 — stars: formation1 Introduction
Lynds 723 (L723) is an isolate dark cloud located at a distance of 300150 pc (Goldsmith et al. gol84 1984) that shows evidence of low-mass star formation, where one of the few known cases of a quadrupolar CO outflow (two separate pairs of red-blue lobes; Lee et al. lee02 2002, and references therein) has been reported. The 3.6 cm radio continuum source VLA~2 (Anglada et al. ang96 1996), towards the centre of the CO outlfow, seems to harbour the exciting outflow source. VLA 2 is embedded in high-density gas traced by NH3, showing evidence of gas heating and line broadening (Girart et al. gir97 1997). The dense envelope of the source has also been observed at submillimeter wavelengths by Shirley et al. shi02 (2002), and Estalella et al. est03 (2003). Recent works by Carrasco-González et al. car08 (2008) and Girart et al. gir08 (2008), show that VLA 2 is a multiple system. Carrasco-González et al. car08 (2008) detect at least four young stellar objects (YSOs) and propose that the morphology of the CO outflow is actually the result of the superposition of three independent pairs of CO lobes. They also propose that one of the YSOs (VLA 2A) is exciting the largest pair of CO lobes and the system of emission-line nebulosities, reminiscent of Herbig-Haro (HH) objects, first reported by Vrba et al. vrb86 (1986).
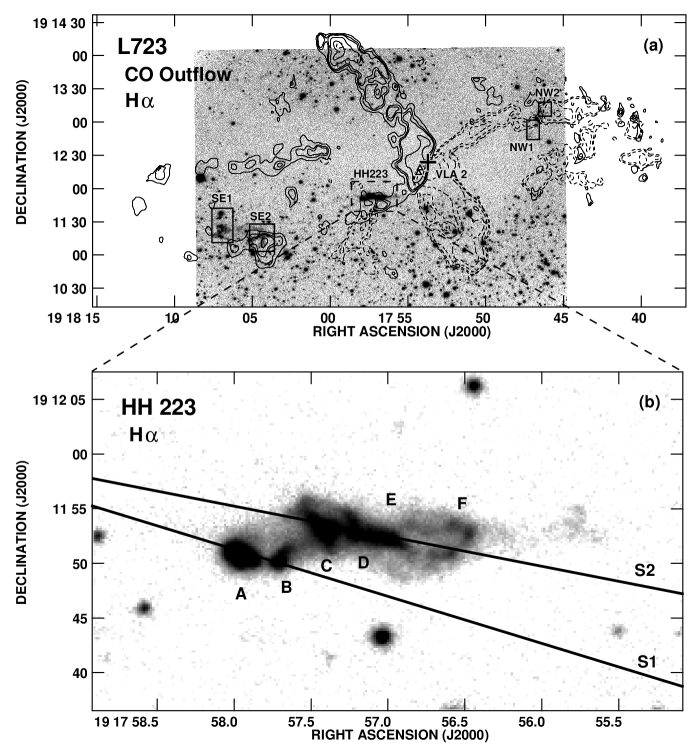
In a previous work (López et al. lop06 2006), we presented deep narrow-band H and [S ii] images of L723, which confirmed the emission-line nature of the nebulosities. The H image, with the CO outflow contours from Lee et al. lee02 (2002) superposed, is shown in panel (a) of Fig. 1. The higher angular resolution of the images allowed us to resolve the detailed structure of HH~223, the brightest ”linear emission feature” reported by Vrba et al. vrb86 (1986). HH 223 appeared as a set of knots embedded in a fainter nebula, following a wiggling pattern, reminiscent of a stellar jet, that is probably part of a parsec-scale HH outflow as suggested by CO observations of Lee et al. lee02 (2002), optical (López et al. lop06 2006) and near-infrared (Palacios & Eiroa pal99 1999; López et al. lop09 2009) imaging of the shocked emission. However, there were no kinematic data to establish the nature of the line emission, i. e. whether the emission is supersonic (as in typical stellar jets) or, in contrast, is nearly stationary as would be expected for a wall cavity. With the aim of exploring the kinematics and physical conditions in HH 223, we performed long-slit spectroscopy of the object covering all its bright knots (A to E) and a part of the low-brightness nebula (F filament). The results are presented in this paper.
2 Observations and Data Reduction

Spectra of HH 223 were obtained with the 2.6-m Nordic Optical Telescope (NOT) of the Observatorio del Roque de los Muchachos (ORM, La Palma, Spain) on 13 July 2007. The ALFOSC (Andalucía Faint Object Spectrograph and Camera), with an image scale of pixel-1, was used in its spectroscopic mode. The 600R grism # 8, covering the wavelength range 5825-8350 Å with a dispersion of 1.3 Å pix-1 (spectral resolution 60 km s-1) was used. In order to cover all the HH 223 bright knots, the spectra were acquired through a long-slit of 65 length and 1″ width, positioned at two position angles (see panel (b) of Fig. 1): at PA 73∘, along knots A and B (S1); and at PA 79∘, along knots C to F (S2). Individual exposures of 1800 s each were made to get total exposure times of 5400 s and 7200 s for the S1 and S2 slit positions, respectively. Special care was taken in achieving accuracy to point the slit on the knots. The setup only allows horizontal or vertical slit positions. Thus, a shorter exposure (200 s) of the field oriented at the desired PA was previously acquired through a narrow-band H filter. Then, an image of the slit on the detector was made and the procedure was iterated twice to achieve an accurate slit position before acquiring the spectrum. Seeing was for most of the run. The data were processed with the standard tasks for long-slit spectroscopy of the IRAF111IRAF is distributed by the National Optical Astronomy Observatories, which are operated by the Association of Universities for Research in Astronomy, Inc., under cooperative agreement with the National Science Foundation. package, which include bias substraction, flat-fielding correction, wavelength calibration using spectra from a Ne lamp acquired at several elevations for each slit position, and sky substraction. The achieved accuracy for the wavelength calibration, checked from the sky lines, was better than 0.2 Å ( 10 km s-1). The accuracy in the determination of the position of the line centroids is 0.2 Å ( 10 km s-1) for the strong emission lines observed. The final spectrum through each slit position was corrected for cosmic ray events by median filtering all the exposures, after wavelenght calibration, obtained at the given slit position. The spectra were not flux calibrated.
3 Results and Discussion
3.1 The spectra of the HH 223 knots: Physical conditions and kinematics
We obtained the spectrum for each HH 223 knot defined in López et al. lop06 (2006) by averaging the emission within the slit window crossing the knot. The six spectra obtained in such a way are displayed in Fig. 2. As can be seen from the figure, the characteristic HH emission lines from [O i] 6300, 6364 Å, [N ii] 6548, 6583 Å, H and [S ii] 6716, 6731 Å were detected in all the knot spectra. In addition, other emission lines redwards of 7000 Å were detected in several knots: the [Fe ii] 14F multiplet lines ( 7155, 7173, 7388, 7453 Å) were detected in knot A; the brightest [Fe ii] 7155 Å component of 14F multiplet was also detected in knots B and C, and the [O ii] 7321, 7331 Å and [Ca ii] 7291, 7324 Å lines (the two doublets being blended) were detected in knots A to E.
| Knot | [O i] 6300 | H | [N ii] 6583 | [S ii] 6731 | Average |
|---|---|---|---|---|---|
| A | |||||
| B | |||||
| C | |||||
| D | |||||
| E | |||||
| F |
-
Notes:
(1) Derived from the spectra integrated within the slit aperture sizes indicated in Fig. 2.
3.1.1 Density and excitation conditions of the knots
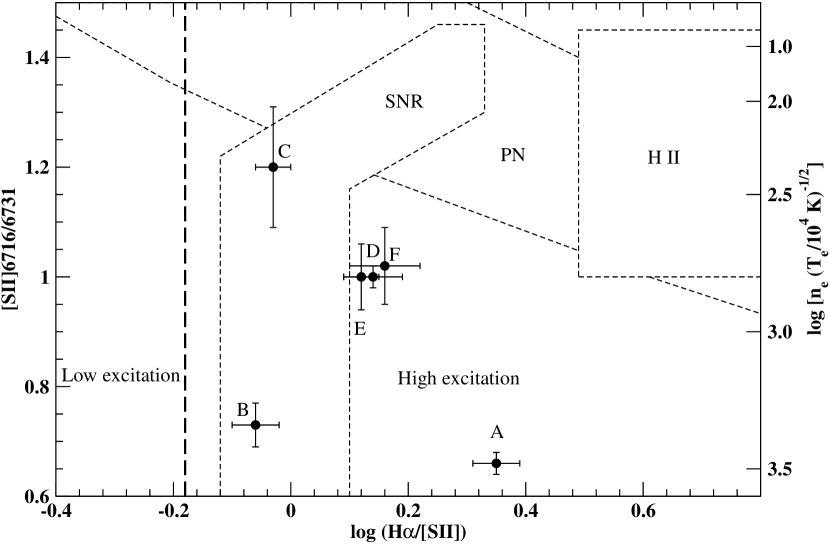
From the spectra obtained as mentioned above, we explored the electron density (), from the [S ii] 6716/6731 line ratio, and the excitation conditions, from the [N ii]/H and [S ii]/H line ratios. The fluxes were uncorrected for reddening. However, these line ratios are insensitive to differential extinction because of the wavelength proximity of the lines.
Figures 3 and 4 show the location of the HH 223 knots in current diagnostic diagrams from line ratios of nebular emission lines (see e. g. Cantó can81 1981; Raga et al. rag96 1996). As can be seen from these figures, the line ratios of all the HH 223 knots lie in the diagrams region where are located the HH objects having an intermediate- or high-excitation spectrum. The diagrams also show that there are appreciable differences in both, excitation and density, among the knots. Knot A has the highest excitation spectrum. Concerning the rest of the HH 223 knots, there is some trend of increasing excitation going towards the west. Values for of the knots were derived from the [S ii] 6716/6731 ratio, using the TEMDEN task of the IRAF/STSDAS package, and assuming . The results are shown in Fig. 4. The electron density is significantly higher in the brighter, southern knots A and B than in the rest of the HH 223 knots, the difference between the highest (in knot A) and the lowest (in knot C) values being about one order of magnitude. Knots D, E and F have similar values. Note, however, that knots B and C have spectra of similar excitation, in spite of their derived being significantly different.


3.1.2 Radial Velocities of the knots
The radial velocities222All the velocities in the paper are referred to the local standard of rest (LSR) frame. A =+10.9 km s-1 for the parent cloud has been taken from Torrelles et al. tor86 1986 of the HH 223 knots were obtained from the line centroids of Gaussian fits to the emission lines of the spectra of Fig. 2. Thus, the derived velocities correspond to the knot emission integrated within the slit aperture and do not account for differences in velocity at spatial scales smaller than the knot size. In Table 1 we list the velocities obtained from several emission lines and the average velocity. The velocities derived for the knots appear blueshifted relative to the ambient gas, the gas intersected by the slit moving supersonically towards the observer. Thus, the HH 223 knot emission properties are those expected from an optical outflow. Note that the velocity derived for HH 223-F is significant lower. However, the spectrum of HH 223-F mostly arises from gas of the low-brightness nebula in which the knots are engulfed (F filament) instead of from a truly, compact knot.
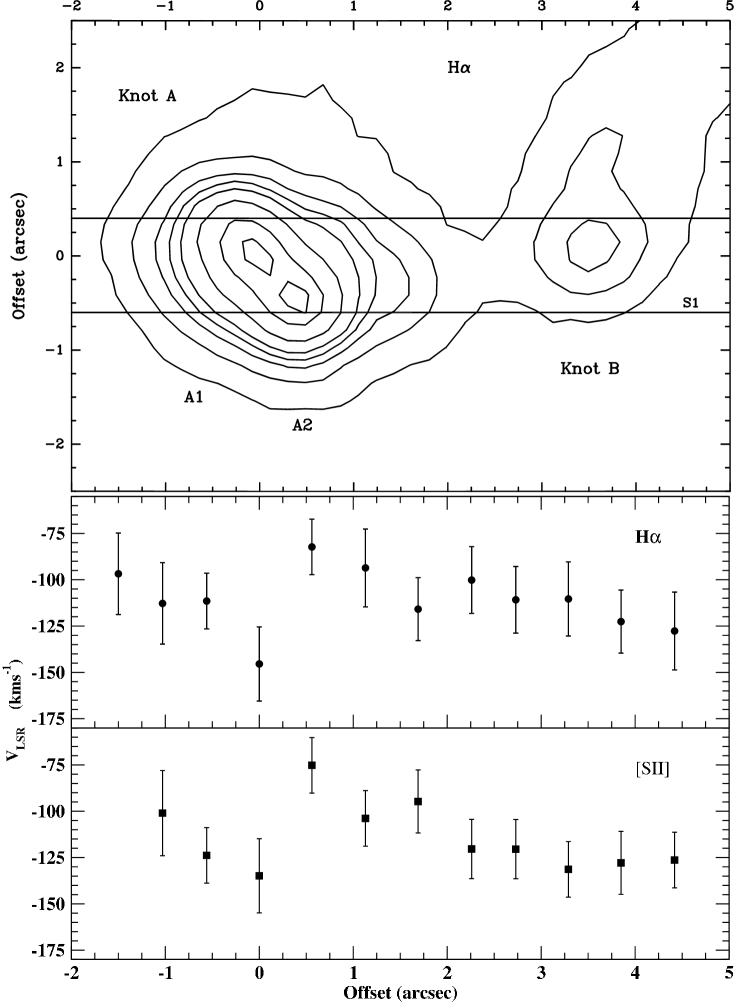
More detailed maps are shown in Figs. 5 and 6. For knot A, the position-wavelength (PV) maps of Fig. 5 show a velocity gradient within this knot, with higher blueshifted velocities towards the east, the trend being found in all the lines mapped. In fact, the PV map of the H line suggests that there are two velocity peaks, at and km s-1, with a position offset 05. Interestingly, the narrow-band H image also shows two intensity maxima within knot A (labeled A1 and A2 in Fig. 7, upper panel), the positions of these intensity maxima being in good concordance with the positions of the two velocity components of the PV maps. This suggests that the emission labeled as knot A, extending over 35 along the slit position S1, would be in fact a more complex structure composed of two emitting clumps, partially resolved by our data, each clump moving at a different blueshifted velocity. This is better seen in Fig. 7, where we show the PV maps for different lines (lower panels) and the intensity contours obtained from the H image, oriented according to the slit position S1. Note in addition that the peak velocity position in the H line (i. e. around the A2 substructure) is displaced from the peak velocity in the [S ii] 6731 Å line (i. e. around the A1 substructure). Spatial displacements between the H and [S ii] peak positions are also found in other stellar jets (e. g. HH 110, Riera et al. rie03 2003; HH 119, Gålfalk & Olofsson gal07 2007), in which the supersonic jet outflow propagates in an inhomogeneous, quite dense ambient environment.
3.2 Small-scale properties of the HH 223 emission
Our data, having better spatial resolution than the knot sizes (ranging from 2″ to 35), suggest that there are changes in both kinematics and physical conditions at a smaller spatial scale. With the aim of looking for such variations, we extracted a set of spectra by co-adding the signal of each three adjacent pixels (i. e. by doing a spatial binning of 06, of the order of the seeing) to cover without gaps all the HH 223 emission intersected by the slits. The spectra, still keeping a very good signal-to-noise ratio (several of them are displayed in Fig. 8) are then useful for sampling the gas conditions with a step of 06.
The spectra displayed in the two upper rows of Fig. 8 correspond to the emission at adjacent positions through knot A (from east to west). A quick look to the panels shows apreciable changes in the relative intensity of the emission lines, suggestive of changes in excitation and electron density even by only moving 06 along the slit. Fig. 8 also displays some of the spectra obtained at several selected positions along slits S1 (within knot B) and S2, for positions belonging to knots C, D and the F filament. It should also be noted that the [S ii] 6716 Å line appears brighter than the 6731 Å line in the spectra extracted along S2, while the opposite occurs along S1. Given that the [S ii] 6716/6731 line ratio is a tracer of the density of the ionized gas, this finding is indicative of a general trend, both from the knots and from the interknot low-brightness regions, of the gas being less dense towards the northwest, i. e. towards the optical obscured region.
Let us now examine the small-scale changes in the physical conditions using the line ratios derived from these spectra.
3.2.1 Small-scale excitation and density along HH 223
Figures 9 and 10 (lower panels) display the spatial behaviour along the slit for several line ratios, tracing the excitation and ionizaton conditions, and for the electron density. To help with the knot identification, the H image is displayed in the upper panel of these figures.
As can be seen from Fig. 9, all the line ratios differ from knot to knot, but also vary at a smaller spatial scale, within the knot. The gas excitation is traced by the [N ii]/H and [S ii]/H line ratios. All the values derived along knots A and B correspond to the intermediate/high excitation HHs (Raga et al. rag96 1996). However, the excitation is clearly different in both knots: the [S ii]/H line ratios along knot A are 0.6, while they are 0.9 along knot B. Note in addition that the lowest [S ii]/H line ratio value (thus the highest excitation) is found inside knot A, at positions offset from the two knot A peaks. In contrast, the [S ii]/H line ratio values of knot B are the highest derived for all the sampled emission, thus indicating that the lowest excitation in the emission is found around knot B. These results are fully consistent with those derived by López et al. lop06 (2006) using the [S ii]/H ratio map obtained from the narrow-band CCD images.

The behaviour of the electron density through knot A and B, derived from the [S ii] 6716/6731 line ratio (see Section 3.1.1), is also shown in Fig. 9. An electron density 200-300 cm-3 is found at positions away from the knot peaks, coinciding with the regions where the slit mainly intersects gas coming from the low-brightness emission. In contrast, values in the range 1200 3000 cm-3 are found through knot B and 1500 2500 cm-3 through knot A, except for the position around the A2 substructure, where the derived [S ii] 6716/6731 line ratio is close to the limit for which this ratio is not a reliable indicator of the density. A more accurate estimation of in this knot should be derived from the [Fe ii] 7155/8617 line ratio. However, although the [Fe ii] 7155 Å line is detected in knot A, unfortunately the [Fe ii] 8617 Å line is not included within the spectral range used. It should be remarked that such a high is most probably real (i. e. is not an artifact: first, because a similar low ratio has been found in each of the three adjacent pixels binned to get the A2 spectrum; and second, because the same behaviour at this knot position was obtained from another exploratory spectrum acquired one year before). Thus, this result gives also support to the idea that the knot A emission is split into two different substructures that are not well resolved by our data.
A similar analysis, but for the slit position S2, intersecting emission from knots C to F, is shown in Fig. 10. Regarding the gas excitation, the [N ii]/H and [S ii]/ H line ratios suggest that three different regions should be defined along the slit: the first one, extending up to from the knot C peak, having the highest [S ii]/H ratios ( 1) (the lowest gas excitation found along S2, being however higher than the excitation infered in knot B); the second one extending up to 7″ west beyond the knot C intensity peak and enclosing knots D and E, where the excitation increases, although it is lower than in knot A; and finally, the western region beyond the end of knot E, which includes the F filament and the F1 faint knot, where the gas excitation decreases again. The spatial behaviour of the electron density (derived from the [S ii] 6716/6731 ratio) along knots C to F is displayed in the bottom panel of the figure. The trend found is sugestive of density inhomogeneities in the emitting gas, the sizes of the clumps remaining unresolved with our spatial resolution. As in the case of the knots A and B emission, we found two densitiy gas components: a lower-density emitting gas, with 100 300 cm-3 and a higher-density component, with 700 2500 cm-3. A more careful inspection of the spatial distribution also shows that there are several density enhancements within each knot, possibly indicating that the knots could be split in substructures by imaging the emission with higher angular resolution. The [N ii]/[O i] line ratio only depends weakly on the temperature, being a good indicator of the level of global ionization in the flow (see e. g. Bacciotti & Eislöffel bac99 1999). Its values as a function of the slit position are plotted in Figs. 9 and 10 to qualitatively show the variation of the degree of ionization in the outflow. As can be seen from these figures, this ratio is appreciably higher ( 1) along knot A than along knot B, (where the ratio is 1, the lowest value found for all the knots). Thus, knot A appears as the most excited and highly ionized region in HH 223, while the closest region, knot B, is the lowest ionized and excitated one. From the Hartigan, Morse & Raymond har94 (1994) models, the [N ii]/[O i] line ratios allowed us to constraint the ionization fraction () to 25–30% along knot A, 15% along knot B and 20–25% along knots C to E, all these values being roughly independent of the range of preshock magnetic field strengths expected within molecular clouds. The [N ii]/[O i] ratios also constraint the shock velocities to 60–70 km s-1. From the estimated values and the derived , we also estimated the density (= /) for the knots. We found that knots A and B are significantly denser ( 104 cm-3) than knots C to E, where ranges from 1103 to 3103 cm-3.
3.2.2 Small-scale radial velocity along HH 223
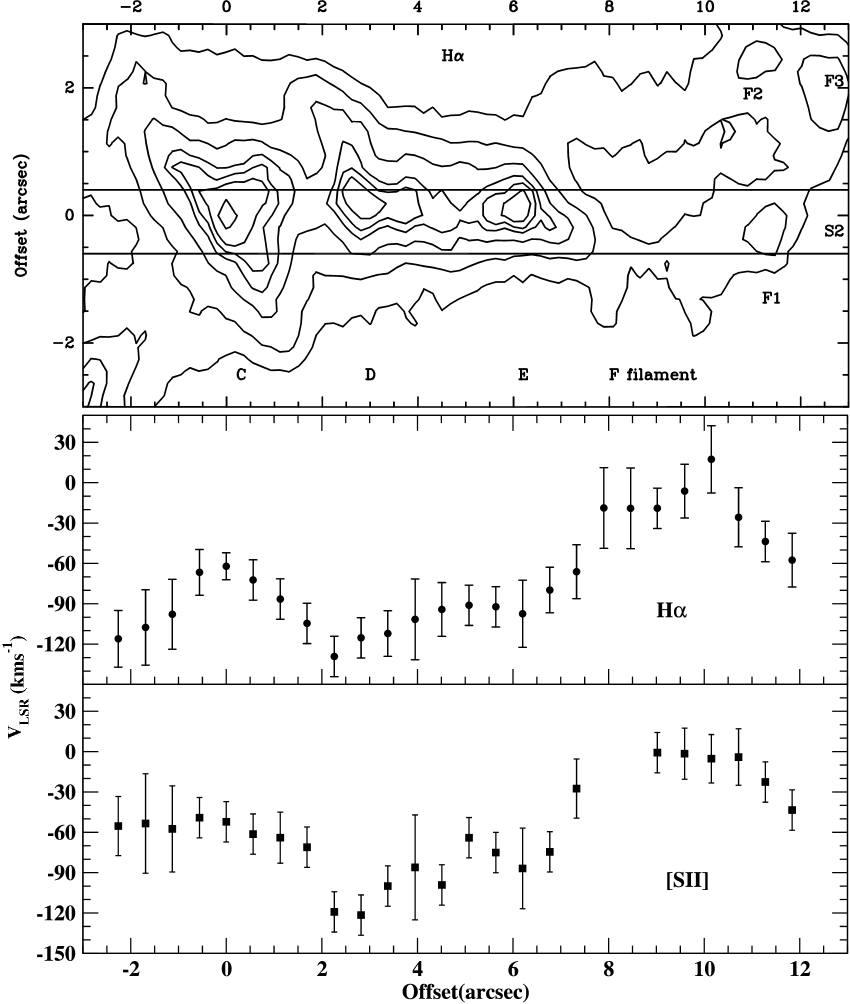
The radial velocities along HH 223, with a spatial sampling of 06, were derived from the line centroids of Gaussian fits to the H and the [S ii] 6716,6731 Å lines. Results are displayed in Figs. 11 and 12 for the slit positions S1 and S2 respectively. From these figures, the following trends are found: i) The velocity behaviour as a fuction of the slit position is very similar for the lines considered. ii) The radial velocities derived appear highly blueshifted at all the positions enclosed within the knots A to E and F1; velocities values slightly blueshifted or at the ambient gas velocity are found at positions corresponding to the F filament, but out of the F1 faint knot. iii) In several regions, significant variations in the velocity can be found at scales , smaller than the knot sizes.
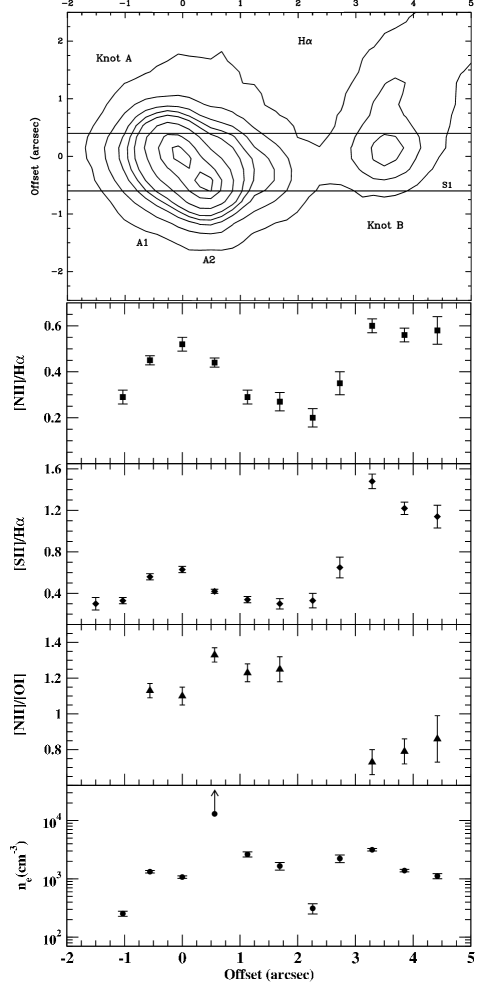
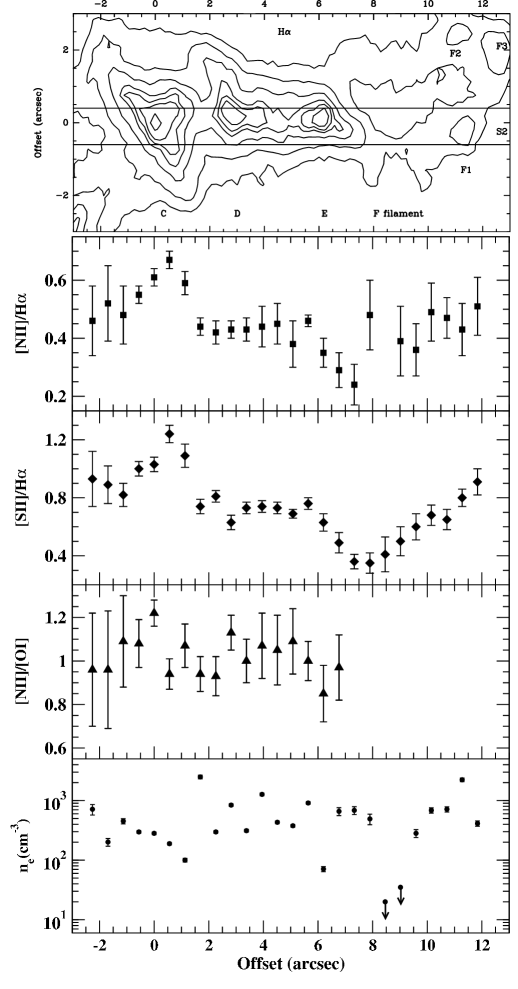
Figure 11 displays the radial velocity behaviour along knots A and B. There are appreciable velocity changes with position along knot A, the velocities being more blueshifted towards the east. Such a behaviour is found for all the emission lines (see also Fig. 5). We derived a difference in velocity of 60 km s-1 between two position within knot A, which corresponds to the two emission peaks, A1 and A2, of the narrow-band image (see also Fig. 7). The radial velocity has only small variations along knot B, reaching similar values to those found for positions eastwards of A1.
Figure 12 displays the radial velocity behaviour along S2. The more blueshifted velocities ( km s-1) are found for the knot D emission peak position, reaching similar values to those found for knot B. Less blueshifted velocities are found eastwards of knot D, reaching a value of km s-1around the knot C emission peak position. There is an appreciable change in velocity for positions offset to from knot C, where the derived velocities are compatible with the value. Interestingly, the emission intersected by the slit at these positions mostly comes from the F filament, out of the three faint knots (F1-F3) found engulfed in it. Thus we speculate that the emission in this region probably would arise from ambient gas of a wall cavity which is already been excited and dragged by the supersonic outflow.
Finally, it should be pointed out that, at several positions, the line profiles in all the strong emission lines of the unbinned spectra are suggestive of being double-peaked. Due to the spectral resolution used, we have not been able to resolve with confidence the two velocity contributions suggested by these line profiles. However, we believe that the contribution from two velocity components is reliable and should be characterize from higher spectral resloution data.
4 Conclusions
In order to get knowledge on the kinematics and physical conditions in HH 223, we performed long-slit spectroscopy at two slit postions, covering emission from all the bright knots (A to E) and from the low-brightness F filament.
The spectrum of each of the HH 223 bright knots was obtained by integrating the emission within the slit window aperture encompasing the spatial extent of the knot (ranging from to 35). The analysis of these spectra allowed us to characterize the nature of the knot emission. The results are summarized as follows:
-
•
For all the knots, the spectrum appears as produced by shock-excited gas, characteristic of the HH objects.
-
•
All the knot spectra have an intermediate/high degree of excitation, as their [S ii] and [N ii] to H ratios indicate. The estimated ionization fraction () ranges from 0.15 in knot B to 0.3 in knot A. The electron density, derived from the [S ii] 6716/6731 ratios, ranges from 240 (in knot C) to 2800 cm-3. The total density ranges from 104 cm-3 in knots A and B, to 103 cm-3 in knot E. Knot A is the densest and has the highest excitation and ionization. The lowest excitation and ionization is found in knot B.
-
•
The kinematics derived from the emission lines indicates that the knot emission is supersonic, with blueshifted velocities ranging from to km s-1, the more blueshifted velocity values being found in knot B. Velocity values compatible with the ambient gas are only derived for the F filament.
From the spectra obtained by binning the signal of each three adjacent pixels ( 06) along the slit, we searched for variations, both in the kinematics and in the physical conditions, at a scale smaller than the knot sizes. The relevant results are the following:
-
•
Reliable variations at a scale smaller than the knot sizes are found in both, kinematics and physical conditions.
-
•
Emission from knot A can be resolved into two substructures (A1 and A2), with a projected offset of between their H emission peaks, and a difference in velocity of 60 km s-1, the eastern (A1) substructure being the most blueshifted one.
-
•
Spatial variations of up to one order of magnitude are found. The lower values are found at positions where the slit mostly intersects gas from the low-brightness filamentary nebula (F). The highest is found coinciding with the western substructure (A2) of knot A. Other enhancements of are found, in addition, at several positions inside knots C, D and E.
In summary, concerning the nature of the emission, the spectroscopy let us to conclude that the emission from the HH 223 knots arises from shock-excited, highly blueshifted gas, being thus characteristic of an optical outflow having an inhomogeneous, knotty structure in which each knot could enclose smaller subcondensations, as suggested by the small-scale changes found in the kinematics and physical conditions. The knots emission should then trace internal working surfaces of shocks that originate because the supersonic gas is being ejected at varying speeds or with different ejection directions, and faster ejecta overtake slower ones. A variable ejection velocity and a wiggling knot pattern is consistent with the exciting source being a YSO binary system. The H2 emission detected at the HH 223 location should arise from gas collisionally excited by shocks, which is not dissociated because its lower velocity in the shock frame. Furthermore most of the emission from the HH 223 low-brightness optical nebula should arise from the gas excited and dragged by the CO outflow and traces an accelerated layer in the cavity walls, since velocities compatible with the ambient gas velocity are only derived at positions on the lower-brightness optical nebula (F filament), out of the F1 faint knot.
In order to complete the knowledge of HH 223, it would be useful to map the whole extent of the emission with higher spatial and spectral resolution, searching for the knot substructures and resolving the contributions to the emission coming from the supersonic outflow and from the dragged, excited nebular gas. In addition, spectra through knot A, covering a wavelength range including the [Fe ii] 13F and 14F multiplets, are needed in order to properly derive around the A2 substructure from the [Fe ii] 7155/8617 ratio, suitable to perform a diagnostic when is higher than 104 cm-3, where the [S ii] 6716/6731 ratio is not density sensitive.
Acknowledgements.
We acknowledge the support astronomer Amanda D. Anlaug her help with the data acquisition and Chin-Fei Lee for providing us the FITS file of the CO emission in L723. The work of C.C.-G., R.E., R.L. and A.R. was supported by the Spanish MEC grant AYA2005-08523-C03 and the MICINN grant AYA2008-06189-C03 (co-funded with FEDER funds). C.C.-G. acknowledges support from a MEC (Spain) FPU fellowship and from Junta de Andalucía (Spain). R.L. acknowledges support from the OPTICON Access Programme. ALFOSC is owned by the Instituto de Astrofísica de Andalucía (IAA) and operated at the NOT under agreement between IAA and the NBIfAFG of the Astronomical Observatory of Copenhagen. We thank the referee, John Bally, for his useful comments.References
- (1) Anglada, G., Rodríguez, L.F., & Torrelles, J.M., 1996, ApJL, 473, 123.
- (2) Bacciotti, F. & Eislöffel, J 1999, A&A 342, 717.
- (3) Cantó, J., 1981 in Investigating the Universe, ed. F. Kahn (Dodrecht:Reidel), 95.
- (4) Carrasco-González, C., Anglada, G., Rodríguez, L.F. et al., 2008, ApJ, 676, 1073.
- (5) Estalella, R., Palau, A., Girart, J. M. et al., 2003, Rev. Mex. Astron. Astrof. C. S., 15, 135.
- (6) Gålfalk, M. & Olofsson, G., 2007, A&A, 475, 281.
- (7) Girart, J. M., Estalella, R., Anglada, G. et al., 1997, ApJ, 489, 743.
- (8) Girart, J. M., Rao, R. & Estalella, R., 2008, ApJ, accepted.
- (9) Goldsmith, P.F., Snell, R.L., Hemeon-Heyer, M., & Langer, W.D., 1984, ApJ, 286, 599.
- (10) Hartigan, P., Morse, J.A. & Raymond, J., 1994, ApJ, 436, 125.
- (11) Lee, C.F., Mundy, L.G., Stone, J.M., & Ostriker, E.C., 2002, ApJ, 576, 294.
- (12) López, R, Estalella, R., Gómez, G., Riera, A., 2006, A&A, 454, 233.
- (13) López, R., Acosta-Pulido, J.A. et al., 2009, in preparation.
- (14) Meaburn, J., & White, N.J., 1982, MNRAS, 199, 121.
- (15) Palacios, J., & Eiroa, C., 1999, 346, 233.
- (16) Raga, A.C., Böhm, K.-H. & Cantó, J., 1996, RevMexAA, 32, 161.
- (17) Riera, A., López, R., Raga, A.C., Estalella, R., Anglada, G., 2003, A&A, 400, 213.
- (18) Shirley, Y., Evans, N. J., & Rawlings, J., 2002, ApJ, 575, 337.
- (19) Torrelles, J.M., Ho, P.T.P, Moran, J.M., Rodríguez, L.F., Cantó J., 1986, ApJ, 307, 787.
- (20) Vrba, F.J., Luginbuhl, C.B., Strom, S.E., Strom, K.M.& Heyer, M.H., 1986, AJ, 92, 633.