Mesoscale dynamics on the Sun’s surface
from HINODE observations
Abstract
Aims. The interactions of velocity scales on the Sun’s surface, from granulation to supergranulation are still not understood, nor are their interaction with magnetic fields. We thus aim at giving a better description of dynamics in the mesoscale range which lies between the two scales mentioned above.
Methods. We analyse a 48h high-resolution time sequence of the quiet Sun photosphere at the disk center obtained with the Solar Optical Telescope onboard Hinode. The observations, which have a field of view of 100 ″ 100 ″, typically contain four supergranules. We monitor in detail the motion and evolution of granules as well as those of the radial magnetic field.
Results. This analysis allows us to better characterize Trees of Fragmenting Granules issued from repeated fragmentation of granules, especially their lifetime statistics. Using floating corks advected by measured velocity fields, we show their crucial role in the advection of the magnetic field and in the build up of the network. Finally, thanks to the long duration of the time series, we estimate that the turbulent diffusion coefficient induced by horizontal motion is approximately .
Conclusions. These results demonstrate that the long living families contribute to the formation of the magnetic network and suggest that supergranulation could be an emergent length scale building up as small magnetic elements are advected and concentrated by TFG flows. Our estimate for the magnetic diffusion associated with this horizontal motion might provide a useful input for mean-field dynamo models.
Key Words.:
The Sun: Atmosphere – The Sun: Granulation – The Sun: Magnetic fields1 Introduction
The transport and evolution of magnetic flux over the solar surface are linked to the turbulent flows developing within the solar convection zone. Indeed, magnetic fields are observed in complex and hierarchical structures covering widely different scales which emerge and disappear on the time-scales of turbulent convective patterns. This continual reconfiguration of surface magnetism by surface flows plays a significant role in determining the topology and evolution of coronal magnetic fields. It may notably influence the triggering of eruptive events such as flares or sudden disappearance of solar filaments. Hence, understanding the distribution and transport of magnetic flux at the solar surface is of primary importance to describe many aspects of solar magnetism.
To reproduce the surface distribution of magnetic flux, different types of processes are included in models: active regions dynamics, differential rotation, meridional circulation and diffusion across the supergranular network Ossendrijver (2003). Supergranules are known to dominate the evolution and diffusion of surface magnetic fields underlying coronal and heliospheric fields, as evidenced by the structure of both active and quiet magnetic networks. They are distributed over the entire solar surface, indicating that the corresponding velocity field is always present to carry magnetic flux. Moreover, evidence of connections between supergranulation, interplanetary magnetic field and solar energetic particules has been demonstrated with measurements of ions from the impulsive solar Flare with the Advanced Composition Explorer (ACE) spacecraft and numerical simulations of the propagation of energetic particles Giacalone et al. (2000). Solar wind outflow sources have also been located, with the SUMER/SOHO instrument, along the boundaries and boundary intersections of the magnetic network, which delineates supergranulation Hassler et al. (1999). More recently, Aiouaz (2008) reported evidence of continuous reconnections at the boundaries of the supergranular network lanes in the quiet Sun and coronal holes. He proposed a scenario involving reconnections between the strong network magnetic field at supergranule boundaries and the continuously advected weak field from the supergranular cell interior. From many points of view, it therefore seems essential to have a good understanding of supergranular flows to construct accurate models of surface and atmospheric magnetic activity of the Sun.
Supergranulation is usually assumed to be the surface imprint of deeper convective motion. Why this scale is so prominent amongst all the continuum of scales remains unexplained. As the convection zone is strongly turbulent and highly stratified in density, numerical modelling reaching supergranular scales has proven difficult so far DeRosa & Toomre (2004); Rincon et al. (2005); Georgobiani et al. (2007) so that the dynamics at these scales remain poorly understood. Supergranules are traditionally described as convection eddies with horizontal flows diverging from a cell centre and subsiding flows at the cell boundaries and horizontal currents associated with each supergranule are believed to sweep magnetic fields to its borders. Different theoretical approaches try to explain the driving of supergranulation (see a summary in DeRosa & Toomre, 2004). For instance, the spatial correlations between exploding granules may drive a large-scale instability injecting energy at supergranular scales Rieutord et al. (2000); another scenario suggests that granules impose fixed thermal flux boundary conditions, triggering a convection flow at scales larger than granulation Rincon & Rieutord (2003). Rast (2003) suggested that interacting downwards flows cluster and produce the scale of meso or supergranules. The picture is further complicated by the results of Gizon et al. (2003) and Schou (2003) who suggested that supergranulation was associated with a wave pattern; Rast et al. (2004) and Lisle et al. (2004), using a similar approach, however argued that the spectrum of supergranulation was instead consistent with two nonoscillatory flows identified with the mesogranular and supergranular scales having different rotation rates. Overall, it is clear that the physical nature of supergranulation is still in debate and that new accurate measurements are required in order to obtain more clues regarding its physical origin. Addressing this problem most notably requires high-resolution observations of the solar surface dynamics over a large field-of-view and for several consecutive hours.
In this paper, we study photospheric motion using new data obtained with the Hinode satellite, that fulfill some of these requirements. We particularly focus on their relation to the magnetic field network, by identifying and following Tree of Fragmenting Granules (TFGs) introduced by Roudier et al. (2003). These features, also called families of granules, are an appropriate tool to quantify the temporal and spatial organization of the solar granulation at larger scales. In Section 2 we describe an exceptionally long (48h), multi-wavelength, time-sequence of observations obtained with Hinode/SOT. New statistics on TFGs are given in Section 3. Section 4 describes a correlation between the photospheric network and the evolution of a passive scalar and magnetic field location. Our conclusions are presented in Section 5.
2 Observations and data reduction
We used multi-wavelength data sets of the Solar Optical Telescope (SOT), aboard the Hinode 111The Hinode spacecraft, launched in 2006, was designed and is now operated by JAXA (Japanese Space Authorities) in cooperation with NASA (National Aeronautics and Space Administration) and ESA (European Space Agency). mission (e.g. Suematsu et al., 2008; Ichimoto et al., 2004). The SOT has a 50 cm primary mirror with a spatial resolution of about 0.2 ″at 550 nm.
For our study, we used multi-wavelength observations from Hinode/SOT NFI (NarrowBand Filter Imager) and BFI (Broadband Filter Imager). This instrument measures the Stokes profiles of the FeI line at 630.2 nm with a spatial resolution 0.16 ″. More precisely, the Lyot filter is set to a single wavelength in the blue wing of the line, typically mÅfor the Fe I magnetograms. Then images are taken at various phases of the rotating polarization modulator and added or subtracted into a smart memory area in the on-board computer. The units of both I and V images in both Level-0 and Level-1 are ”data numbers” or DN. The BFI scans consist of time sequences obtained in the Blue Continuum (450.4nm), G band (430.5nm) and Ca II H (396.8nm).
The observations were recorded continuously from 29 August 10:17 UT to 31 August 10:19UT 2007, except for a 7 minute interruption at the disk center on 30 august at 10:43 UT. The solar rotation is compensated for in order to observe exactly the same region of the Sun. The time step between two successive frames is 50.1 sec. The field of view with BFI observations is with a pixel of 0109 (). After alignment, the useful field-of-view reduced to .
To remove the effects of oscillations, we applied a subsonic Fourier filter. This filter is defined by a cone in the space, where k and are spatial and temporal frequencies. All Fourier components such that are retained so as to keep only convective motion Title et al. (1989). To detect TFGs, granules were labeled in time as described in Roudier et al. (2003).
3 TFG detection and temporal properties
3D analysis of the granular intensity field demonstrates that a significant fraction of the granules in the photosphere are organized in the form of TFGs Roudier et al. (2003). A TFG consists of a family of repeatedly splitting granules, originating from a single granule. Since our data set is composed of two continuous sequences of 24h separated by a gap of 7 minutes, we first analyse separately each of the 24h series and then connect them together to determine the evolution of TFGs over 48h.
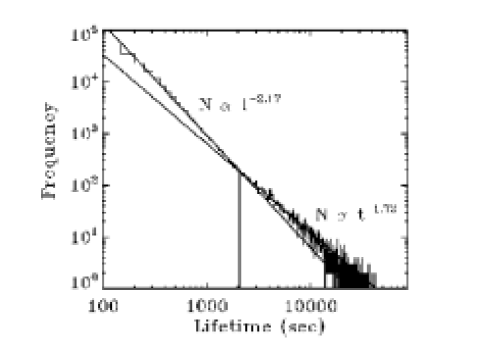
As shown in Fig. 1, the distribution of the lifetime of the TFGs can be fitted by two power laws with exponents and for TFGs shorter and longer than 2100 s respectively. The second exponent, , is identical to the one previously found with a 8.75 h image series obtained with the Swedish Vacuum Solar Telescope at La Palma Roudier et al. (2003). Howewer, we find a different exponent for TFGs with lifetimes shorter than 2100. This time scale seems to correspond to the longest isolated granules, which do not create a TFG. The Hinode data which are free of atmospheric seeing allows us to continuously follow the smallest granules. This explains why we detect more TFGs with shorter lifetimes than with the ground based La Palma data. We conclude on the existence of two different kinds of TFGs characterized by their lifetime. The shorter lifetime TFGs appear scattered everywhere in the field of view between the longest TFGs. The slope of for the longest TFGs is robust and easily reproducible; It would be interesting in the future to determine this slope using large cartesian numerical simulations of solar surface convection including scales up to the supergranulation scale (e. g. Georgobiani et al., 2007).
As some TFGs turn out to last longer than 24h, we connected the two time series, filling the 7 min gap with the following strategy: using the first time sequence, we compare the distribution of families at 24h-7mn and at 24h. We observe that the area variation was not more than 3%. We thus assumed that during the gap, the change was not larger and decided that families at 24h could be reported as such at 24h+7mn, i.e. at the beginning of the second series. The alignment of the two sequences was also checked using the CaII and G-band data. In doing so, we managed to make an image sequence lasting 47h23min and covering a field of view of . Using this very long sequence, we could improve the statistics of data in Fig. 1, and found that the lifetime of TFGs could reach 43h50mn (within our field).
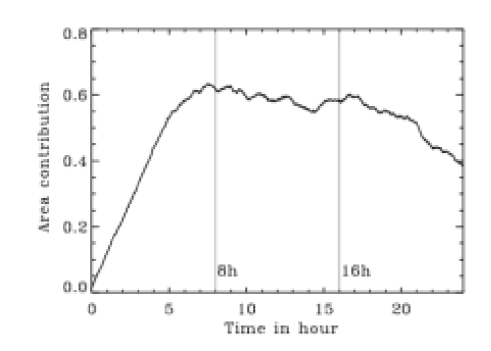
Although the number of TFGs decreases with lifetime, long-lived TFGs cover a significant fraction of the solar surface. This is shown in Fig. 2, where the fraction of the total area covered by granules belonging to TFGs living more than 8h is displayed using the first 24h-sequence. This plot shows that 60% of the area is covered by families living longer than 8h. This fraction steadily increases during the first 8 hours because, during this period of time, many granules are still associated with families that were born before the beginning of the time-sequence and therefore appear to have a shorter lifetime. It also slightly decreases at the end of the sequence since the time window cuts the last born TFGs. If we now include more short-lived TFGs, reducing the lifetime threshold to 2 hours, then we find that the surface coverage increases up to 88%. This is greater than the 62% that we found with the La Palma data. The difference is due to a better labeling of granules (no seeing and distortion), and a longer duration of the sequence allowing better statistics.
4 Network and cork distributions
4.1 Velocity fields
To further investigate the solar surface dynamics, we now focus our attention on the velocity fields and their transport properties. The velocity field is determined using the classical local correlation tracking (LCT) algorithm (e.g. Roudier et al., 1999) using a spatial window FWHM of 3 ″and a temporal window of 30 minutes. The typical rms velocity is 300 m/s. As in Meunier et al. (2007) and Rieutord et al. (2008), we find that the probability distribution functions of divergence at scales larger than 10 Mm show a net excess, compared to a Gaussian distribution, in the positive wing, suggesting intermittency in solar surface convection.
4.2 Cork motions
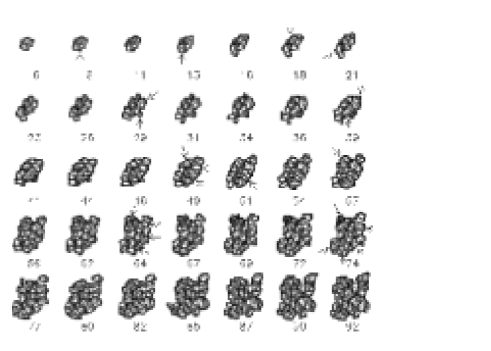
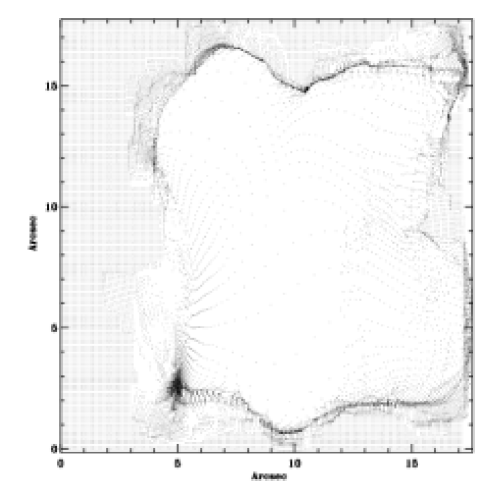
The transport properties at the surface of the turbulent velocity field are best illustrated using the evolution of an initially uniformly distributed passive scalar; the image is classically that of floating corks Simon et al. (1994). The corks are deposited on the meshes of a regular grid at initial time and their surface distribution is followed during the whole sequence as they are advected by the horizontal velocity field. Fig. 3 displays the corks distribution resulting from the evolution of a TFG depicted in Fig. 6. The isolated action of the velocity field within an isolated TFG leads to the advection of 90% corks at a mesogranular scale on a timescale of between two and four hours (flows are not taken into account outside of the isolated TFG). A comparison with the underlying families shows that they are simply expelled from a given family. The first snapshots of Fig. 4 clearly show this phenomenon. At later times, the corks remain more or less at the TFG boundaries as can be seen in Fig. 5. As we have shown in our previous paper Roudier et al. (2003) (fig,11,12 and 13), TFGs are equivalent to a diverging flow at mesoscales. So, this scale is persistent up to 43h corresponding, in the Hinode data, to the TFG itself or to some TFG branches for the longest living TFG. The large scale TFGs are probably the smallest supergranular sizes.
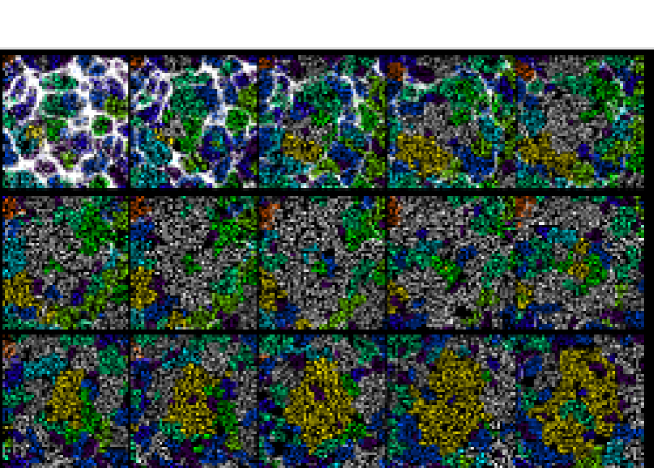
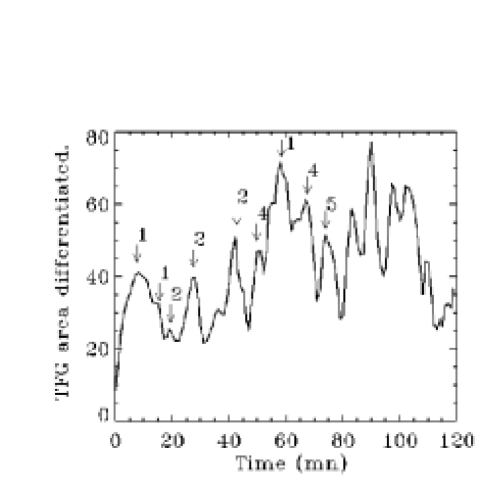
Investigating the mechanism of this fast transport, we found that exploding granules are the key features generating these motions. Fig. 6 displays in detail the evolution of a family; the arrows indicate the location of the observed explosion during 1h25mn. The evolution of the time derivative of the family area is plotted in Fig. 7. It demonstrates that each increase of the total area of this family is related to granule explosions whose number is quoted over each peak of the curve. Hence, we observe that the family grows in area by a succession of granule explosions, which are correlated in time, thereby expelling the corks.
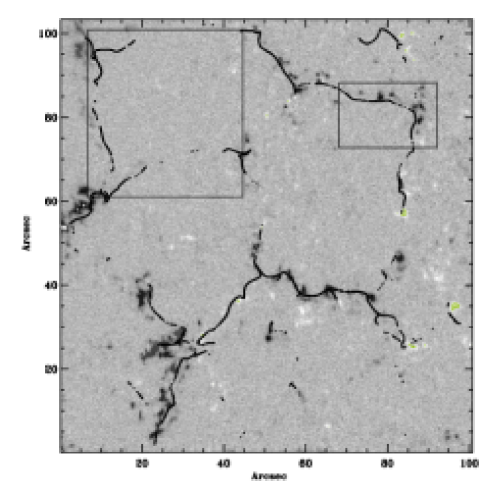
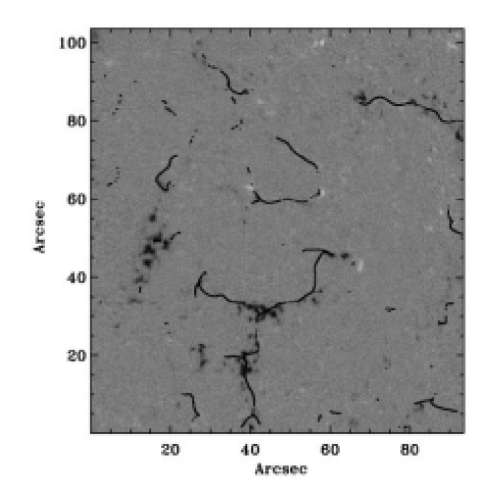
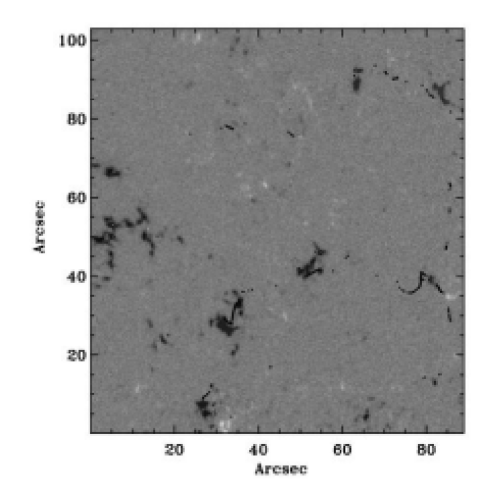
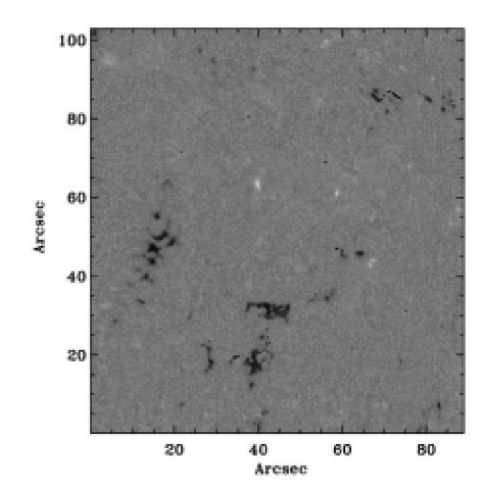
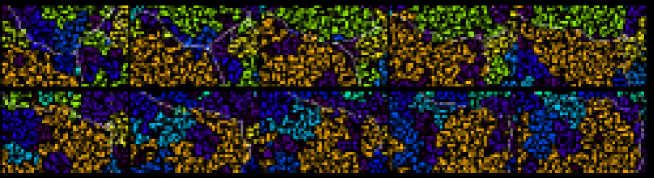
Fig. 4 also shows the connection of families and the supergranular scale. In the second frame of this figure we note the birth of a white family. Then, the successive frames show its evolution and its surface growing up to frame 9. In frame 10, one can see a new yellow TFG birth, which growth in the following frames and pushes the initial white TFG. We observe that the distribution of corks at the supergranular scale also results from the combined action of long-lived TFGs that are close spatially and more or less in the same phase of their evolution. Their mutual interactions tend to expulse corks of the area they cover on 3h-4h and concentrate the corks in the magnetic network, at supergranular scales in approximatively 6h-8h. One example of this evolution can be seen in our data (and movies) in the center of the field of view where two long-lived TFGs are competing for their development.
On longer timescales, long living families tend to structure the cork distribution either by successive birth at the same location, or by interaction of two or more competing TFGs which are located in close proximity and in the same phase of their evolution. Overall, the formation of this pattern depends on the TFG relative size and lifetime but seems to be mostly governed by long-lived TFGs.
4.3 Corks and magnetic fields
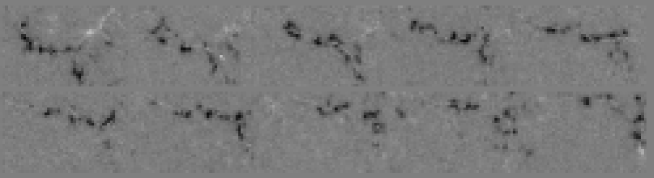
When longer time scales are considered it is well known that corks, like the magnetic field, concentrate on the supergranule boundaries (e.g. Rieutord et al., 2000; Krijger & Roudier, 2003). The quality of the data (free of atmospheric seeing) and the length of the time sequence allow us to provide a very clear illustration of this phenomenon. To determine the magnetic field distribution, we use Stokes V which is usually considered as a proxy for the radial magnetic field at the disk centers.
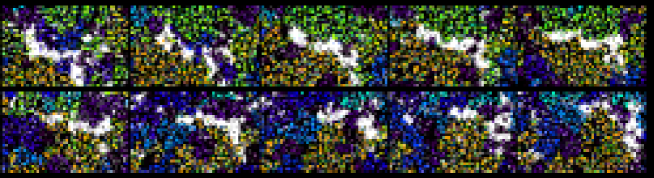
In Fig. 5, we see that magnetic fields, like corks, lie at the boundaries of granule families. In this figure, we clearly observe that the spatial evolution of the magnetic field (or corks) are related to the geometric evolution of the long lived TFG (shown here in orange). This demonstrates the physical action of the TFG on the magnetic field patch displacement over the solar surface and shows that plasma governs magnetic elements at the TFG scale in the quiet Sun. Fig. 8 and 9 illustrate the same result at a larger scale when cork motion has been followed for 24h. Most of the corks (70%) are still in the field-of-view at the end of each sequence. They exactly match the position of the highest magnetic flux concentration of the network, which lies on supergranule boundaries. The network boundaries defined by these patches are incomplete, with spatially intermittent sites of high magnetic flux density well correlated with sites of strong convergence.
If we further monitor the motion of the corks using the 48h-sequence, we find that after such a long time, 60% of the corks remain in the field-of-view, trapped in a small area of 10 Mm2, which also displays the most intense magnetic fields. This is illustrated in Figs. 10 and 11.
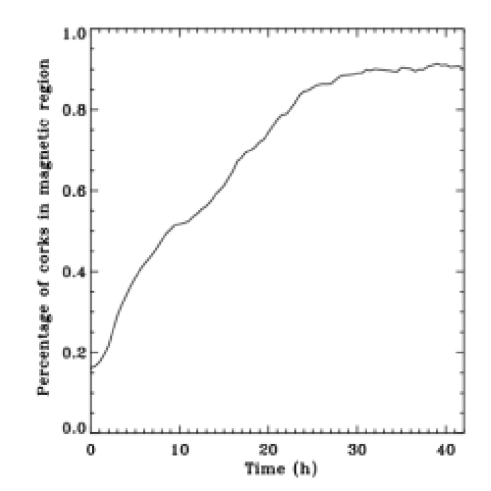
Furthermore, if we monitor the number of corks inside magnetic regions (we use a threshold of 45 SOT data number to detect the magnetic network, which corresponds, by using a raw calibration described in Chae et al. (2007), to 248 Gauss), we find, as shown in Fig. 12, that 90% of the corks in the field end up in magnetic patches. Furthermore, monitoring the number of corks inside magnetic regions, we find that 90% of the corks in the field end up in magnetic patches (see Fig. 12). Note that a threshold of 45 SOT data number is used in Stokes V images to detect the magnetic network. Using a raw calibration described in Chae et al. 2007, this number correspondsto a field amplitude of 248 Gauss). This is particularly visible in movies222http://www.lesia.obspm.fr/~malherbe/papers/Hinode2008/ of the evolution of both the magnetic field and the TFGs, which show that magnetic fields, squeezed between TFGs, follow their displacement while drifting along their boundaries; at some time, they meet a vertex of TFG boundaries and become stabilized there, forming a patch.
As noted before, this patchy distribution of magnetic fields is closely associated with sites of strong flow convergence. These sites coincide with vertices of supergranular flow cells and presumably correspond to downflows, as required by mass conservation on the supergranular scale Crouch et al. (2007). The observed stabilization of magnetic patches at supergranular scales possibly indicates that the dynamical Lorentz force feedback provided by these concentrated patches is sufficiently strong to oppose the flow at scales comparable to the supergranular scale, which might explain the emergence of this particular scale in the velocity power spectrum of the quiet Sun.
4.4 Horizontal turbulent diffusion
Lastly, cork motion allows the measurement of the horizontal turbulent diffusivity at the surface of the Sun. The turbulent magnetic diffusion is an important quantity for mean-field dynamos Brandenburg & Subramanian (2005); Rieutord (2008) as it controls the timescale of the dynamo oscillations (in the case of a time-periodic dynamo). Thus several authors have evaluated this quantity. For instance, Simon et al. (1995), using a kinematic model tuned to match supergranulation properties, find diffusivities in the range 500 to 700 km2/s. With the very long time series that we have at our disposal, we can make a direct evaluation of this coefficient based on the precise plasma flow. However, because we use granules to determine the flow, the horizontal velocity fields are filtered at all scales below 2.5Mm (see Rieutord et al., 2001). Thus we give an estimate of the diffusivity imposed by the scales above 2.5Mm.
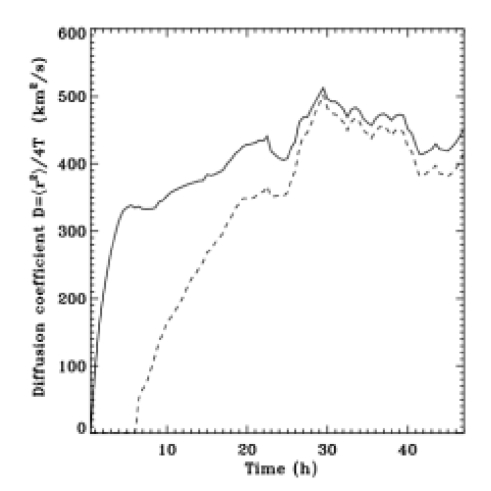
As in other works, the diffusion coefficient is estimated from , where means the mean displacement of all particles (corks) at time . As shown in Fig. 13 (solid line), after a rapid growth due to advection by the dominant mean flow (typically the mesogranular scale velocities), the diffusion coefficient seems to converge to a value of . The diffusion coefficient also was computed with a starting reference position at time 6h where the corks are at the mesoscale boarder. We observe that the cork motion along the mesoscale converge at around 29 hours to the same value of the diffusion coefficient near a value of 430 km2/s. This indicates that corks and patches of corks are always in movement due to the TFG evolution. The figure shows, for the first time, the importance of using long time series for this estimate. Saturation is indeed obtained only after 24hrs. With shorter time sequences we could expect a growth beyond the present value. Finally, even though this may be a coincidence, we note that the implied diffusion timescale over the solar magnetic belts, namely ()2/430, is 11yrs ().
5 Discussion and conclusion
Thanks to the Solar Optical Telescope onboard Hinode, we have been able to monitor with high spatial and temporal resolution, free of atmospheric seeing, a region of the Sun’s photosphere for two days. The field was wide enough to contain 4 supergranules and thus to examine their internal dynamics.
Using the TFG concept we could quantify the temporal and spatial correlations in the evolution of granules. The typical size of mature TFGs suggest that they trace some mesoscale rising plumes. In the previuos debate on the specificity of mesogranulation as a genuine scale of sub-photospheric convection rather then a mere extension of granular flow Straus & Bonaccini (1997); Rieutord et al. (2000), TFGs point towards the genuine scale. In this scenario, granulation would be the boundary layer of these flows. However, since solar convection is driven by the strong cooling of the Sun’s surface, it may still be that mesoscale flows are forced by the granulation layer. At this stage, it is clear that numerical simulations are necessary to better understand the connection between the dynamics of the surface layers and that of the deeper ones.
From our analysis, we observe that most of the granules visible on the solar surface belong to the long-lived TFGs, indicating that these families structure the flow. The evolution of floating corks demonstrates that the final state of passively advected quantities like weak magnetic elements is a patchy distribution on the boundaries of a supergranule, which correspond presumably to stable downward flows. The stabilization of magnetic patches in these areas suggests that supergranulation could be an emergent length scale building up as weak small-scale magnetic elements are advected and concentrated by TFG flows, occasionally colliding and aggregating to form larger and stronger magnetic patches, eventually resisting the flow dynamically. The temporal evolution of magnetic elements, corks and TFGs are available at http://www.lesia.obspm.fr/~malherbe/papers/Hinode2008/.
Two kind of interactions between TFGs are mainly observed to diffuse the corks to the limit of supergranular scales. The first one corresponds to successive long-lived TFG births at the same location, whose combined motions sweep corks to network scales; parts of older TFGs, with a classical mesoscale, are pushed away by new TFGs, thereby contributing to the formation of a larger scale comparable to the supergranular scale. The second process is the common action of two or more close long-lived TFGs born more or less at the same time, which push corks to the network limit. The temporal co-spatiality between magnetic fields and corks in our time sequence analysis implies that the evolution of the distribution of magnetic fields is clearly driven by TFGs on the Sun’s surface. A relation between mesoscale flows and the distribution of magnetic elements was also reported by Domínguez Cerdeña (2003), Domínguez Cerdeña et al. (2003), Rouppe van der Voort et al. (2005) and Lites et al. (2007) .
Finally, the length of the monitoring time window (48h) allowed us to directly estimate the diffusion coefficient induced by horizontal motion at scales larger than 2.5 Mm. We found a value of , which might be helpful to design mean-field dynamo models.
Satellites like Hinode/SOT or the future SDO as well as large field-of-view ground based instruments like CALAS at Pic du Midi now enable us to study the full complexity of the interactions of multiple scales of convection and magneticfields at the solar surface. In this paper we have shown that identifying and following coherent structures like TFGs can help us understand the detailed physics of these interactions and how they relate to the solar cycle.
Acknowledgements.
We are grateful to the Hinode team for the possibility to use their data. Hinode is a Japanese mission developed and launched by ISAS/JAXA, collaborating with NAOJ as a domestic partner, NASA and STFC (UK) as international partners. Scientific operation of the Hinode mission is conducted by the Hinode science team organized at ISAS/JAXA. This team mainly consists of scientists from institutes in the partner countries. Support for the post-launch operation is provided by JAXA and NAOJ (Japan), STFC (U.K.), NASA, ESA, and NSC (Norway).This work was (partly) carried out at the NAOJ Hinode Science Center, which is supported by the Grant-in-Aid for Creative Scientific Research ”The Basic Study of Space Weather Prediction” from MEXT, Japan (Head Investigator: K. Shibata), generous donations from Sun Microsystems, and NAOJ internal funding. We thank the CNRS/INSU for support of the one-year sabbatical of D. Brito at LATT (while member of LGIT, Université Joseph-Fourier, CNRS in Grenoble). This work was supported by the Centre National de la Recherche Scientifique (C.N.R.S., UMR 5572), by the Programme National Soleil Terre (P.N.S.T.).References
- Aiouaz (2008) Aiouaz, T. 2008, ApJ, 674, 1144
- Brandenburg & Subramanian (2005) Brandenburg, A. & Subramanian, K. 2005, Phys. Rep., 417, 1
- Chae et al. (2007) Chae, J., Moon, Y.-J., Park, Y.-D., et al. 2007, PASJ, 59, 619
- Crouch et al. (2007) Crouch, A. D., Charbonneau, P., & Thibault, K. 2007, ApJ, 662, 715
- DeRosa & Toomre (2004) DeRosa, M. L. & Toomre, J. 2004, ApJ, 616, 1242
- Domínguez Cerdeña (2003) Domínguez Cerdeña, I. 2003, A&A, 412, L65
- Domínguez Cerdeña et al. (2003) Domínguez Cerdeña, I., Sánchez Almeida, J., & Kneer, F. 2003, A&A, 407, 741
- Georgobiani et al. (2007) Georgobiani, D., Zhao, J., Kosovichev, A. G., et al. 2007, ApJ, 657, 1157
- Giacalone et al. (2000) Giacalone, J., Jokipii, J. R., & Mazur, J. E. 2000, ApJ, 532, L75
- Gizon et al. (2003) Gizon, L., Duvall, T. L., & Schou, J. 2003, Nature, 421, 43
- Hassler et al. (1999) Hassler, D. M., Dammasch, I. E., Lemaire, P., et al. 1999, Science, 283, 810
- Ichimoto et al. (2004) Ichimoto, K., Tsuneta, S., Suematsu, Y., et al. 2004, in Society of Photo-Optical Instrumentation Engineers (SPIE) Conference, Vol. 5487, Optical, Infrared, and Millimeter Space Telescopes, ed. J. C. Mather, 1142–1151
- Krijger & Roudier (2003) Krijger, J. M. & Roudier, T. 2003, A&A, 403, 715
- Lisle et al. (2004) Lisle, J. P., Rast, M. P., & Toomre, J. 2004, ApJ, 608, 1167
- Lites et al. (2007) Lites, B., Socas-Navarro, H., Kubo, M., et al. 2007, PASJ, 59, 571
- Meunier et al. (2007) Meunier, N., Tkaczuk, R., Roudier, T., & Rieutord, M. 2007, A&A, 461, 1141
- Ossendrijver (2003) Ossendrijver, M. 2003, The Astron. Astroph. Review, 11, 287
- Rast (2003) Rast, M. P. 2003, ApJ, 597, 1200
- Rast et al. (2004) Rast, M. P., Lisle, J. P., & Toomre, J. 2004, ApJ, 608, 1156
- Rieutord (2008) Rieutord, M. 2008, C. R. Physique, 9, 757
- Rieutord et al. (2008) Rieutord, M., Meunier, N., Roudier, T., et al. 2008, A&A, 479, L17
- Rieutord et al. (2001) Rieutord, M., Roudier, T., Ludwig, H.-G., Nordlund, Å., & Stein, R. 2001, A&A, 377, L14
- Rieutord et al. (2000) Rieutord, M., Roudier, T., Malherbe, J. M., & Rincon, F. 2000, A&A, 357, 1063
- Rincon et al. (2005) Rincon, F., Lignières, F., & Rieutord, M. 2005, A&A, 430, L57
- Rincon & Rieutord (2003) Rincon, F. & Rieutord, M. 2003, in SF2A-2003: Semaine de l’Astrophysique Francaise, ed. F. Combes, D. Barret, T. Contini, & L. Pagani, 103
- Roudier et al. (2003) Roudier, T., Lignières, F., Rieutord, M., Brandt, P. N., & Malherbe, J. M. 2003, A&A, 409, 299
- Roudier et al. (1999) Roudier, T., Rieutord, M., Malherbe, J., & Vigneau, J. 1999, A&A, 349, 301
- Rouppe van der Voort et al. (2005) Rouppe van der Voort, L. H. M., Hansteen, V. H., Carlsson, M., et al. 2005, A&A, 435, 327
- Schou (2003) Schou, J. 2003, ApJ, 596, L259
- Simon et al. (1994) Simon, G. W., Brandt, P. N., November, L., Scharmer, G. B., & Shine, R. A. 1994, in Solar Surface Magnetism, ed. R. Rutten & C. Schrijver (Kluwer), 261
- Simon et al. (1995) Simon, G. W., Title, A. M., & Weiss, N. O. 1995, ApJ, 442, 886
- Straus & Bonaccini (1997) Straus, T. & Bonaccini, D. 1997, A&A, 324, 704
- Suematsu et al. (2008) Suematsu, Y., Tsuneta, S., Ichimoto, K., et al. 2008, Sol. Phys., 249, 197
- Title et al. (1989) Title, A. M., Tarbell, T. D., Topka, K. P., et al. 1989, ApJ, 336, 475