Chemical stratification in the Orion Bar: JCMT Spectral Legacy Survey observations
Abstract
Context. Photon-dominated regions (PDRs) are expected to show a layered structure in molecular abundances and emerging line emission, which is sensitive to the physical structure of the region as well as the UV radiation illuminating it.
Aims. We aim to study this layering in the Orion Bar, a prototypical nearby PDR with a favorable edge-on geometry.
Methods. We present new maps of 22 fields at 14″–23″ resolution toward the Orion Bar in the SO 88–99, H2CO 515–414, 13CO 3–2, C2H 49/2–37/2 and 47/2–35/2, C18O 2–1 and HCN 3–2 transitions.
Results. The data reveal a clear chemical stratification pattern. The C2H emission peaks close to the ionization front, followed by H2CO and SO, while C18O, HCN and 13CO peak deeper into the cloud. A simple PDR model reproduces the observed stratification, although the SO emission is predicted to peak much deeper into the cloud than observed while H2CO is predicted to peak closer to the ionization front than observed. In addition, the predicted SO abundance is higher than observed while the H2CO abundance is lower than observed.
Conclusions. The discrepancies between the models and observations indicate that more sophisticated models, including production of H2CO through grain surface chemistry, are needed to quantitatively match the observations of this region.
Key Words.:
ISM: molecules – ISM: structure – ISM: individual: Orion Bar – stars: formation1 Introduction
In photon-dominated regions (PDRs), UV radiation between a few and 13.6 eV drives the thermal and chemical balance of interstellar gas (Hollenbach & Tielens 1999, and references therein). PDRs are ubiquitous in the universe: surfaces of molecular clouds adjacent to H ii regions, planetary nebulae, protoplanetary disks and also the nuclei of distant active galaxies. As such, PDRs are signposts of radiative feedback processes driven by star formation. Heating proceeds through photo-electric emission from dust grains and cooling is mostly due to fine-structure emissions of [C ii] and [O i], and CO rotational lines (e.g., Sternberg & Dalgarno 1995; Kaufman et al. 1999; Meijerink & Spaans 2005; Röllig et al. 2007). Shielding of the UV radiation by dust and gas creates a layering structure where a sequence of different chemical transitions is produced by the gradual attenuation of the UV field (Ossenkopf et al. 2007).
The Orion Bar is a prototypical PDR located between the Orion molecular cloud and the H ii region surrounding the Trapezium stars, at a distance of 414 pc (Menten et al. 2007). Multi-wavelength observations (Tielens et al. 1993; Van der Werf et al. 1996; Hogerheijde et al. 1995; Young Owl et al. 2000; Walmsley et al. 2000) indicate a geometry for the Bar where the PDR is wrapped around the H ii region created by the Trapezium stars and changes from a face-on to an edge-on geometry where the molecular emissions peak. The mean density of the Bar is about cm-3, the mean molecular gas temperature 85 K, and the impinging radiation field is (Hogerheijde et al. 1995), where the Draine field erg s-1 cm-2.
The clumpiness of the PDR inferred by Hogerheijde et al. (1995) was confirmed by interferometric data (Young Owl et al. 2000; Lis & Schilke 2003). Clump densities up to cm-3 were derived by Lis & Schilke (2003) while the density of the interclump medium should fall between a few cm-3 (Young Owl et al. 2000) and cm-3 (Simon et al. 1997). The physical stratification of the PDR is well established (Tielens et al. 1993; Van der Werf et al. 1996; Simon et al. 1997; Lis & Schilke 2003). Vibrationally excited H2 emission is located 15 from the ionization front, where HCO+ 1–0 peaks as well, while the CO peak resides at 20 and CS slightly further in.
This paper presents emission maps of various molecular species, allowing us to probe and understand the chemical stratification in the Orion Bar in greater detail.
2 Observations
This work is based on data obtained as part of the Spectral Legacy Survey (SLS, Plume et al. 2007), being conducted at the James Clerk Maxwell Telescope111The James Clerk Maxwell Telescope is operated by The Joint Astronomy Centre on behalf of the Science and Technology Facilities Council of the United Kingdom, the Netherlands Organisation for Scientific Research, and the National Research Council of Canada. on Mauna Kea, Hawai’i. The SLS is performing spectral imaging of 22 fields in the direction of the Orion Bar and four other targets. Once completed, the spectral range covered by the SLS will be 330–362 GHz. This Letter presents the first results from a selection of molecular lines in the already acquired data: two C2H lines and one transition each of SO, H2CO and 13CO between 330 and 350 GHz, and two lines in auxiliary data in the 230 GHz window: C18O 2–1 and HCN 3–2 (Table 1).
The SLS uses the 16-pixel HARP receiver (325–375 GHz) and the ACSIS correlator. The angular resolution of the JCMT at the observed frequencies is 14–15 (30 mpc at the distance of the Orion Bar); the harp4_mc jiggle position switch mode produces 22 maps sampled every 75. The spectra are calibrated by observations at an off-position 10 to the southeast. At an exposure time of 4 minutes per map pixel, the rms noise level in the current SLS data is 0.07–0.08 K in velocity bins of 0.83–0.89 km s-1. Single sideband system temperatures for these observations are 700 K.
The HCN 3–2 and C18O 2–1 lines were observed in 2005 with the A-band (215–275 GHz) receiver and the DAS spectrometer. The same 22 field as with HARP was mapped at half-beamwidth spacing, using the raster mapping mode. The JCMT beam size at 220–266 GHz is 19–23 (40 mpc). The off-position for the A-band observations was at 20 southeast of the map center. The HCN and C18O observations reach a noise level of 0.5–0.6 K at a spectral resolution of 0.18 and 0.21 km s-1, respectively. System temperature values are 350 K (DSB); the integration time is 19 seconds per map pixel. The pointing accuracy was checked every hour and was generally better than 2″ during all observing runs.
The data were manually reduced using standard Starlink procedures. The SLS observations were handled in blocks of 1.6 GHz effective bandwidth and the other data as one set per emission line. The time series were converted to data cubes and first-order polynomial baselines were subtracted. Line intensities quoted here are given in terms of the main-beam temperature , i.e., they have been corrected for the JCMT main-beam efficiency of 63% in the 345 GHz window and 69% in the 230 GHz window. Single-channel signal-to-noise ratios at the peak in the northeast slice are 16 for C18O and SO, 40 for HCN, H2CO and C2H, and 900 for 13CO.
3 Results
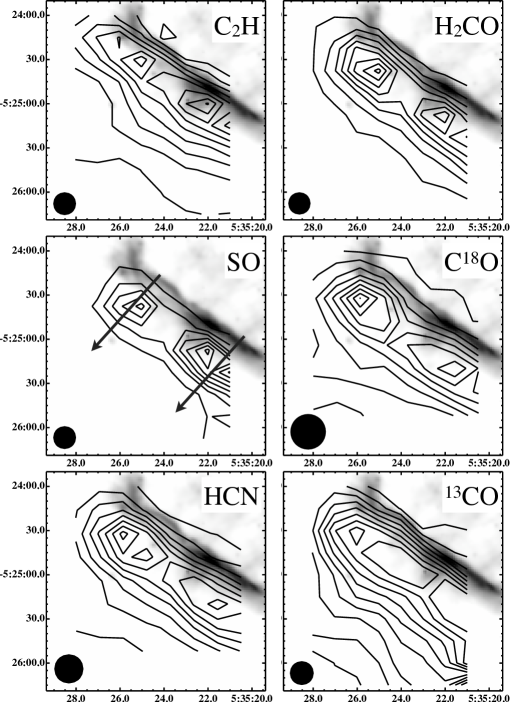
Figure 1 presents images of the observed molecular emission, overlaid on an 8 m image of the Orion Bar taken with the Spitzer Space Telescope (Megeath et al., in prep.). The mid-infrared emission traces warm dust at the surface layer between the H ii region and the molecular cloud. The molecular emission is seen to peak to the southeast of this layer, and the JCMT data reveal a clear stratification. The C2H emission peaks close to the surface layer, followed by SO and H2CO, whereas CO and HCN peak deep into the molecular cloud.
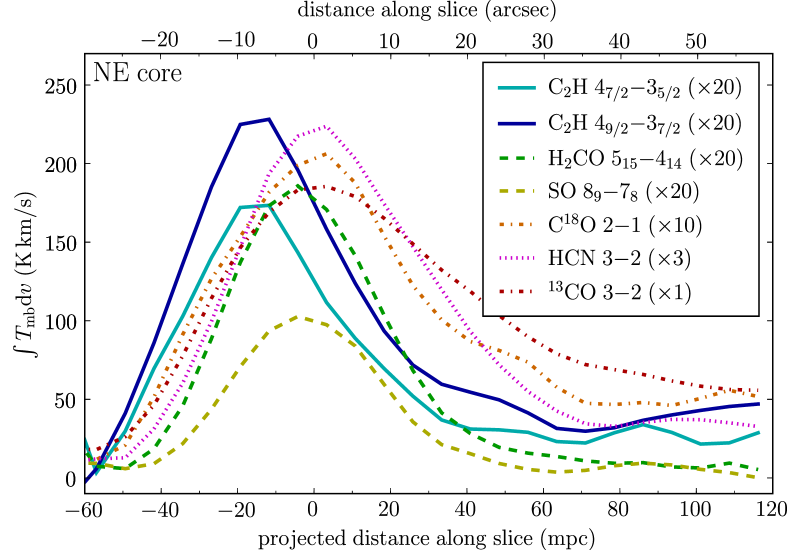
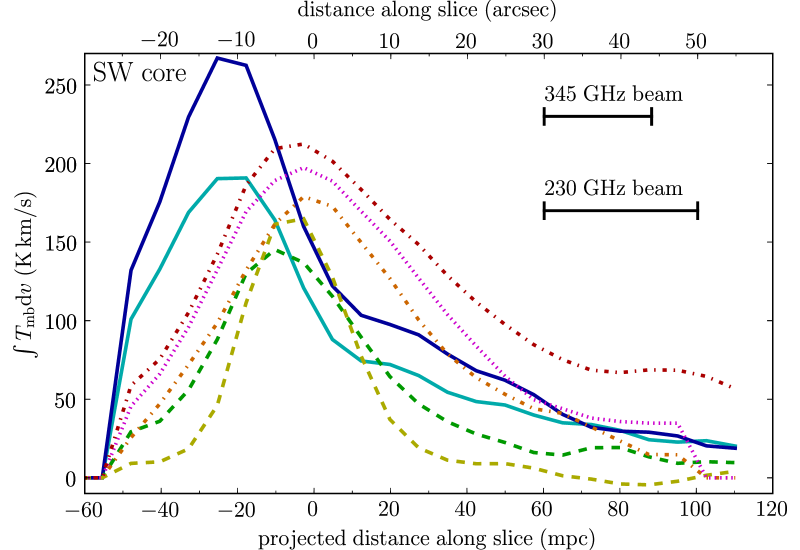
The stratification is more easily visible in Fig. 2 which shows slices through the images in Fig. 1, taken along the arrows in Fig. 1, perpendicular to the ionization front. To produce these intensity profiles, all maps are regridded to 375 pixels, roughly half the pixel size of the original maps. Fitted peak positions and peak fluxes for the seven profiles are listed in Table 1, along with the spectroscopic parameters of the observed lines; the position uncertainties include Gaussian fitting errors ( mpc).
In addition to the stratification, the molecular emission shows a two-peak structure. The northeast peak is brighter in HCN and H2CO, while the southwest peak is brighter in SO and the peak brightness is roughly equal for CO and C2H. These variations are probably caused by variations in the filling factor of dense gas, as seen, e.g., in the high-resolution data by Lis & Schilke (2003). The measured line widths of 5–8 km s-1 will be useful for future detailed modeling, however, this paper focuses on integrated intensities.
We use the observed line intensities and the radiative transfer program RADEX (Van der Tak et al. 2007) to estimate beam-averaged molecular column densities. Although temperatures are known to range from 50 K in dense clumps up to 150 K in the interclump medium (Batrla & Wilson 2003; Lis & Schilke 2003), we assume a kinetic temperature of 85 K and a volume density of 105 cm-3, as applicable to the extended molecular gas (Hogerheijde et al. 1995). Since some of the line emission may originate from dense clumps, we also list column densities estimated in the high-density (LTE) limit (Table 1). Both for the cm-3 case as well as the LTE limit, varying the temperature by 30 K changes the column densities by 30% (where a higher temperature gives a lower column density), so the molecular column densities are reasonably well constrained.
Our values for the column densities agree with previously published values to a factor of 2: Hogerheijde et al. (1995) for H2CO, C18O and HCN, Jansen et al. (1995) for C2H, and Leurini et al. (2006) for SO. The published column densities for HCN and SO are closest to our high-density (LTE) estimates (Table 1); this is consistent with these two species being confined to the high-density gas while the H2CO emission has contributions from both density phases. The spatial distribution of the emission in this work is similar to that of previously observed single-dish emission from molecules such as 12CO, 13CO, HCO+, H2, CN and CS (e.g., Tauber et al. 1994; Van der Werf et al. 1996; Simon et al. 1997).
To convert the observed C18O line intensity to a total H2 column density, we assume an isotopic ratio 16O/18O=500 (Wilson & Rood 1994) and a CO abundance of 1.110-4 as applicable for the Orion Bar PDR (Johnstone et al. 2003). The result is (H2) = 1.01023 cm-2, which implies the following molecular abundances at the peak locations: (C2H) = 210-9; (H2CO) = 410-10; (SO) = 710-10; (HCN) 510-10. Here we have assumed that the emission from all molecules except CO originates in the high-density gas. Based on Jansen et al. (1995), who propose the clumps to encompass 10% of the material along every line of sight, we estimate the clumps to provide for roughly half of the total column density for those molecules that exist in both phases. Hence, the resulting uncertainty in the derived abundances would not exceed a factor 2. Since C2H and CO are hardly coexistent, the C2H abundance is probably underestimated by a factor of 3–10.
| Molecule | Transition | Frequency | Peak position (mpc)(d) | (e) | (cm-2)(g) | ||||||||||
|---|---|---|---|---|---|---|---|---|---|---|---|---|---|---|---|
| (MHz) | (K) | NE slice | SW slice | model | (K km s-1) | =105 cm-3 | LTE | ||||||||
| C2H | = | 349400.5(a) | 42 | -14 | 1.8 | -23 | 1.0 | -16 | 8.6 | 1.6 | 4.41014 | 2.31014 | |||
| C2H | = | 349337.8(b) | 42 | -14 | 1.5 | -23 | 1.6 | -16 | 11.3 | 2.0 | 4.91014 | 2.41014 | |||
| o-H2CO | = | 351768.6 | 62 | -3 | 1.3 | -7 | 1.9 | -12 | 9.3 | 1.6 | 7.71014 | 3.81013 | |||
| SO | = | 346528.5 | 79 | -2 | 1.4 | -5 | 1.0 | 8 | 5.2 | 0.9 | 1.41015 | 7.21013 | |||
| C18O | = | 2 | 1 | 219560.4 | 16 | 0 | 1.2 | 0 | 1.4 | 0 | 20.3 | 3.4 | 2.31016 | 2.91016 | |
| HCN | = | 3 | 2 | 265886.2(c) | 26 | 3 | 2.5 | -1 | 1.8 | 8 | 74.0 | 14 | 6.51012(f) | 4.91013(f) | |
| 13CO | = | 3 | 2 | 330588.0 | 32 | 4 | 1.9 | -1 | 3.0 | 2 | 186 | 32 | 2.11016(f) | 2.51016(f) | |
(a): Blend of =4-3 and =3-2 hyperfine components (separation 1.4 MHz). (b): Blend of =5-4 and =4-3 hyperfine components (separation 1.3 MHz). (c): Blend of =3-3, =3-2 and =2-1 hyperfine components (total separation 1.5 MHz). (d): Fitted position of the emission peak along the slice through the northeast and southwest cores (see Fig. 1), and the modeled slice (Fig. 3, bottom panel), all relative to the C18O peak. (e): Fitted value of integrated intensity at peak position along the northeast slice (see Fig. 1); uncertainties include fitting uncertainty and 15% absolute calibration uncertainty. (f): Column density uncertain due to high optical depth; values listed here are lower limits. (g): Beam-averaged column densities for =105 cm-3 and in LTE, both at =85 K.
4 Discussion
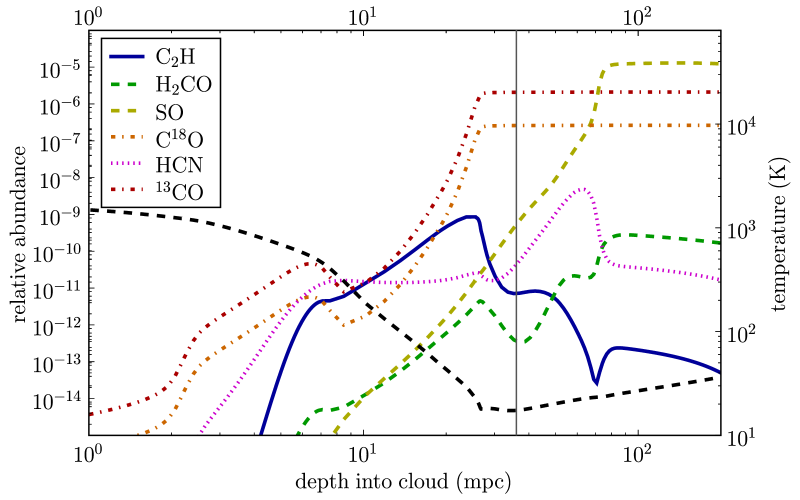
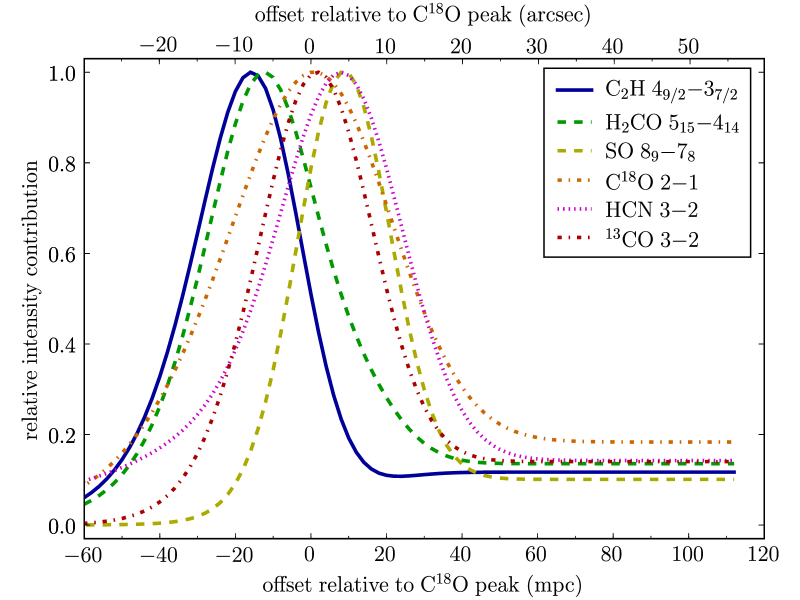
To interpret our observations we compare them to the predictions from a PDR model. Previous models of the Orion Bar do not present abundances for all six species in our data, so we use the global conditions of the Bar (=3104 , = cm-3, see Sect. 1) to construct a simple model using the KOSMA- PDR code (Röllig et al. 2006). We refer to Röllig et al. (2007) for a comparative study of other PDR codes. To simulate the plane-parallel geometry of the Orion Bar we represent it by one side of a very large sphere. Starting from atomic abundances of (O)3.010-4, (C)1.410-4, (S)2.810-5 and (N)1.010-4 (see also Cubick et al. 2008, Table 3), the model computes the equilibrium chemistry and temperature of the cloud using reaction rates from the UMIST database (Woodall et al. 2007). Based on the geometry in Fig. 1 of Jansen et al. (1995) we simulate the PDR as a layer of thickness 49 mpc where the Bar represents a part of the layer that is parallel to the line of sight, so that its apparent depth is increased by a factor 10 compared to its thickness. We note that the critical densities are cm-3 for all transitions in Table 1 except those of the CO isotopes, while the highest H2 density reported by Lis & Schilke (2003) is also cm-3. Hence, to approximate the spatial distribution of the line emission, we assume optically thin LTE and weight the abundance profiles with a Boltzmann cutoff: if and otherwise. Here is a normalized intensity, is abundance, is the modeled local gas temperature (see Fig. 3, top panel), is given in Table 1 and the normalization factor is chosen from line to line. The distribution is convolved with the JCMT beam at the appropriate frequencies to obtain the predicted relative intensity profiles (Fig. 3, bottom panel).
Table 1 compares modeled positions of the peak emission to fitted peak positions in the observed profiles for each species. Overall our simple PDR model matches the observed layering of C2H-H2CO-CO. For H2CO the highest abundance occurs in the cold shielded material, but the warm outer layers dominate the emission due to the higher for the observed transition.
There are also significant discrepancies between the model and the observations. (i) The model predicts that SO peaks deep in the cold material (at 8 mpc), following the distribution of HCN, not at the location where H2CO peaks (in front of CO) as is observed. (ii) Conversely, the H2CO peak in both slices is observed closer to the peaks of the CO isotopes than to the C2H peak, while the model predicts H2CO to peak significantly closer to C2H. (iii) For HCN the model peaks 5–9 mpc deeper than is observed and (iv) the observations show an HCN emission wing toward the PDR surface which is weaker in the model. (v) We find that the absolute abundance of H2CO and the lower limit to the absolute abundance of HCN at the model peak are consistent with the observations, while the model abundance of C2H is 2 times smaller than observed. (vi) In addition, our modeled SO abundance is orders of magnitude larger than the observed value.
The underestimate of the C2H abundance predicted by our pure gas-phase model might be explained by C2H being formed via photo-destruction of PAH molecules, as proposed by Pety et al. (2005). This explains a detectable C2H abundance in the outer layers where the PAH emission peaks (Van der Werf et al. 1996).
Our modeled SO abundance is a factor 1.4104 larger than observed. This is explained by the too high gas phase sulfur abundance of 2.810-5 used in the KOSMA- model, which represents diffuse clouds and no depletion (Federman et al. 1993). Recent estimates of cosmic sulfur abundance provide values as low as 1.410-5 (Asplund et al. 2005) and sulfur depletion factors in dense clouds may range from 4 (Goicoechea et al. 2006) to 1000 (Tieftrunk et al. 1994). Depletion factors of several would be required to match the Orion Bar observations with the current model. The low depletion seems not to apply to the entire Orion region, but to be specific for the Horsehead, which has a particularly low density.
The abundance of H2CO derived in the LTE limit is slightly higher than the modeled abundance; the discrepancy increases sharply as soon as the H2CO gas is not completely in LTE. This abundance discrepancy might be explained by the evaporation of molecules from warm (30 K) dust grains. Based on reaction rates from Woodall et al. (2007), the photo-dissociation lifetime for H2CO at mag is only 10 yr, which introduces the need for a continuous supply of H2CO, e.g., from grain surfaces (Herbst 2000). This is consistent with the suggestion by Leurini et al. (2006) that H2CO may originate primarily from the warm interclump medium.
Finally, the observed broad spatial profiles for HCN and 13CO (Fig. 2) may be explained by optical depth effects, since the optical depth inferred by RADEX is 5–10 for these molecules and 1 for the others. The different spatial distributions of the two CO isotopologs result mainly from the different beam sizes.
Future observations will test our hypothesis that grain surface chemistry plays a key role in PDRs. One such test will be JCMT-SLS observations of CH3OH in the Orion Bar: while Leurini et al. (2006) suggest that CH3OH traces the clumps and H2CO traces the interclump medium, both molecules are thought to be the products of CO hydrogenation on ice (Watanabe et al. 2004), so their spatial coincidence would mark a critical validation step. Other analysis will explore sulfur chemistry using sulfur-bearing species covered by the SLS, such as CS and SO2. Once completed, the SLS data set will enable studies of multiple transitions of various molecules, so that the excitation of molecules (as well as their velocity structure) can also be compared to models. In the longer term, (sub)millimeter-wave imaging spectroscopy of other Galactic PDRs is needed to establish how common grain chemistry is and how it depends on environment. Important tests will be spectral surveys with the HIFI instrument on board ESA’s Herschel Space Observatory, which will target hundreds of molecular lines in many Galactic PDRs and allow a detailed picture of their chemistry to emerge.
Acknowledgements.
The authors acknowledge the JCMT staff for their support, Markus Röllig for help with the PDR model, and Peter Schilke, Maryvonne Gerin, and an anonymous referee for their careful reading of the manuscript.References
- Asplund et al. (2005) Asplund, M., Grevesse, N., & Sauval, A. J. 2005, in ASP-CS, Vol. 336, Cosmic Abundances as Records of Stellar Evolution and Nucleosynthesis, ed. T. G. Barnes, III & F. N. Bash, 25–+
- Batrla & Wilson (2003) Batrla, W. & Wilson, T. L. 2003, A&A, 408, 231
- Cubick et al. (2008) Cubick, M., Stutzki, J., Ossenkopf, V., Kramer, C., & Röllig, M. 2008, A&A, 488, 623
- Federman et al. (1993) Federman, S. R., Sheffer, Y., Lambert, D. L., & Gilliland, R. L. 1993, ApJ, 413, L51
- Goicoechea et al. (2006) Goicoechea, J. R., Pety, J., Gerin, M., et al. 2006, A&A, 456, 565
- Herbst (2000) Herbst, E. 2000, in IAU Symposium, Vol. 197, From Molecular Clouds to Planetary, ed. Y. C. Minh & E. F. van Dishoeck, 147–+
- Hogerheijde et al. (1995) Hogerheijde, M. R., Jansen, D. J., & Van Dishoeck, E. F. 1995, A&A, 294, 792
- Hollenbach & Tielens (1999) Hollenbach, D. J. & Tielens, A. G. G. M. 1999, Reviews of Modern Physics, 71, 173
- Jansen et al. (1995) Jansen, D. J., Spaans, M., Hogerheijde, M. R., & Van Dishoeck, E. F. 1995, A&A, 303, 541
- Johnstone et al. (2003) Johnstone, D., Boonman, A. M. S., & van Dishoeck, E. F. 2003, A&A, 412, 157
- Kaufman et al. (1999) Kaufman, M. J., Wolfire, M. G., Hollenbach, D. J., & Luhman, M. L. 1999, ApJ, 527, 795
- Leurini et al. (2006) Leurini, S., Rolffs, R., Thorwirth, S., et al. 2006, A&A, 454, L47
- Lis & Schilke (2003) Lis, D. C. & Schilke, P. 2003, ApJ, 597, L145
- Meijerink & Spaans (2005) Meijerink, R. & Spaans, M. 2005, A&A, 436, 397
- Menten et al. (2007) Menten, K. M., Reid, M. J., Forbrich, J., & Brunthaler, A. 2007, A&A, 474, 515
- Ossenkopf et al. (2007) Ossenkopf, V., Röllig, M., Cubick, M., & Stutzki, J. 2007, in Molecules in Space and Laboratory, by J.L. Lemaire & F. Combes (eds.), S. Diana publ., p.95
- Pety et al. (2005) Pety, J., Teyssier, D., Fossé, D., et al. 2005, A&A, 435, 885
- Plume et al. (2007) Plume, R., Fuller, G. A., Helmich, F., et al. 2007, PASP, 119, 102
- Röllig et al. (2007) Röllig, M., Abel, N. P., Bell, T., et al. 2007, A&A, 467, 187
- Röllig et al. (2006) Röllig, M., Ossenkopf, V., Jeyakumar, S., Stutzki, J., & Sternberg, A. 2006, A&A, 451, 917
- Simon et al. (1997) Simon, R., Stutzki, J., Sternberg, A., & Winnewisser, G. 1997, A&A, 327, L9
- Sternberg & Dalgarno (1995) Sternberg, A. & Dalgarno, A. 1995, ApJS, 99, 565
- Tauber et al. (1994) Tauber, J. A., Tielens, A. G. G. M., Meixner, M., & Goldsmith, P. F. 1994, ApJ, 422, 136
- Tieftrunk et al. (1994) Tieftrunk, A., Pineau des Forets, G., Schilke, P., & Walmsley, C. M. 1994, A&A, 289, 579
- Tielens et al. (1993) Tielens, A. G. G. M., Meixner, M. M., Van der Werf, P. P., et al. 1993, Science, 262, 86
- Van der Tak et al. (2007) Van der Tak, F. F. S., Black, J. H., Schöier, F. L., Jansen, D. J., & Van Dishoeck, E. F. 2007, A&A, 468, 627
- Van der Werf et al. (1996) Van der Werf, P. P., Stutzki, J., Sternberg, A., & Krabbe, A. 1996, A&A, 313, 633
- Walmsley et al. (2000) Walmsley, C. M., Natta, A., Oliva, E., & Testi, L. 2000, A&A, 364, 301
- Watanabe et al. (2004) Watanabe, N., Nagaoka, A., Shiraki, T., & Kouchi, A. 2004, ApJ, 616, 638
- Wilson & Rood (1994) Wilson, T. L. & Rood, R. 1994, ARA&A, 32, 191
- Woodall et al. (2007) Woodall, J., Agúndez, M., Markwick-Kemper, A. J., & Millar, T. J. 2007, A&A, 466, 1197
- Young Owl et al. (2000) Young Owl, R. C., Meixner, M. M., Wolfire, M., Tielens, A. G. G. M., & Tauber, J. 2000, ApJ, 540, 886