Time-evolution of the ion velocity distribution function in the discharge of a Hall effect thruster
Abstract
The temporal characteristics of the Xe+ ion axial Velocity Distribution Function (VDF) were recorded in the course of low-frequency discharge current oscillations ( 14 kHz) of the 5 kW-class PPSX000 Hall thruster. The evolution in time of the ion axial velocity component is monitored by means of a laser induced fluorescence diagnostic tool with a time resolution of 100 ns. As the number of fluorescence photons is very low during such a short time period, a hom-made pulse-counting lock-in system was used to perform real-time discrimination between background photons and fluorescence photons. The evolution in time of the ion VDF was observed at three locations along the thruster channel axis after a fast shut down of the thruster power. The anode discharge current is switched off at 2 kHz during 5 s without any synchronization with the current oscillation cycle. This approach allows to examine the temporal behavior of the ion VDF during decay and ignition of the discharge as well as during forced and natural plasma oscillations. Measurements show that the distribution function of the axial component of the Xe+ ion does change periodically in time with a frequency close to the current oscillation frequency in both forced and natural cases. The ion density and the mean velocity are found to oscillate whereas the velocity dispersion stays constant, which indicates that ionization and acceleration layers have identical dynamics. Finally, variations over time of the electric field are for the first time experimentally evidenced in a crossed-field discharge.
† ICARE, CNRS, 1C avenue de la Recherche Scientifique, 45071 Orléans, France.
‡ LSP, Joseph Fourier University - CNRS, 140 Av.
de la Physique, 38402 St Martin d’Hères, France.
Submitted to Physics of Plasmas
1 Introduction
A Hall Effect Thruster (HET) is a gridless ion accelerator that finds applications in the field of spacecraft propulsion [1, 2]. Such a type of electric propulsive device is especially suited for long duration missions and for maneuvers that require a large velocity increment. HETs are at present mostly employed for geostationary communication satellite orbit correction and station keeping. Other fields of application are envisaged for the near future. Low power Hall thrusters seem suited for drag compensation of observation satellites that operate on a low-altitude Earth orbit. The use of high power Hall thrusters for orbit raising and orbit topping maneuvers of communication satellites would offer significant benefits in terms of launch mass, payload mass and operational life. In addition, large Hall thrusters appear as good candidates to be used as the primary propulsion engine for robotic space probes during interplanetary journeys towards far-off planets and asteroids.
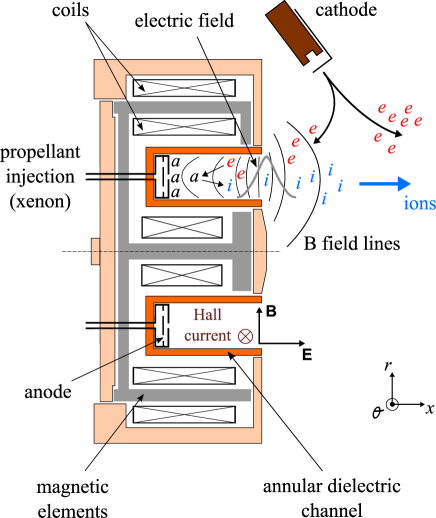
A Hall effect thruster is a low-pressure DC discharge in crossed electric and magnetic fields configuration [2, 3, 4]. Xenon is generally used as a propellant gas due to its high atomic mass and low ionization energy. A schematic of a HET is depicted in Fig. 1. The anode is located at the upstream end of a coaxial annular dielectric channel that confines the plasma. The cathode is situated outside. A set of coils combined with magnetic parts provide a radially directed magnetic field B of which the strength is maximum in the vicinity of the channel exhaust. The magnetic field is chosen strong enough to make the electron Larmor radius much smaller than the channel characteristic sizes, but weak enough not to affect ion trajectories. The gas injected through the anode is ionized inside the channel by electron impacts. As the magnetic field considerably slows down the electron motion towards the anode, the applied potential concentrates in a restricted area at the channel entrance. The corresponding axial electric field E then accelerates ions out of the channel, which generates thrust. The ion beam is neutralized by a fraction of electrons emitted from the cathode. The crossed E and B geometry is at the origin of a large electron azimuthal drift – the Hall current – that is responsible for the efficient ionization of the supplied gas. When operating near 1.5 kW, a HET ejects ions at 20 km s-1 and generates 100 mN of thrust with an overall efficiency of about 50 % [5].
It is well-established that the crossed-fields discharge of a Hall effect thruster is strongly non-stationary [3, 6]. This specific type of magnetized plasma displays numerous types of oscillations, which encompass many kinds of physical phenomena, each with its own length and time scales [6]. Current and plasma fluctuations, of which the frequency range stretches from 10 kHz up to 100 MHz, play a major role in ionization, particle diffusion and acceleration processes. Low-frequency plasma oscillations in the range 10-30 kHz, so-called breathing oscillations, are especially of interest as they carry a large part of the power [7]. Breathing oscillations find their origin in a prey-predator type mechanism between atoms and ions as shown by Boeuf and co-workers [8]. In short, these oscillations originate in a periodic depletion and replenishment of the neutrals near the exhaust of the thruster channel due to the efficient ionization of the gas. The frequency is then linked to the time it takes for atoms to fill in the ionization region. With an atom thermal speed of 300 m/s and a region size of 20 mm, one finds a frequency of 15 kHz. The breathing phenomenon not only disturbs the discharge current but also has a strong impact on several quantities. The plume shape and the ion beam divergence change during an oscillation cycle of the current as was shown by means of CCD imaging [9]. A time variation of the ion beam energy in a Hall thruster far field was evidenced using a retarding potential analyzer [11]. The electron density and the plasma potential oscillate at low frequency [10]. Conversely, the electron temperature stays unchanged. Oscillations of the aforementioned quantities are most likely connected with a time variation of the potential distribution or, in other words, with the variation with time of the accelerating electric field. Therefore, it appears of great interest to investigate the temporal behavior of the electric field that certainly hides a rich and intricate dynamics. Across the acceleration layer, the medium is collisionless, i.e. ion-ion and ion-atom collision events are scarce. As a consequence, the electric field can be directly inferred from the Xe+ velocity which then becomes the quantity to be examined.
Laser Induced Fluorescence (LIF) spectroscopy in the near infrared has often been used in the past few years to measure the time-averaged velocity distribution function (VDF) of Xe+ ions in the plasma of a Hall effect thruster [12, 13, 14, 15]. LIF spectroscopy is a non intrusive diagnostic tool that enables an accurate determination of the local velocity of atoms along the laser beam direction by measuring the Doppler shift of absorbed photons. The metastable Xe+ ion VDF is recorded by collecting fluorescence radiation at 541.9 nm after excitation of the 5d 2F 6p 2D transition at = 834.7233 nm [14]. A phase sensitive detection method is often used to capture the fluorescence signal. However, this method, which is powerful enough for the extraction of a signal in an environment with a high background noise level, offers a poor time resolution. To achieve the measurement of the time-resolved Xe+ ion VDF in the plasma of a Hall effect thruster, it is necessary to develop a bench able to detect LIF photons with a time resolution around 1 s. In normal operating conditions for a HET, the number of fluorescence photons observed at 541.9 nm with a continuous laser beam tuned at 834.7233 nm with about 1 mW/mm2 power density is on the order of 10-2 per s. Under identical experimental conditions, the number of background photons generated by the plasma at 541.9 nm during 1 s is typically 1, which means a ratio of 100 between the two signal amplitudes. The laser system must therefore be able (i) to detect a tiny amount of photons hidden in a strong background (ii) to determine with a high accuracy the exact moment in time fluorescence photons have been produced. One must therefore turn to a photon-counting technique.
In this contribution, we present time-resolved measurements of the Xe+ ion axial VDF in the discharge of the 5 kW-class PPSX000 Hall thruster fired at 500 V discharge voltage and 6 mg/s xenon mass flow rate. The evolution in time of the VDF was recorded at several locations during the transient regime that follows a fast anode discharge current ignition in order to investigate the ion dynamics during forced and free low frequency current oscillations. The current is switched off during 5 s at a 2 kHz repetition rate without any synchronization with the discharge current oscillation cycle. The outline of this paper is as follows. In Sec. 2, the LIF optical assembly is described and the pulse-counting technique is introduced. Section 3 shows contour plots of the time-varying Xe+ ion VDF as well as traces of various velocity groups at the thruster outlet. In Sec.4, the temporal behavior of macroscopic quantities like the density, the mean velocity and the velocity dispersion, is examined and discussed. Section 5 reports on variation over time of the accelerating electric field in the crossed-field discharge of a Hall thruster. Finally, concluding remarks will be presented in Sec. 6.
2 Diagnostic technique
2.1 Optical bench and collection branch
The LIF optical assembly is extensively described in Ref. [15]. The laser beam used to excite Xe+ metastable ions at 834.7 nm is produced by an amplified tunable single-mode external cavity laser diode. The wavelength is accurately measured by means of a calibrated wavemeter whose absolute accuracy is better than 100 MHz, which corresponds to 90 m/s. A plane scanning Fabry-P rot interferometer with a 1.29 GHz free spectral range is used to real-time check the quality of the laser mode and to detect mode hops. The primary laser beam is modulated by a mechanical chopper at a low frequency 20 Hz before being coupled into a 50 m long optical fiber of 50 m core diameter. The fiber output is located behind the thruster. Collimation optics are used to form a narrow beam that passes through a small hole located at the back of the PPS®X000 thruster. The laser beam propagates along the channel axis in the direction of the ion flow. Typically, the laser power density reaches 3 mW/mm2, which warrants a weak saturation effect on the studied transition.
A collection branch made of a 40 mm focal length lens, which focuses the fluorescence light onto a 200 m core diameter optical fiber, is mounted onto a travel stage perpendicular to the channel axis. The magnification ratio is 1, meaning that the spatial resolution is 200 m in axial direction. A 16 mm long slit was made in the channel dielectric outer wall in order to carry out measurements inside the channel. The fluorescence light transported by the 200 m fiber is focused onto the entrance slit of a 20 cm focal length monochromator that isolates the 541.9 nm line from the rest of the spectrum. A photomultiplier tube serves as a light detector.
2.2 Lock-in photon-counting device
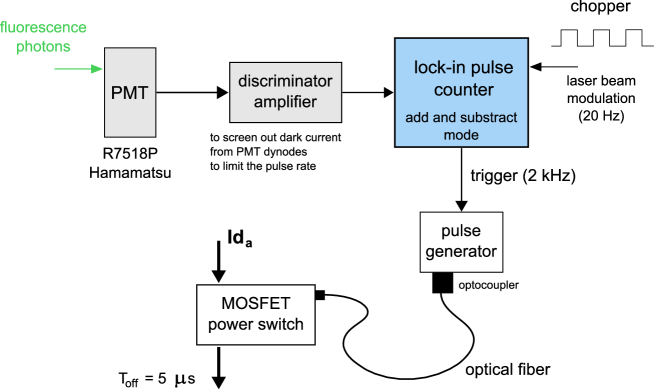
The pulse (or photon) counting technique allows the detection of a very low level signal with an excellent time resolution. When combined with a modulation of the laser light intensity, the pulse counting technique can distinguish between LIF photons and spontaneous emission photons. The technique is known as the time-resolved pulse counting lock-in detection technique. In this work, a customized pulse-counting system is used to measure time-dependent ion VDF [16]. Here we briefly outline the main characteristics and settings of the system.
A block diagram of the pulse counting system is shown in
Fig. 2. Photons are detected by means of a high gain
and low dark noise PMT (R7518-P from Hamamatsu). A fast amplifier
and discriminator module (9302 from Ortec - 100 MHz counting rate)
is used to screen out dark current from PMT dynodes, to limit the
pulse rate thereby avoiding saturation of the pulse counter, and to
transform any single event – here the arrival of a photon – into
either a NIM or a TTL pulse. Pulses are subsequently treated by the
lock-in pulse counter device, which counts events as a function of
time. A trigger starts the counter which segments photon count data
into sequential time bins. Notice that up to 32 kbins are available.
The width of the bins can be set from 10 ns to 655 s. The
instrument records the number of photons that arrive in each bin. In
order to greatly improve the signal-to-noise ratio, the counter is
able to operate in real-time addition-subtraction mode. The laser
beam intensity is modulated at low frequency ( 20 Hz) by
means of a mechanical chopper. Each pulse recorded when the laser is
propagating through the plasma (laser-on mode) is added to the time
series; the signal corresponds to LIF photons plus background
photons. Each pulse recorded when the laser is suspended (laser-off
mode) is subtracted from the time series: in that case the signal is
solely composed of background photons. A 2 kHz trigger signal
generated by the counter itself was used to define the start of the
measurement cycle. The time resolution, i.e. the width of each bin,
was set to 100 ns and 5000 bins were used. The duration of one
measurement cycle is therefore 500 s, corresponding to about 6
times the period of low-frequency current oscillations of the
PPSX000 thruster operating at 500 V and 6 mg/s. In
order to obtain a reasonable
signal-to-noise ratio, light was accumulated over 1 million cycles.
The procedure to obtain the time-resolved ion VDF is the
following:
-
•
the laser is fixed at a given wavelength corresponding to a certain ion velocity group . The extent (dispersion) of the velocity group results from the spectral width of the laser beam and from the thermal expansion of the laser cavity. A feedback loop allows a minimization of the shift of the laser wavelength. The dispersion is thus around 10 m/s.
-
•
The pulse counter is used to record the number of fluorescence photons induced by excitation of metastable ions at . That means we follow the temporal evolution of the velocity group .
-
•
After about one million discharge current disconnection cycles the laser wavelength is changed and a new measurement starts.
To obtain a smooth ion VDF about 15 to 20 different wavelengths are used.
3 Temporal characteristics of the ion VDF
3.1 Experimental conditions - Ion emission light
All measurements were performed in the PIVOINE-2g test-bench. The PPSX000 Hall effect thruster was equipped with BN-SiO2 channel walls and with a carbon anode. All thruster parameters were kept unchanged during the experiments: The applied voltage was set to 500 V, the anode xenon mass flow rate was fixed at 6 mg/s and the magnetic field strength was 150 G. The mean discharge current is 5.4 A and the oscillation frequency is found to be 13.7 kHz. The temporal characteristics of the ion VDF were recorded for three locations along the channel centerline. Each position defines a distinct area in terms of electric field magnitude [15]. The position = -15 mm corresponds to a zone through which the electric field is almost zero and the ionization is strong. At = -2.5 mm, the electric field is large and ionization is maintained. The channel exit plane, = 0 mm, corresponds to a region where ionization ceases and the electric field strength is high with 300 V/cm.
In this study, the ion flow dynamics was investigated before and after a fast shut-down of the anode discharge current. It was therefore possible to examine the temporal characteristics of the ion VDF during plasma breakdown and ignition as well as during forced and free current oscillations. The anode current is switched off during 5 s at 2 kHz by way of an optically controlled fast power switch based on a MOSFET [9]. The power switch is directly driven by the counter, as shown in Fig. 2. There is no synchronization between the power cut cycle and the discharge current waveform. In other words, the anode current is switched off randomly at any time with respect to the discharge current natural oscillations.
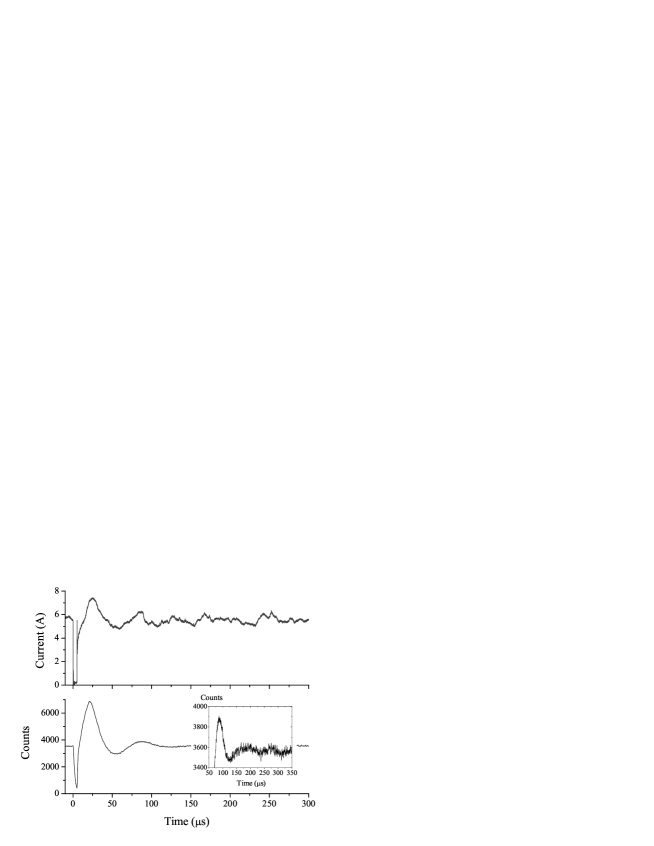
Figure 3 displays the intensity of the 541.9 nm ion line as a function of time observed at = -2.5 mm recorded with the photon-counting device operating in addition mode only. A snapshot of the anode current waveform is also shown. Measurement reveals the time evolution of natural plasma emission. The power is always switched off at = 0 s (reference time). The plasma decays with a 1/ time of 2.1 s. However, it does not fully vanish as charged-particle recombination and diffusion processes timescales are not infinitely shorter compared to the 5 s current-off time period. On the contrary, both the anode current and the Hall current cancel in a few hundreds of ns [17]. This point is specifically addressed in the next sections. A large amount of light is quickly produced at the re-ignition stage, as can be seen in Fig. 3. In like manner, a discharge current burst always occurs at re-ignition [9, 17]. This forced plasma oscillation originates in the sudden ionization of the great amount of propellant atoms accumulated inside the channel when the discharge is off. The plasma oscillates with a mean period of about 83 s that corresponds to a 12 kHz frequency. As can be observed in Fig. 3, the amplitude of light oscillations diminishes with time, and the signal finally approaches a constant level. This phenomenon is due to the fact that, the current disconnection cycle is not synchronized with the natural current oscillations, while data acquisition is a cumulative process over thousand of cycles.
3.2 Contour map
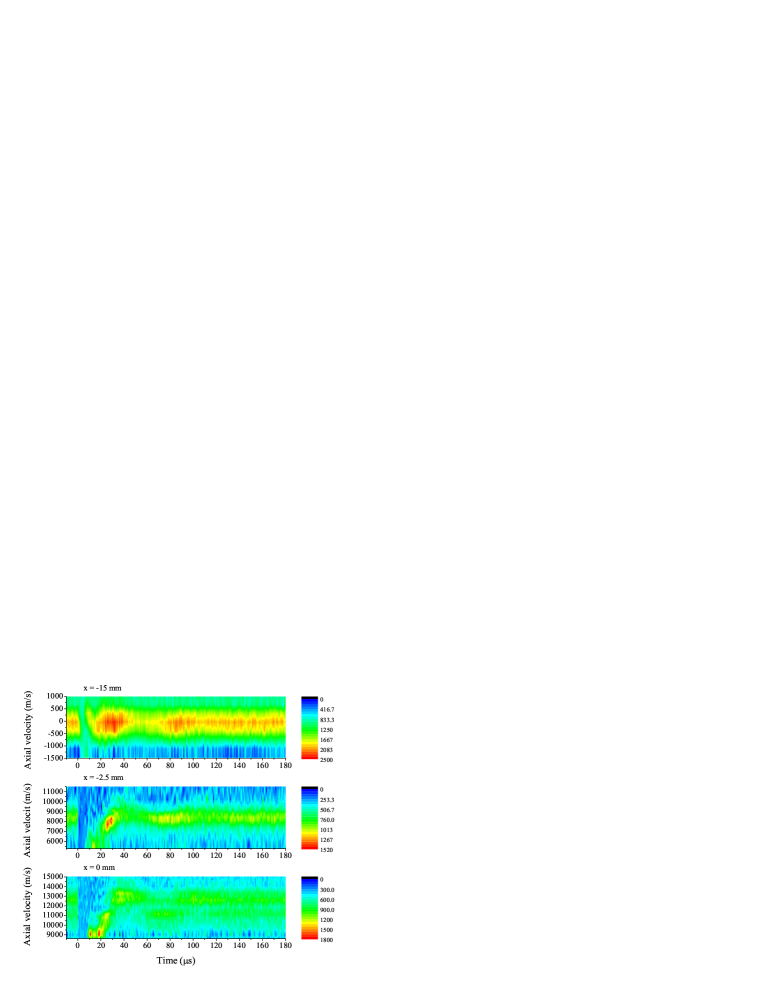
Figure 4 shows contour plots of the time evolution of the Xe+ ion velocity distribution functions for three positions along the thruster channel axis, respectively = -15 mm, = -2.5 mm, and = 0 mm. All velocity groups vanish quickly after the current is switched off on a time scale on the order of a few 100 ns. This property indicates the electric field cancels almost instantaneously when the current is stopped. As a consequence, the discharge current as well as the Hall current disappear over an extremely short time period, as experimentally observed [17]. Yet, very slow ions do not fully disappear in 5 s as recombination, ambipolar diffusion to walls and drift out of the acceleration zone are slow processes. In Fig. 4, the fluorescence signal is significantly above zero after 5 s for = -15 mm. The remark holds also true for the ion emission signal, see Fig. 3. Note that a Xe+ ion travels 1.5 mm in 5 s at the thermal speed 300 m/s. Very slow ions, i.e ions with the atom speed, are always produced first at re-ignition as electrostatic acceleration is not an instantaneous process. In Fig. 4, slowest ions are indeed observed first and the mean velocity gradually increases up to a limit. Ions moving with a velocity close to the thermal speed are not visible in Fig. 4 for = -2.5 mm and = 0 mm as the ion VDF is truncated due to a lack of data points. The large production of ions at plasma ignition originates from the fact that the channel is entirely filled up with xenon atoms, as previously explained. As can be seen in Fig. 4, the Xe+ ion VDF in axial direction changes in time, especially during the first two plasma oscillations. This phenomenon indicates that the acceleration potential, and thus the electric field, is likely to vary in time with a frequency on the order of the main discharge current oscillation frequency.
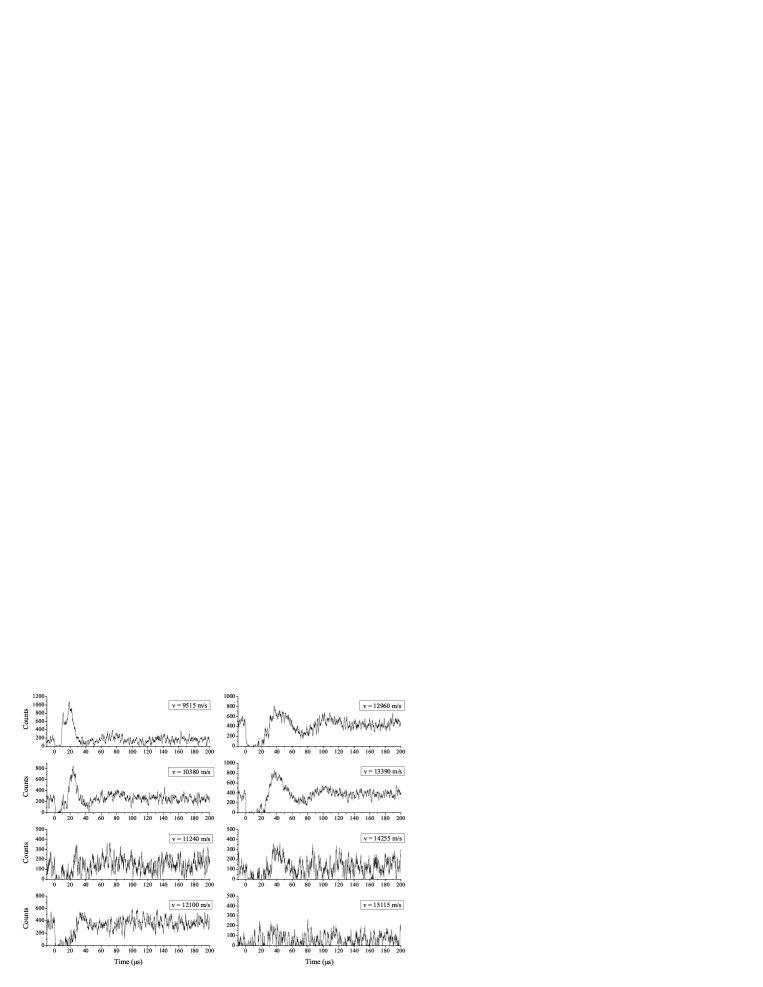
3.3 Velocity groups
Examination of the temporal characteristics of the ion VDFs provides a general outline of the ion dynamics in the discharge of a Hall thruster. In contrast, a critical analysis of the temporal behavior of ion velocity groups reveals in great detail the intricate character of the physics at work. The time evolution at the channel outlet of eight well-identified ionic velocity groups is shown in Fig. 5. The temporal evolution is monitored at the thruster channel exhaust. Graphs correspond to horizontal cross-sections of the lower contour plots in Fig. 4. All velocity groups quickly vanish as soon as the power is switched-off: the mean 1/ decay time for all is 1.5 s. The discharge current as well as the Hall current decay in about the same time period [17]. Nonetheless, fastest ions disappear out of the acceleration region first: the 1/ decay time is 1.1 s at 12960 m/s. On the contrary, slowest ions are produced first when the discharge current is re-ignited. In Fig. 5, the group = 9515 m/s is detected at 9 s and it reaches its highest amplitude at 19 s whereas the group = 13390 m/s is detected at 20 s and it goes through a maximum at 39 s. All velocity families oscillate nonetheless with the same period of time 73 s, that means with a frequency around 14 kHz.
When the power is turned on again, ionization immediately takes place, see Fig. 3. Discharge and Hall current are restored in less than 1 s and ions are gradually accelerated as shown in Fig. 5. All these facts indicate that the electric field is established on a microsecond timescale at re-ignition. However, it seems at first sight in manifest contradiction with the time it takes to detect fast ions inside the thruster channel. The time of flight of a given ion velocity group across the acceleration layer after plasma re-ignition can be assessed by numerically solving the particle motion equation in an external electric field :
| (1) |
where is the elementary charge and is the mass of a xenon ion. For simplicity’s sake, the electric field is first set constant in space and in time through the whole acceleration region (from = -10 mm to 20 mm) with a magnitude of 170 V/cm [15]. Moreover, the field is assumed to be instantaneously created and the ionization process is stationary and homogeneous. The initial velocity is fixed as the thermal speed . Computations reveal that the group = 13390 m/s appears at the exit plane at = 1.05 s. Ions have then travelled 7.2 mm, a distance compatible with the acceleration layer size 30 mm. However, this velocity group is observed first at s, see Fig. 5. Another approach consists of taking a steady electric field distribution similar to the measured one [15]. When ions are created about 19 mm inside the channel, computations indicate that the group = 13390 m/s is indeed observed at = 0 mm for s. Yet ions moving at 9515 m/s are solely seen a few hundreds of ns earlier, in contradiction with experimental outcomes.
One way to better duplicate reality consists for instance of
considering that the ionization profile or the electric field can
evolve in the course of time.
With a stationary electric field profile similar to the measured
one [15], numerical simulations using Eq. 1 show
that ions must be created first in the vicinity of the channel
outlet and the ionization front must move towards the anode with a
speed on the order of 500 m/s to reproduce trends that are
experimentally observed in Fig. 5. Propagation of an
ionization wave through the acceleration layer was proposed to
explain experimental results acquired by means of time-resolved
optical emission spectroscopy with a fiber comb [11] as well
as CCD images of the plume behavior with
a speed around 1-2 km/s.
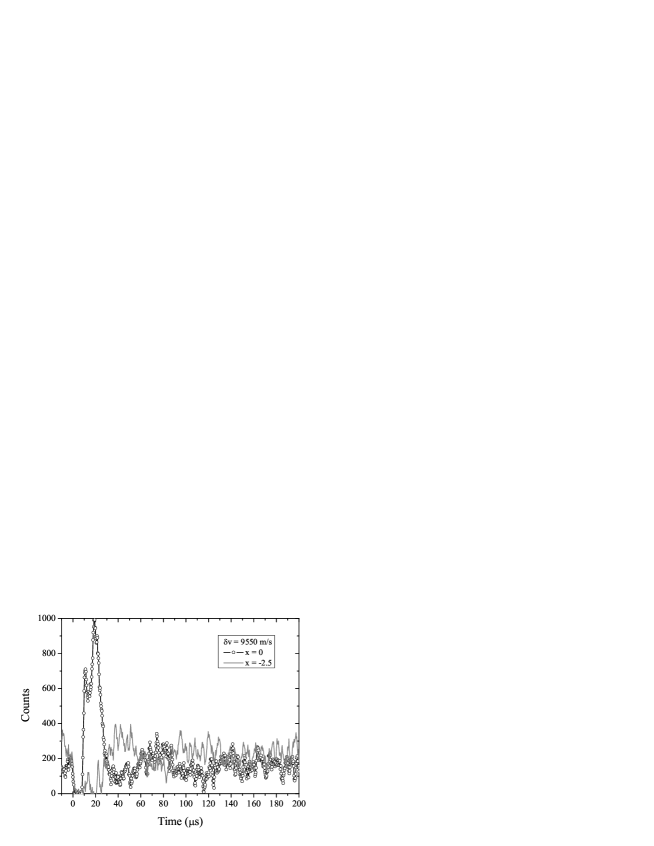
Figure 6 shows the time evolution of the
velocity group = 9550 m/s for two locations,
respectively = -2.5 mm and = 0 mm. The ion family is first
observed at the channel exit plane at s before being
detected inside the channel at s. The highest
amplitude is attained for s and s at
= 0 mm and = -2.5 mm, respectively. Results indicate that
ions are created within a broad region inside the channel: ions
created close to the exit plane are indeed detected first.
Nevertheless, experimental outcomes cannot be correctly simulated
when assuming that an ionization wave travels from the plume near
field towards the anode while the electric field distribution stays
unchanged. On the contrary, results suggest that the ionization
front as well as the acceleration layer change in time together.
Numerical simulations, though basic, and experimental data are
therefore in favor of complex plasma dynamics within the discharge
of a Hall thruster. It is worth noticing that the behavior of Xe+
ion velocity groups during a forced oscillation that follows a
power-off period may not directly image the normal behavior during a
natural plasma oscillation from the viewpoint of amplitude of the
observed phenomena.
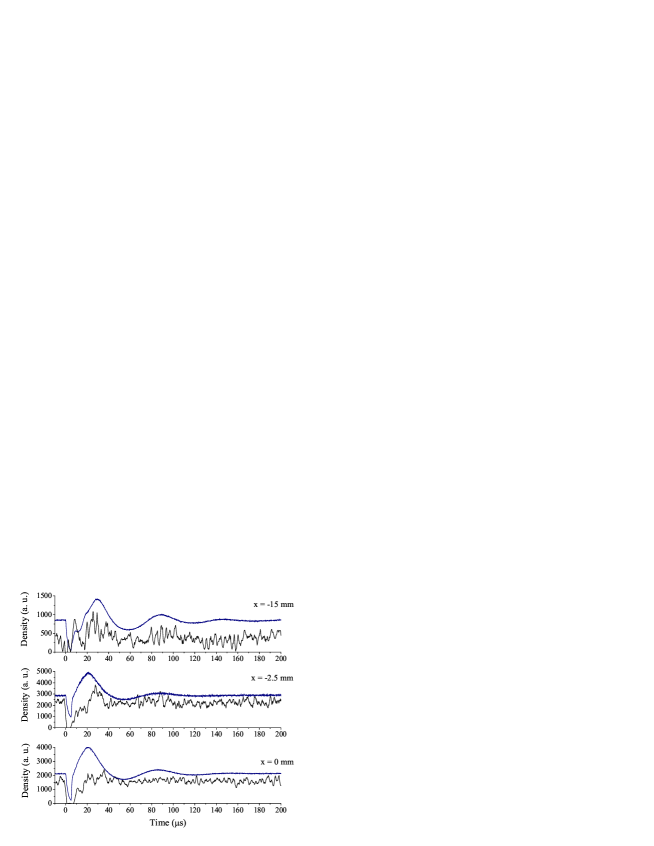
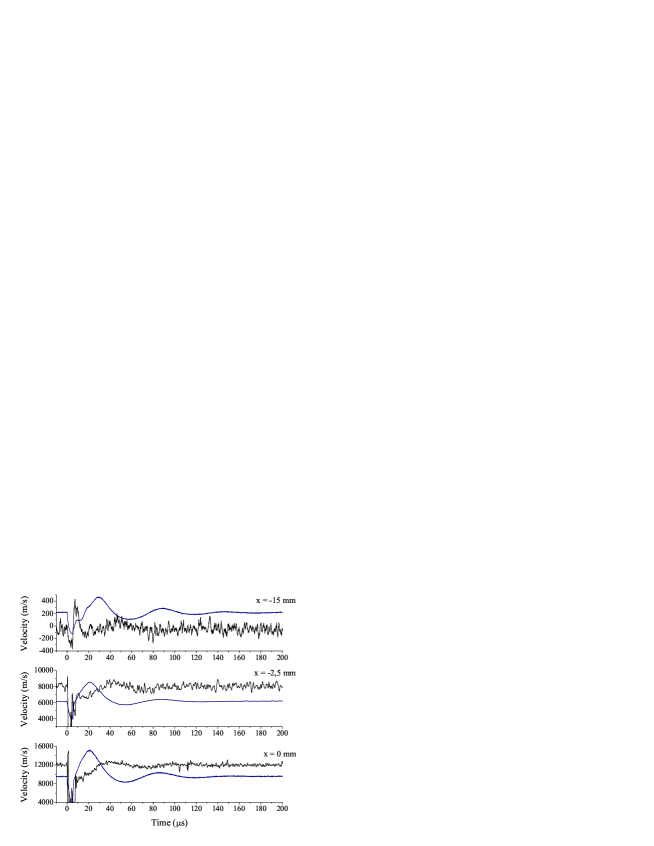
4 Evolution in time of the density, mean velocity and dispersion
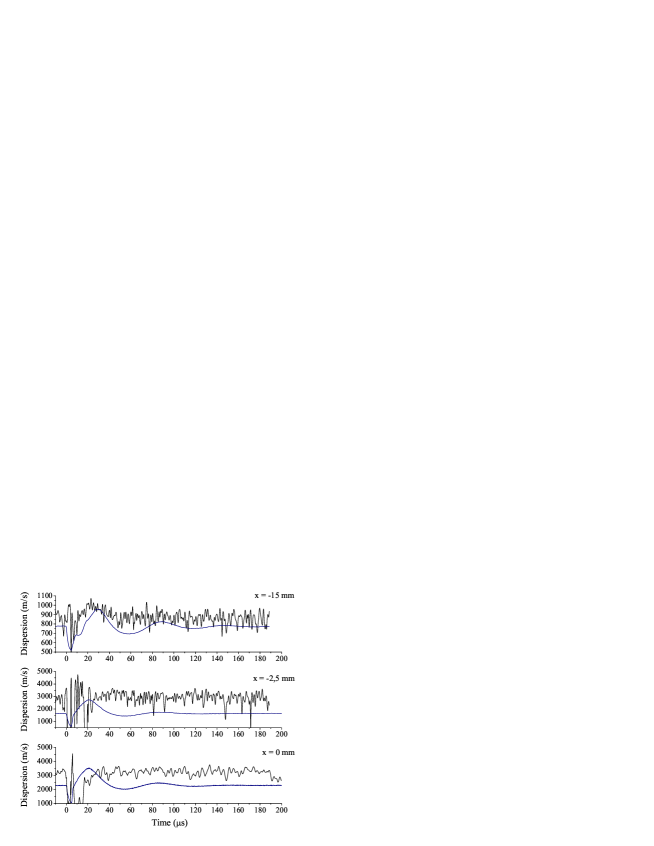
The time evolution of various averaged quantities is plotted in Fig. 7, 8 and 9 for three positions along the channel axis, respectively mm, mm and mm. The relative metastable Xe+ ion density is given by the area of the VDF. The mean velocity and the velocity dispersion are computed from, respectively, the first and the second order moments of the velocity distribution. The velocity spread is in fact expressed in terms of parameter [14, 15]. The latter reads:
| (2) |
where is the standard deviation. The quantity is equal to the FWHM in the case of a Gaussian profile.
As can be seen in Fig. 7, the ion density is oscillating in time with a frequency of about 16 kHz whatever the position. Changes in the ion density are connected with temporal characteristics of the ionization rate. The latter is driven by a prey-predator kind of process between atoms and charged particles [6, 18, 19]. Besides, Langmuir probe measurements have shown that the electron density periodically varies in time with the discharge current oscillation frequency [10]. The fact that in Fig. 7, the first maximum of the ion density waveform is shifted in time with respect to the first maximum of the 541.9 nm line intensity profile for mm and mm is an experimental artefact due to the truncation of the measured VDF.
The time evolution of the mean velocity is shown in Fig. 8. At = -15 mm, the velocity slightly oscillates around zero as the observation point is outside the acceleration layer. At mm and mm, the mean velocity oscillates around a constant value, which corresponds with a reasonably good agreement to the value obtained by means of time-averaged LIF spectroscopy at the same location [15]. The small difference is due to the power-switch disturbance. As shown in Fig. 8, the velocity changes in time are however small. In terms of kinetic energy the largest gap is 10 eV at -2.5 mm, respectively 25 eV at the channel exit plane. Energy variation of a few tens of eV during a low-frequency current oscillation cycle was recorded in the plume far-field of a SPT100-ML Hall thruster using a repulsing potential analyzer [11]. Hybrid fluid/kinetic models also predict low-amplitude periodical variation of the ion velocity [18, 19] with a strong correlation between discharge current and ion velocity temporal behavior. The observed oscillations of the mean ion axial velocity can solely be explained by a back and forth motion of the ionization and acceleration layers and/or a change in the electric field magnitude, as already suggested by the analysis of ion velocity groups characteristics as a function of time.
As can be seen in Fig. 9, the velocity dispersion does not vary much in time other than at current shut off and restart. At the thruster channel exhaust, the velocity dispersion ( parameter) is almost constant with a value of 2950 m/s. In terms of energy spread it is 47 eV. In previous investigations [14, 15], it was clearly demonstrated that in a Hall thruster environment the velocity dispersion originates mostly in the spatial overlap between the ionization and the acceleration layers. As the velocity dispersion stays unchanged with time whereas the ion density and velocity do vary, one can conclude the ionization front and the electric field distribution have a correlated dynamics. For instance, assuming the form of the two profiles stay unchanged, the two layers would have to move along at once together in the axial direction. Actually, computer simulations indicate that both the shape and the location of the ionization and electric field profiles change with time [18].
5 Low-frequency electric field oscillations
The oscillation in time of the accelerating electric field can be assessed from the time-dependent profile of the Xe+ ion mean velocity , see Fig. 8, assuming a collisionless medium. The electric field is computed according to the formula:
| (3) |
where is the position and refers to the distance. The time-dependent electric field is plotted in Fig. 10 for the area that ranges between -2.5 mm and the exit plane. The electric field is found to oscillate with a period s, i.e. kHz, around a mean value of about 215 V/cm disregarding the power-off period. This value is close to the value of 245 V/cm found by way of time-averaged laser spectroscopy [15]. The amplitude of the field oscillations is, however, relatively weak. Over the first free oscillation that extends from s until s the amplitude varies at most from 190 V/cm to 240 V/cm, therefore, the electric field variation is in the range 10 % ahead of the thruster channel exhaust. Finally, in Fig. 10, one can also notice the slow rise of the electric field magnitude from 100 V/cm at 10 s to 250 V/cm at 30 s. This temporal evolution is likely to be connected with the time it takes for the establishment of an equilibrium state for both the discharge and the Hall currents.
6 Conclusions
The examination of the temporal characteristics of the Xe+ ion velocity distribution function in the magnetized discharge of a Hall effect thruster reveal the complex dynamics of the ionization and the acceleration processes. Three results are especially of great interest. First, the ionization profile and the electric field distribution are unstationary. Second, the ionization and acceleration layers vary in time in such a way that their spatial overlap stays almost unchanged as the ion velocity spread does not change much after ignition. Third, the amplitude of the low-frequency electric field oscillations ahead of the channel exit plane is weak.
Even though this study has brought new facts about the physics of a Hall effect thruster, it appears necessary to carry on this type of experiments aiming at building-up of a larger set of data. The latter is actually necessary to improve our understanding of the time and space evolution of the electric field in a Hall thruster. Measurements of the time-dependent ion VDF must be performed with a better signal-to-noise ratio at many locations along the thruster channel centerline. Measurements must also be carried out for several thruster operating conditions and various power levels. Finally, experimental results must be critically compared with numerical outcomes of PIC models of Hall thruster behavior.
Acknowledgements
Works are performed in the frame of the joint-program CNRS/CNES/SNECMA/Universities 3161 entitled “Propulsion par plasma dans l’espace”. They are also financially supported by the French National Research Agency in the frame of the 06-BLAN-0171 TELIOPEH project.
References
- [1] R. H. Frisbee, J. Propul. Power 19, 1129 (2003).
- [2] M. Martinez-Sanchez, J. E. Pollard, J. Propul. Power 14, 688 (1998)
- [3] V. V. Zhurin, H. R. Kaufmann and R. S. Robinson, Plasma Sources Sci. Technol. 8, R1 (1999).
- [4] V. Kim, J. Propul. Power 14, 736 (1998)
- [5] N. Gascon, M. Dudeck and S. Barral, Phys. Plasmas 10, 4123 (2003).
- [6] E. Y. Choueiri, Phys. Plasmas 8, 1411 (2001).
- [7] J. Kurzyna, S. Mazouffre, A. Lazurenko, L. Albar de, G. Bonhomme, K. Makowski, M. Dudeck and Z. Peradzynski, Phys. Plasmas 12, 123506 (2005).
- [8] J. P. Boeuf and L. Garrigues, J. Appl. Phys 84, 3541 (1998).
- [9] V. Vial, S. Mazouffre, M. Prioul, D. Pagnon and A. Bouchoule, IEEE Trans. Plasma. Sci. 33, 524 (2005).
- [10] L. Albaréde, S. Mazouffre, A. Bouchoule and M. Dudeck, Phys. Plasmas 13, 063505 (2006).
- [11] A. Bouchoule et al, Plasma Sources Sci. Technol. 10, 364 (2001).
- [12] W. A. Hargus Jr and M. A. Cappelli,Appl. Phys. B 72, 961 (2001).
- [13] W. A. Hargus Jr and C. S. Charles, J. Propul. Power 24, 127 (2008).
- [14] D. Gawron, S. Mazouffre, N. Sadeghi and A. Héron, Plasma Sources Sci. Technol. 17, 025001 (2008).
- [15] S. Mazouffre, D. Gawron, V. Kulaev and N. Sadeghi, IEEE Trans. Plasma Sciences 36, 1967 (2008).
- [16] B. Pellissier and N. Sadeghi, Rev. Sci. Instrum. 67, 3405 (1996).
- [17] V. Vial, A. Lazurenko, A. Bouchoule, M. Prioul, in Proceedings of the 28th International Electric Propulsion Conference, Toulouse, France, IEPC paper 2003-220.
- [18] J. Bareilles, G. J. M. Hagelaar, L. Guarrigues, C. Boniface, J. P. Boeuf, N. Gascon, Phys. Plasmas 11, 3035 (2004).
- [19] J.M. Fife, M. Martinez-Sanchez, J. Szabo, in Proceedings of the 33rd Joint Propulsion Conference and Exhibit, Seattle, WA, AIAA paper 1997-3052.