An outflow origin of the [Ne ii] emission in the T Tau triplet††thanks: Based on observations performed at ESO’s La Silla-Paranal observatory under DDT programme 280.C-5035
Abstract
Context. The 12.81 m [Ne ii] line has recently gained interest as a potential tracer of gas in the tenuous surface layers of circumstellar disks and in outflow-related shocks. Evidence has been found for a proportionality between [Ne ii] emission and X-ray luminosity, supporting the hypothesis that X-rays are responsible for the required ionization and heating of the gas. Alternatively, ionization and heating by EUV photons and in J-type (dissociative) shocks has been proposed.
Aims. The T Tau multiple system harbors three stars with circumstellar disks, at least one strong X-ray source (T Tau N), and regions of shocked gas in the immediate vicinity. ISO and Spitzer spectra revealed remarkably strong [Ne ii] emission, but because of insufficient spatial and spectral resolution those observations could neither pinpoint where in the system the [Ne ii] emission arises, nor identify the emission mechanism. We aim to clarify this by observing the system with enough resolution to spatially separate the various components and spectrally resolve the line emission.
Methods. We performed high-resolution (=) spectroscopy of the T Tau triplet at 04 spatial resolution with VISIR at the VLT early February 2008. We spatially separated T Tau N from the southern close binary T Tau S, as well as the structures of shocked gas surrounding the stars. The individual southern components Sa and Sb remained spatially unresolved in our observations.
Results. The dominant component of [Ne ii] emission is centered on T Tau S and has a spatial extent of 11 in a Gaussian fit. We detect spatially extended red-shifted emission NW of the system and fainter blue-shifted emission to the SE, which we associate with the N-S outflow from T Tau S. Only a small fraction of the [Ne ii] emission appears directly related to the X-ray bright northern component. Shocks may account for a substantial and possibly dominant fraction of the observed [Ne ii] emission. We estimate the total [Ne ii] flux to be 236 10-16 Wm-2, in good agreement with the values measured by ISO in late 1997 and Spitzer in early 2004.
Conclusions. Our observations show that outflows rather than the disk surface may dominate the observed [Ne ii] emission in stars with strong outflow activity. We propose [Ne ii] emission in jets as a major factor causing the observed large scatter in the vs. relation. We argue that T Tau S is the driving source of the T Tau “NW-blob”.
Key Words.:
stars: pre-main sequence – stars: individual: T Tau – circumstellar matter – infrared: stars – shock waves – X-rays: stars1 Introduction
Circumstellar disks are indispensable in the formation process of stars and are the birthplaces of planetary systems. Infrared observations of the refractory material (“dust”) show that the ingredients needed to form terrestrial planets and cores of giant gas planets are present and in place (see Natta et al. 2007, for an overview of dust in proto-planetary disks). The bulk of the disk mass is present in gaseous form, and is very difficult to observe due to its very low average opacity.
Infrared emission in the [Ne ii] fine structure transition at 12.81 m has recently gained interest as a potential tracer of gas in the tenuous upper layers of circumstellar disks, or of small amounts of gas in debris disks. The intrinsically much weaker [Ne iii] transition at 15.55 m is observed only in exceptional cases (Lahuis et al. 2007). If Ne+ is present and the gas is heated to 103 K, the fine structure transitions are excited and we may observe [Ne ii] emission (Glassgold et al. 2007; Pascucci et al. 2007; Lahuis et al. 2007; Ercolano et al. 2008). Several candidate mechanisms for the ionization and heating of the gas have been proposed. Neon can be ionized via K-shell absorption of stellar X-rays, X-ray irradiation also heats the gas to several thousand Kelvin (Glassgold et al. 2007; Ercolano et al. 2008). Alternatively, EUV photons may ionize neon and absorption of radiation by small grains or PAHs heats the gas via the photoelectric effect (Gorti & Hollenbach 2008). Strong, dissociative (J-type) shocks constitute a third possible ionization and heating mechanism (e.g. van den Ancker et al. 1999).
Glassgold et al. (2007) model the effect of X-ray irradiation on the surface of a circumstellar disk, demonstrating that an X-ray source with a luminosity typical of young stars provides significant ionization of Neon. The X-ray irradiation also heats the gas in the disk atmosphere to several thousand K out to a radius of 20 AU, beyond which there is a rather abrupt drop in gas temperature. Including mechanical heating from e.g. wind-disk interaction only makes a minor quantitative difference. Therefore, the [Ne ii] emission is restricted to the inner 20 AU of the disk.
To clarify the nature of [Ne ii] emission in YSOs there are currently two viable approaches. The first is a “statistical” approach, in which [Ne ii] luminosities of a sample of sources are compared to other observables, such as the X-ray luminosity, to search for correlations. Observations with the Spitzer Space Telescope have provided robust measurements of [Ne ii] fluxes of tens of young stars (e.g. Lahuis et al. 2007). Current space based observations are very sensitive, allowing relatively weak [Ne ii] lines to be detected, but leave the line emission spectrally and spatially unresolved, limiting their use as diagnostics for the emission mechanism. The second approach is to perform detailed observations of individual objects, in which the [Ne ii] emission is spectrally or spatially resolved. Such observations are currently only possible with ground based instrumentation, strongly reducing sensitivity compared to space-based measurements, and are only feasible for comparatively [Ne ii] bright objects. In this paper, we follow the second approach.
In a pioneering study following the statistical approach, Pascucci et al. (2007) suggested a correlation between the strength of the [Ne ii] emission and the X-ray luminosity in young stars surrounded by circumstellar disks. However, their sample constituted only 4 detections covering 0.2 dex in and , leaving the proposed correlation tentative. Based on a somewhat larger sample, Espaillat et al. (2007) cast doubt on the proposed relation between and . They suggest that may instead be correlated to the accretion rate and propose EUV radiation from accretion shocks, rather than stellar X-rays, to be the main agent for irradiation of the disk surface and formation of the [Ne ii] line. In a study following the statistical approach that we have conducted in parallel to the work presented here, we have extended the diagram to 33 objects with both [Ne ii] and X-ray detections, spanning 2 dex in both and (Güdel et al. 2009, in prep.), and do find a general trend of increasing with increasing . However, large scatter is evident, casting doubt on the proposed direct relationship between [Ne ii] emission and X-rays, and arguing that the [Ne ii] generation in young stars is more complex. In particular, sources with strong outflow activity are typically found to be over-luminous in the [Ne ii] line.
Here we investigate the nature of the [Ne ii] in YSOs by performing a detailed study of the prototype of young, low mass stars: T Tau (Joy 1945; Ambartsumian 1947, 1949). The T Tau system suits our objectives particularly well for several reasons: 1) it is a multiple system with 3 known disk-bearing young stars within the central arcsecond, of which at least one is a strong X-ray source (T Tau N); 2) it contains diffuse regions of shocked gas related to outflows on scales of several arcseconds; 3) it shows very strong [Ne ii] emission, allowing ground based studies at high spatial and spectral resolution.
Located in the Taurus molecular cloud at a distance of 148 pc (Loinard et al. 2007), the T Tau system consists of the optically visible northern component T Tau N and the “infrared companion” T Tau S approximately 07 to the south (Dyck et al. 1982). The latter is itself a close binary (Koresko 2000) with a current projected separation between the components Sa and Sb of 013 or 19 AU (e.g. Köhler et al. 2008). Mass estimates of the system members are 2 M⊙, 2.1 M⊙ and 0.8 M⊙ for T Tau N, Sa, and Sb, respectively (e.g. Köhler et al. 2008). T Tau suffers modest and time-variable line of sight extinction of 1 mag (Kuhi 1974; Mel’Nikov & Grankin 2005; Loinard et al. 2007). Towards Sb the extinction is estimated to be 15 mag (Duchêne et al. 2005), the extinction towards Sa is substantially higher and may be several tens of magnitudes (Duchêne et al. 2005). All three components show strong infrared excess emission, indicative of circumstellar disks (Mendoza V. 1966; Skemer et al. 2008). The heliocentric radial velocity of T Tau N is +19 km s-1 (Hartmann et al. 1986), those of Sa and Sb are 22 and km s-1, respectively (Duchêne et al. 2005).
One of the three stars, T Tau N, is a very bright, luminous, and variable X-ray source, the X-rays being predominantly of coronal origin. (Neuhäuser et al. 1995; Stelzer et al. 2000; Güdel et al. 2007). The other two stars are probably also prominent X-ray emitters but the strong absorption by the high intervening gas columns makes their detection close to the bright T Tau N very difficult (see Sect. 4.1 below; Güdel et al. 2007). The T Tau system was also shown to exhibit strong [Ne ii] emission by van den Ancker et al. (1999), who tentatively associate this emission with shocked gas in the NW blob.
In this study, we seek to clarify the origin of the [Ne ii] emission in the T Tau system. All three known stars, as well as the extended regions of shocked gas, fall within a single spatial resolution element of existing spectra made with ISO and Spitzer, leaving the origin of the emission and the underlying mechanism undetermined. We tackle the problem using high spatial (04) and spectral (30000) resolution ground-based observations, resolving the various components of the system.
2 Observations and data reduction
T Tau was observed with the mid infrared imager and spectrograph VISIR (Lagage et al. 2004), mounted on Melipal, the third of VLTs four 8.2 m Unit Telescopes. Our primary goal was to obtain high resolution spectra around the [Ne ii] () fine-structure line at 12.81355 m (Yamada et al. 1985). Spectroscopic observations were performed with 3 slit orientations, each executed during a separate night in February 2008 and calibrated independently (see Table 1). Additionally, imaging in an approximately 0.23 m wide filter centered on 12.81 m was performed, aimed at detecting bright [Ne ii] features at positions not covered by our spectroscopic observations. At a 3 detection threshold of 510-16 W m-2 arcsec-2, we did not detect any such features at radii beyond 1″ from the system. Our spectra are much more sensitive to [Ne ii] emission since the high dispersion strongly dilutes the vastly dominant telluric background and continuum dust emission. Note that the [Ne ii] emission contributes only 5% to the system flux integrated over the spectral passband of our imaging filter, the remaining 95% being continuum dust emission. In the remainder of this paper, we will restrict the discussion to the spectroscopic observations.
In an accompanying paper (van Boekel et al. 2009, in prep.) we report on the imaging observations, announcing unexpectedly fast (0.25 mag increase in 4 days) continuum brightness variations in T Tau S at 12.8 m. We attribute these to fast variations of the irradiation of the disk surface of T Tau Sa, due to variations in the accretion luminosity of the central source. Observationally, there is no evidence for a direct relation the between the IR continuum variability and the [Ne ii] emission (see also Sect. 4.2).
2.1 HR spectroscopy around 12.81 m
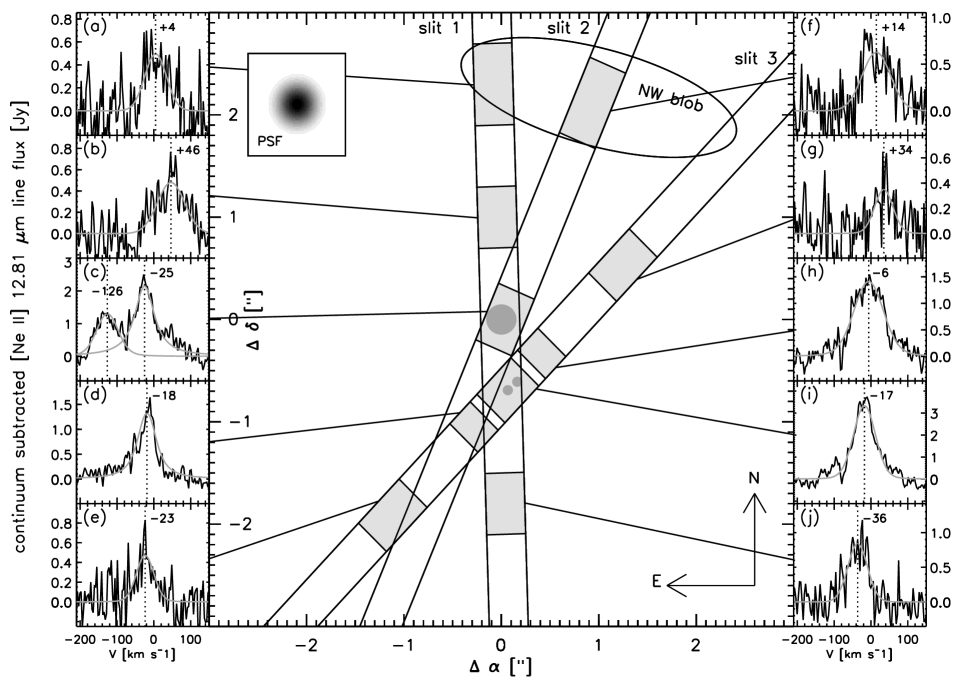
Long-slit spectroscopy of the T Tau system was performed with a slit width of 04 and a spectral resolution of 30000. In order to test various hypotheses to the origin of the [Ne ii] emission we observed the system with 3 different slit orientations, spatially covering the main components of interest (see Fig. 1). Slit 1 covers the northern and southern component, and is oriented roughly perpendicular to the Sa-Sb separation. Slit 2 covers the northern component and the “NW blob”, and incidentally catches T Tau S as well, albeit with significant slit losses. Slit 3 covers the southern component, and is oriented along the Sa-Sb separation. All slits cover some of the diffuse gaseous emission seen in deep AO-assisted near-infrared images (e.g. Herbst et al. 2007; Beck et al. 2008; Gustafsson et al. 2008).
All observations were performed by ESO staff during the nights starting 2, 3, and 6 February 2008, and are summarized in table 1. A relatively large chop throw of 18″ was used to avoid possible faint extended emission to be lost in the sky subtraction procedure. Any sufficiently bright emission within 9″ of the central sources would be detectable using our setup. A spectroscopic calibrator was observed along with each science observation for telluric and flux calibration. The atmospheric transmission was calculated using ATRAN (Lord 1992), a water column of 2 mm was found to give a good match to the calibration observations (note that there is only 1 strong water line in the spectral range covered, which is right at the red edge of our spectra and does not interfere with the [Ne ii] emission). Other telluric lines in our spectra are due to O3 and CO2, a strong CO2 line at 12.81224 m is the main spectral feature interfering with the [Ne ii] line. Our telluric correction using ATRAN removes all features to the noise level of our calibration observations (SNR 30). Taking the standard deviation in the total system response (including atmospheric transparency) determined from 6 calibration measurements, we estimate the absolute flux calibration of our spectra to be accurate to 5% (1). Radial velocity corrections have been applied to account for the Earth’s orbital motion, and the indicated velocities for all spectra shown in this paper are with respect to the systemic velocity of T Tau Sa (22 km s-1 heliocentric, Duchêne et al. 2005).
VISIR HR spectra suffer from “fringing”: a modulation of the flux with wavelength, with a peak to peak amplitude of about 15%. We found this effect to be stable over periods of at least several months by comparing our February data with observations obtained in June 2008. We fitted a spline profile to the calibration observations and divided the science observations by this curve. This procedure yielded satisfactory results, we estimate the amplitude of any possible remaining artifacts to be 2%.
| target | slit | observing date | airmass | |
|---|---|---|---|---|
| T-Tau | slit 1 | 03.02.2008 00:34 | 1.42 | 800 |
| HD-28305 | slit 1 | 03.02.2008 01:20 | 1.48 | 800 |
| T-Tau | slit 3 | 04.02.2008 00:34 | 1.43 | 960 |
| HD-28305 | slit 3 | 04.02.2008 01:26 | 1.51 | 800 |
| HD-28305 | slit 2 | 07.02.2008 00:41 | 1.43 | 800 |
| T-Tau | slit 2 | 07.02.2008 01:23 | 1.59 | 1040 |
3 Results
In Fig. 2 we show the spectra of the northern and southern components, extracted from slit 1 using the following method. At each wavelength, the profile along the spatial direction is assumed to be the sum of 2 Gaussians (one for T Tau N and one for T Tau S), of which the central position, width, and amplitude are fitted to best match the observations. The volume of both Gaussians yields the flux estimates for both sources. In terms of received energy, both spectra are dominated by continuum emission. The [Ne ii] line is spectrally resolved, and is clearly concentrated on the southern component. The extraction of 1-dimensional spectra from our data as shown in Fig. 2 provides a useful first impression of the [Ne ii] emission in the system, but discards much of the spatial information in our 2D long-slit spectra.
The continuum radiation we receive is thermal dust emission from the disks around T Tau North and South. Its width in the spatial direction ( of Gaussian fits) ranges from 043 to 048 between the different measurements, compared to 040 to 049 for the associated calibrators. We thus conclude that the continuum emission at 12.8 m is essentially spatially unresolved for both the northern and southern component (see also Fig. 3 and Sect. 3.1). At 12.8 m, the dust does not show spectral structure over the small wavelength range covered by our spectra (0.035 m). Likewise, the spatial profile is constant over our small spectral range. This allows the continuum emission to be subtracted by fitting the profile in the spectral range where no [Ne ii] emission is detected, and thus to isolate the line emission as well as interpolate of the continuum spatial profile to the wavelengths where we see [Ne ii] emission. We use the continuum subtracted spectra in our analysis.

3.1 Qualitative description of the observed [Ne ii] emission
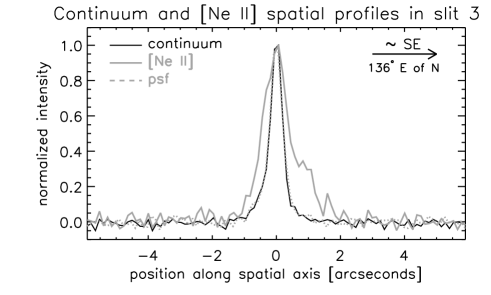
Contrary to the continuum dust emission, the observed [Ne ii] emission is clearly spatially extended. In Fig. 3 we show spatial profiles of the continuum dust emission and the [Ne ii] emission centered on T Tau S (after subtraction of the continuum)111In slit 3, we sampled the continuum blue-ward of the [Ne ii] line between 340 and 75 km s-1, and red-ward of the line between 100 and km s-1. as seen though slit 3, as well as the PSF obtained from the calibration measurement performed immediately after the science observation. The continuum emission remains spatially unresolved, whereas the [Ne ii] emission is clearly spatially resolved. The spatial extent of the line emission is 11 in a Gaussian fit in both slit 1 and slit 3 (N-S and NW-SE direction, respectively).
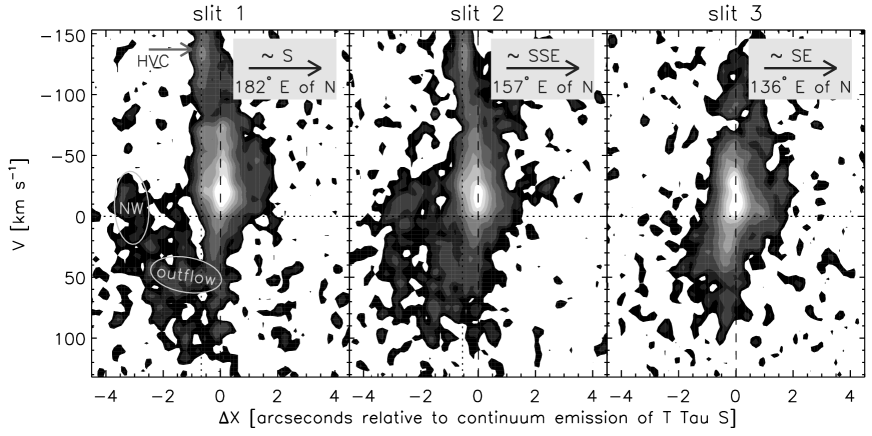
While in Fig. 1 we show [Ne ii] spectra extracted in various apertures at key positions in the system, Fig. 4 shows position-velocity diagrams for each of the slits, displaying our data with continuous spatial sampling. The strongest [Ne ii] contribution arises in the 11 spatially extended component centered on T Tau S. This emission is seen in apertures d, i, and h in Fig. 1. The E-W and NE-SW directions are not covered by our slits and thus the spatial extent in these directions cannot be determined. Note that the size of the emitting region, 11 corresponding to 160 AU, is much larger than the disk size of either Sa or Sb: due to mutual tidal interactions, either disk cannot be larger than 5 AU. The bright component centered on T Tau S has a velocity centroid that is blue-shifted compared to the stellar radial velocities.
It is possible that the spatially unresolved disks of Sa and Sb contribute to the 11 extended component centered on T Tau S. To estimate this contribution, we made a simple model of the line emission observed in slit 3, consisting of a point source and an extended, Gaussian component. Both components were convolved with the instrumental profile in the spatial direction, taken to be the profile of the unresolved continuum dust emission, and compared to the observed profile. As expected, the extended component contributes dominantly to the total flux, and we estimate the possible contribution of the central point source(s) in T Tau S to be 0.6 10-16 W m-2.
Fainter extended emission is detected at larger distances, out to 19 south of the T Tau S and 26 north of T Tau N. The emission in the northern direction is systematically brighter than that in the southern direction. The extended emission seen in the S to SE direction (apertures e and j in Fig. 1) is blue-shifted, in the N to NW direction we observe red-shifted emission (apertures b and g). We associate this emission with the N-S bipolar outflow discussed by Böhm & Solf (1994), i.e. their “C” and “D” components. The red-shifted (40 km s-1) emission in the N direction comes to a halt (10 km s-1) at the position of the “North-West blob” (apertures a and f). This is consistent with the existing notion, that the NW blob is a bowshock caused by an outflow impinging on ambient material.
At the position of T Tau N (aperture c) we find a blue-shifted high-velocity component with a velocity of 125 km s-1. Both the location and the velocity of this emission match with that of the “B” component detected by Böhm & Solf (1994), and we associate this emission with a jet from T Tau N. Additionally, a low-velocity blue-shifted component is seen at the position of T Tau N. Whether this emission can unambiguously be attributed to T Tau N is not clear, it may be part of the bright extended component centered on T Tau S. Interestingly, the total [Ne ii] flux in this component (10-16 Wm-2) roughly equals the value predicted by the tentative vs. relation for T Tau’s very high X-ray luminosity of 21031 erg s-1. However, the central velocity of 22 km s-1with respect to the stellar photosphere of T Tau N does not agree with a disk surface origin of this emission. If directly related to T Tau N, this emission may instead arise in a photo-evaporative flow from the T Tau N disk, of which we only see the approaching part since the receding, red-shifted part is obscured by the disk.
3.2 The origin of the N-S outflow and the “NW blob”
Our [Ne ii] position-velocity diagrams (see Fig. 4) clearly show the bright emission centered on T Tau S, as well as faint, extended emission, particularly to the north. In the -diagram of slit 1 we indicated the structures we associate with the northern part of the N-S outflow and the “NW blob”. In both slit 1 and slit 2 we can see that a connected structure is formed by the bright component centered on T Tau S, material flowing northward with positive radial velocity, and the material in the NW blob that has approximately the stellar radial velocity. This strongly argues for T Tau S being the source of the N-S outflow, as already proposed by Böhm & Solf (1994) but later challenged by Herbst et al. (1996). It also shows that the outflow from T Tau S is indeed the driving force for the NW blob bowshock.
3.3 Total [Ne ii] flux recovered
The [Ne ii] line has previously been detected in the T Tau system using the ISO satellite in late 1997 (van den Ancker et al. 1999), and with the Spitzer Space Telescope in early 2004. The measured line fluxes were 287 10-16 and 244 10-16 W m-2, respectively, during these epochs. This suggests that the [Ne ii] emission is fairly stable on timescales of several years, though measurements at more epochs are required to confirm this. It is also conceivable that short term variations exist, induced by X-ray flares or shocks related to variable accretion in T Tau S.
With our narrow slit, we do not cover the whole aperture through which the satellite spectra were taken, but we do sample the key regions at least partially. Since our slit width of 04 is much smaller than the measured width of =11 of the [Ne ii] emission centered on T Tau S, this component suffers from large slit losses. Approximating its spatial intensity profile with a point symmetric Gaussian, we find that a total [Ne ii] flux from this region of 11 10-16 W m-2. If the actual spatial extent in the E-W direction is smaller than 11, we will have over-estimated the contribution from this component.
North-West of the triplet our slits cover an estimated one third of the region from which the [Ne ii] appears to arise, and we find a flux of 8 10-16 W m-2 (this includes the “NW blob”). South-East of the triplet we estimate the extended emission to contribute 2 10-16 W m-2, assuming our slits cover one third of the emitting region. About 2.5 10-16 W m-2 of emission is seen at the position of T Tau N, of which about 40% stems from the high-velocity blue shifted component that is associated with a jet from T Tau N, and the rest from the low-velocity blue shifted component.
In total, we find a flux of 236 10-16 W m-2, where the relatively large error bar reflects the uncertainties induced by the correction for the incomplete spatial coverage of our data (for reference, the total line flux directly observed in the gray shaded apertures indicated in Fig. 1 is 8 10-16 W m-2). Thus, we obtain the same line flux as seen by ISO and Spitzer, and show that the [Ne ii] flux of the T Tau system was relatively stable over the 1997-2008 period.
4 Discussion
Our main goal was to identify the spatial origin of the [Ne ii] emission in the T Tau system, with a possible relation between X-rays and [Ne ii] emission in the back of our minds (Glassgold et al. 2007; Pascucci et al. 2007). The first and most obvious conclusion we can draw is that in the T Tau system there is no obvious direct relation between [Ne ii] emission and X-rays: whereas T Tau N is the dominant X-ray source, the [Ne ii] emission arises partly in a bright concentration centered on T Tau S that may constitute the inner parts of the N-S outflow from this source, and partly in the more extended regions of this outflow as well as in its terminal shock, the NW-blob.
Only a small fraction of the [Ne ii] emission, 10%, seems directly related to T Tau N: 1 10-16 W m-2 is emitted in the spatially unresolved high velocity (125 km s-1) component which we associate with the jet of T Tau N, another 1.5 10-16 W m-2 is seen at the location of T Tau N but does not seem to be originating in the disk surface as judged by its radial velocity of 22 km s-1with respect to the photosphere of T Tau N. Instead, it may arise in a photo-evaporative wind from the disk of T Tau N, or even be an outskirt of the spatially extended 11 component centered on T Tau S.
Thus, while some of the neon emission seen in the T Tau system may be X-ray induced, a direct relation between stellar X-rays and [Ne ii] emission from an irradiated disk surface (Glassgold et al. 2007) clearly does not hold in the case of T Tau. The vast majority of [Ne ii] emission detected in the T Tau system does not arise in the surface of any disk.
4.1 Mechanism responsible for [Ne ii] emission
What mechanism may be responsible for the ionization and excitation of the neon atoms in the various parts of T Tau system? Since the majority of the observed [Ne ii] emission arises in a spatially extended outflow, shocks constitute a primary candidate. In typical jet densities of 105 cm-3 the shock velocities required for producing substantial [Ne ii] emission are 70-100 km s-1(Hollenbach & McKee 1989). The line of sight velocities we observe in the outflow from T Tau S are 40 km s-1, but since the outflow is thought to be oriented close to the plane of the sky the actual velocities could plausibly be 100-300 km s-1. If the jet hits the inner “wall” of an outflow cavity under a grazing angle, only the velocity component perpendicular to the wall is relevant for the shock strength and the effective velocities are only a fraction of the jet velocity. All this considered, shocks provide a plausible mechanism for ionizing the material we observe in the [Ne ii] line, but more detailed modeling of the emitting medium is required to be conclusive. The needed temperatures for excitation of the fine structure transition of several thousand Kelvin require shock speeds of 1020 km s-1 which are easily reached everywhere in the observed outflow.
The second chief candidate mechanism for ionization and heating of the gaseous material is the absorption of stellar X-rays. The effectiveness of this mechanism is difficult to assess. Whereas the level and spectral shape of the X-ray emission from T Tau N are relatively well known, virtually no X-rays are detected from T Tau S. However, the high extinction toward both stars in the southern close binary allows for a substantial intrinsic X-ray luminosity of these objects. Sb suffers an estimated extinction of 15 mag (Duchêne et al. 2005); the extinction toward Sa is substantially higher, though its precise value is not well constrained. Adopting mag and a conversion to the gas column density appropriate for standard interstellar gas-to-dust mass ratios, cm-2 mag-1 (Vuong et al. 2003), we simulated the observed X-ray spectrum from T Tau S assuming that the intrinsic spectrum is identical to the one derived for T Tau N (Güdel et al. 2007). We find that the bremsstrahlung portion of the spectrum peaks at 2–3 keV, while radiation at 1 keV is suppressed by 3 orders of magnitude. The total energy flux (in erg cm-2 s-1) reaching Earth in the [0.3,10] keV interval is suppressed by a factor of 4.5. These suppression factors are applicable to possible X-ray emission from Sb, the attenuation of X-rays from Sa would be substantially stronger. Given the approximate relation between stellar mass and X-ray luminosity for T Tauri stars (Telleschi et al. 2007), we expect Sb to be intrinsically less luminous in X-rays than T Tau N by a factor of 5. The observed X-ray flux from Sb would thus become 5% of that of T Tau N, which agrees remarkably well with the 6.52.7% that Güdel et al. (2007) derive for the faint diffuse extention seen in the Chandra image at the approximate position of T Tau S. Thus, it is quite possible that the southern stars have significant X-ray emission, and Sa could be as X-ray bright as T Tau N without being unequivocally detected in the combined X-ray spectrum of the N-S system (see e.g. Güdel et al. 2007, who identify the main observed X-ray source with T Tau N). We note that the similar masses of T Tau N and Sa (e.g. Köhler et al. 2008) indeed suggest similar X-ray luminosities.
We have made an order of magnitude estimate of the level of [Ne ii] emission that would be induced by X-ray ionization in an extended volume of gas in the outflow from T Tau S. We do not attempt to model the [Ne ii] emission in detail, but rather wish to establish whether or not stellar X-rays form a plausible ionization mechanism for the outflow material, and focus on the more extended emission at distances of 1″. The source of X-rays could be T Tau N or one of the southern stars. We assume the outflow gas to be hot enough for the 12.81 m transition to be excited, and consider only X-ray ionization without additionally requiring heating by X-rays. We followed the methodology of Krolik & Kallman (1983) considering a stellar X-ray source irradiating a gaseous nebula, subject to continuum absorption and ionization. Ionization is to a large extent by photoelectrons produced by the primary photoionization. An average photoionization cross section was used for a gas with cosmic composition ( cm-2 at 1 keV, Igea & Glassgold 1999). For the calculation of the emissivity of the [Ne ii] transition, we followed Glassgold et al. (2007) using recombination rates from Shull & van Steenberg (1982) and Keady & Kilcrease (2000). We assuming a characteristic cylindrical outflow volume with a radial depth of 100 AU at a distance of 300-400 AU and a cross-section radius of 150 AU, and a gas density of cm-3, i.e. we mimic the volume of the T Tau NW blob. Furthermore, we take a bremsstrahlung X-ray spectrum approximating that of T Tau N ( erg s-1 in the 0.3–10 keV range, and a coronal electron temperature of keV, Güdel et al. 2007), an ambient outflow gas temperature of 5000 K, and an ambient ionization fraction of 0.1. We find luminosities of order erg s-1 in the [Ne ii] 12.8 m line, corresponding to W m-2 of observed flux. In apertures a) and f) in Fig 1 we detect a total of W m-2, which translates to approximately W m-2 after correction for the incomplete coverage of NW by our apertures. Thus, the line flux we predict is somewhat less but within a factor of a few of what the observations show. Since we know neither the depth of the source nor the density, both of which are extremely important for accurate estimates, our order of magnitude estimate is entirely satisfactory to show that X-ray absorption is a plausible ionization mechanism in the outflow. We note that this estimate is not based on self-consistent calculations; the production of ambient electrons (for the assumed ionization fraction of the gas) could be due to shock heating although the X-rays themselves help increase the ionization fraction as well.
X-ray heating will be effective relatively close to the stars; extrapolating the effective outer radius of the [Ne ii] emission in the Glassgold et al. (2007) and Ercolano et al. (2008) models of 20 AU to the X-ray luminosity of T Tau N, which is approximately 10 times higher than that of the canonical models, we may expect X-ray heating to be effective within 20 AU 70 AU. This simple extrapolation ignores optical depth effects, due to the lower densities in the outflow compared to the disk atmosphere in the aforementioned models, X-ray heating may still be effective to somewhat larger distances. However, we detect [Ne ii] emission out to 25 from T Tau N in the north and south direction, i.e. 370 AU in projection. Heating by X-rays will not be effective at these distances, but as argued before shocks provide sufficient heating at every position in the outflow.
In conclusion, both shocks and X-ray irradiation provide plausible means of ionizing the neon atoms in the outflow from T Tau S. More detailed investigations are needed to establish which mechanism is dominant. Heating by shocks is probably very effective throughout the outflow, while X-rays are unlikely to contribute significantly to the heating at radii 100 AU from the X-ray source(s). A “hybrid” model, in which X-rays are responsible for the ionization and shocks provide the heating required to excite the fine-structure transition, may provide the most adequate description of the [Ne ii] emission in the outflow from T Tau S and those of young stars with strong outflow activity in general.
4.2 Variability of the [Ne ii] emission?
The very fast continuum flux variations at 12.8 m detected in our VISIR data indicate a variable accretion rate in the central source on scales of a few stellar radii (van Boekel et al. 2009, in prep.), which is likely accompanied by variations in the outflow rate. Such variations may plausibly lead to variations in the [Ne ii] emission of T Tau, which is outflow dominated, as we have shown here. However, as outlined in Sect. 3.3, we find the [Ne ii] flux to be the same at epochs in 1997, 2004, and 2008, within the substantial uncertainties of the individual measurements. This suggests that the [Ne ii] flux is relatively constant over long periods. The continuum flux of T Tau S, on the contrary, is known to be strongly variable (e.g. Ghez et al. 1991), and in fact it has varied by a factor of 2 between the three aforementioned epochs. Thus, there is no direct relationship between the observed [Ne ii] and IR continuum fluxes. Note that if variations in accretion and outflow rate (as traced by the IR continuum fluxes) would result in changes in the [Ne ii] flux, they would do so with a certain time lag, corresponding to the time needed for the out-flowing material to reach the positions where we observe the [Ne ii] emission. Given the relatively large spatial scales involved, this time lag would be 1 year to tens of years, depending on the actual (de-projected) outflow velocity and the region under consideration.
5 Summary and conclusions
We have conducted high spatial (04) and spectral (30000) resolution observations of the T Tau multiple system, in order to reveal the origin of the strong [Ne ii] emission seen in space based observations in which the emission remained spatially and spectrally unresolved. The T Tau system contains 3 circumstellar disks, at least 1 strong X-ray source, and extended regions of shocked gas, thus providing several potential mechanisms producing [Ne ii] emission and an opportunity to test which is effective.
We find that the [Ne ii] emission is not concentrated on the X-ray bright northern component, but instead consists of a spatially extended (11) concentration centered on T Tau S that is likely the central part of the known N-S outflow from this source, and more diffuse emission associated with this same outflow. The total [Ne ii] flux we derive from our February 2008 observations is, within uncertainties, equal to the flux seen in ISO and Spitzer spectra taken in late 1997 and early 2004, respectively, suggesting that the [Ne ii] emission was not strongly variable over the last decade.
Recently, Glassgold et al. (2007) proposed that irradiation of the disk surface by stellar X-rays can lead to observable [Ne ii] emission (see also Ercolano et al. 2008). Indeed, this mechanism was shown to plausibly account for the [Ne ii] emission in several stars (Herczeg et al. 2007; Pascucci et al. 2007). However, we here show that in the T Tau system, there is no direct relation between the observed X-ray flux and [Ne ii] emission from a disk surface. Instead, the [Ne ii] emission arises in an outflow. While we could not establish the ionization and excitation mechanism of the neon with certainty at every location in the system, we show that that both shocks and the absorption of stellar X-rays provide plausible ionization mechanisms for the outflow material. Shocks are the favored mechanism for providing the required heating of outflow material, though X-rays may contribute within 100 AU of the stars.
Generalizing our result, we argue that young stars that exhibit outflows and shocks related to strong accretion activity can show strong [Ne ii] emission that is not directly related to the stellar X-ray emission in the fashion of the Glassgold et al. (2007) model. We propose outflows to be an important [Ne ii] contributor, that may dominate over the disk surface emission at high outflow rates. This is indeed supported by our statistical study of a large sample of T Tauri stars that show a correlation between the [Ne ii] luminosity and outflow parameters, and also indicates that stars with jets reveal excessive levels of [Ne ii] emission (Güdel et al. 2009, in prep.). Lastly, we emphasize the importance of more spatially or spectrally resolved studies of the [Ne ii] line in young stars, such as that of Herczeg et al. (2007) and this work, in order to search for signatures of outflows and Keplerian rotation in a disk surface. This is a challenging task since in the other stars in which the [Ne ii] line has been detected, it is typically fainter by at least an order of magnitude compared to the line flux observed in the T Tau system.
Acknowledgements.
We thank the ESO staff for performing the observations presented in this paper in service mode. We thank Reinhard Mundt, Tom Herbst, Maiken Gustafsson, Rainer Köhler, and Thorsten Ratzka for clarifying and inspiring discussions on the circumstellar environment of T Tau. MG acknowledges support by the Max-Planck-Institute for Astronomy in Heidelberg, Germany, and Leiden University, The Netherlands, for his Sabbatical stays during which studies of the [Ne ii] radiation partly described here were started. We thank ESO for the opportunity to perform the observations on which this paper is based in Director’s Discretionary Time. An anonymous referee is acknowledged for a detailed and constructive review and several recommendations which helped improving the clarity of this paper.References
- Ambartsumian (1947) Ambartsumian, V. A. 1947, Stellar Evolution and Astrophysics (Erevan: Acad. Sci. Armenian S. S. R.
- Ambartsumian (1949) Ambartsumian, V. A. 1949, AZh, 26, 3
- Beck et al. (2008) Beck, T. L., McGregor, P. J., Takami, M., & Pyo, T.-S. 2008, ApJ, 676, 472
- Böhm & Solf (1994) Böhm, K.-H. & Solf, J. 1994, ApJ, 430, 277
- Duchêne et al. (2005) Duchêne, G., Ghez, A. M., McCabe, C., & Ceccarelli, C. 2005, ApJ, 628, 832
- Dyck et al. (1982) Dyck, H. M., Simon, T., & Zuckerman, B. 1982, ApJ, 255, L103
- Ercolano et al. (2008) Ercolano, B., Drake, J. J., Raymond, J. C., & Clarke, C. C. 2008, ApJ, 688, 398
- Espaillat et al. (2007) Espaillat, C., Calvet, N., D’Alessio, P., et al. 2007, ApJ, 664, L111
- Ghez et al. (1991) Ghez, A. M., Neugebauer, G., Gorham, P. W., et al. 1991, AJ, 102, 2066
- Glassgold et al. (2007) Glassgold, A. E., Najita, J. R., & Igea, J. 2007, ApJ, 656, 515
- Gorti & Hollenbach (2008) Gorti, U. & Hollenbach, D. 2008, ApJ, 683, 287
- Güdel et al. (2009) Güdel, M., Lahuis, F., Henning, T., et al. 2009, in prep., http://www.ipac.caltech.edu/spitzer2008/talks/ManuelGuedel.html
- Güdel et al. (2007) Güdel, M., Skinner, S. L., Mel’Nikov, S. Y., et al. 2007, A&A, 468, 529
- Gustafsson et al. (2008) Gustafsson, M., Labadie, L., Herbst, T. M., & Kasper, M. 2008, A&A, 488, 235
- Hartmann et al. (1986) Hartmann, L., Hewett, R., Stahler, S., & Mathieu, R. D. 1986, ApJ, 309, 275
- Herbst et al. (1996) Herbst, T. M., Beckwith, S. V. W., Glindemann, A., et al. 1996, AJ, 111, 2403
- Herbst et al. (2007) Herbst, T. M., Hartung, M., Kasper, M. E., Leinert, C., & Ratzka, T. 2007, AJ, 134, 359
- Herczeg et al. (2007) Herczeg, G. J., Najita, J. R., Hillenbrand, L. A., & Pascucci, I. 2007, ApJ, 670, 509
- Hollenbach & McKee (1989) Hollenbach, D. & McKee, C. F. 1989, ApJ, 342, 306
- Igea & Glassgold (1999) Igea, J. & Glassgold, A. E. 1999, ApJ, 518, 848
- Joy (1945) Joy, A. H. 1945, ApJ, 102, 168
- Keady & Kilcrease (2000) Keady, J. J. & Kilcrease, D. P. 2000, Radiation (Allen’s Astrophysical Quantities), 95–+
- Köhler et al. (2008) Köhler, R., Ratzka, T., Herbst, T. M., & Kasper, M. 2008, A&A, 482, 929
- Koresko (2000) Koresko, C. D. 2000, ApJ, 531, L147
- Krolik & Kallman (1983) Krolik, J. H. & Kallman, T. R. 1983, ApJ, 267, 610
- Kuhi (1974) Kuhi, L. V. 1974, A&AS, 15, 47
- Lagage et al. (2004) Lagage, P. O., Pel, J. W., Authier, M., et al. 2004, The Messenger, 117, 12
- Lahuis et al. (2007) Lahuis, F., van Dishoeck, E. F., Blake, G. A., et al. 2007, ApJ, 665, 492
- Loinard et al. (2007) Loinard, L., Torres, R. M., Mioduszewski, A. J., et al. 2007, ApJ, 671, 546
- Lord (1992) Lord, S. D. 1992, NASA Technical Memorandum 103957
- Mel’Nikov & Grankin (2005) Mel’Nikov, S. Y. & Grankin, K. N. 2005, Astronomy Letters, 31, 109
- Mendoza V. (1966) Mendoza V., E. E. 1966, ApJ, 143, 1010
- Natta et al. (2007) Natta, A., Testi, L., Calvet, N., et al. 2007, in Protostars and Planets V, ed. B. Reipurth, D. Jewitt, & K. Keil, 767–781
- Neuhäuser et al. (1995) Neuhäuser, R., Sterzik, M. F., Schmitt, J. H. M. M., Wichmann, R., & Krautter, J. 1995, A&A, 297, 391
- Pascucci et al. (2007) Pascucci, I., Hollenbach, D., Najita, J., et al. 2007, ApJ, 663, 383
- Shull & van Steenberg (1982) Shull, J. M. & van Steenberg, M. 1982, ApJS, 48, 95
- Skemer et al. (2008) Skemer, A. J., Close, L. M., Hinz, P. M., et al. 2008, ApJ, 676, 1082
- Stelzer et al. (2000) Stelzer, B., Neuhäuser, R., & Hambaryan, V. 2000, A&A, 356, 949
- Telleschi et al. (2007) Telleschi, A., Güdel, M., Briggs, K. R., Audard, M., & Palla, F. 2007, A&A, 468, 425
- van den Ancker et al. (1999) van den Ancker, M. E., Wesselius, P. R., Tielens, A. G. G. M., van Dishoeck, E. F., & Spinoglio, L. 1999, A&A, 348, 877
- Vuong et al. (2003) Vuong, M. H., Montmerle, T., Grosso, N., et al. 2003, A&A, 408, 581
- Yamada et al. (1985) Yamada, C., Kanamori, H., & Hirota, E. 1985, J. Chem. Phys., 83, 552