11email: roccata@mpia.de 22institutetext: University of Kiel, Institute of Theoretical Physics and Astrophysics, Leibnizstrasse 15, D-24098 Kiel, Germany 33institutetext: Research and Scientific Support Department, ESA/ESTEC, 2201 AZ Noordwijk, The Netherlands 44institutetext: California Institute of Technology, Department of Astronomy, MS 105-24, Pasadena, CA 91125 55institutetext: Steward Observatory, The University of Arizona, 933 North Cherry Avenue, Tucson, AZ 85721 66institutetext: Jet Propulsion Laboratory, California Institute of Technology, Mail Stop 169-506, Pasadena, CA 91109
Long-wavelength observations of debris discs around sun-like stars ††thanks: This work is based on observations made with the IRAM (Institut de Radioastonomie Millimétrique) 30-m telescope and the CSO (Caltech Submillimetre Observatory) 10-m telescope. IRAM is supported by INSU/CNRS (France), MPG (Germany), and IGN (Spain).
Abstract
Context. Tracing the evolution of debris discs is essential for our understanding of planetary system architectures. While the evolution of their inner discs has been recently studied with the Spitzer Space Telescope at mid- to far-infrared wavelengths, the outer discs are best characterised by sensitive millimetre observations.
Aims. The goal of our study is to understand the evolution timescale of circumstellar debris discs, and the physical mechanisms responsible for such evolution around solar-type stars. In addition, we perform a detailed characterisation of the detected debris discs.
Methods. Two deep surveys of circumstellar discs around solar-type stars at different ages were carried out at 350 m with the CSO and at 1.2 mm with the IRAM 30-m telescope. The dust disc masses were computed from the millimetre emission, where the discs are optically thin. Theoretically, the mass of the disc is expected to decrease with time. In order to test this hypothesis, we performed the generalised Kendall’s tau correlation and three different two-sample tests. A characterisation of the detected debris discs has been obtained by computing the collision and Poynting-Robertson timescales and by modelling the spectral energy distribution.
Results. The Kendall’s tau correlation yields a probability of 76 that the mass of debris discs and their age are correlated. Similarly, the three two-sample tests give a probability between 70 and 83 that younger and older debris systems belong to different parent populations in terms of dust mass. We detected submillimetre/millimetre emission from six debris discs, enabling a detailed SED modelling.
Conclusions. Our results on the correlation and evolution of dust mass as a function of age are conditioned by the sensitivity limit of our survey. Deeper millimetre observations are needed to confirm the evolution of debris material around solar-like stars. In the case of the detected discs, the comparison between collision and Poynting-Robertson timescales supports the hypothesis that these discs are collision dominated. All detected debris disc systems show the inner part evacuated from small micron-sized grains.
Key Words.:
circumstellar matter - planetary systems: formation - stars: late-type - Kuiper Belt1 Introduction
As part of the star formation process in molecular cloud cores,
circumstellar discs form conserving the initial angular momentum.
These so-called primordial discs have typical masses
(10-3-10-2M⊙) and sizes comparable to that
expected for the primitive solar nebula and they provide the environment
and material from which planets are expected to form (Beckwith et
al. beckwithetal.PPIV (2000), Natta et al. NattaPPV2007 (2007)).
The first stages of planet formation occur close to the disc mid-plane
where sub-micron grains grow to millimetre sizes and settle (e.g. Beckwith
et al. beckwithetal.PPIV (2000)). Larger planetesimals may successively
form by collisions between grains and through gravitational instabilities
(e.g. Johansen et al. (2007), Henning h2008 (2008)). The primordial gas
in circumstellar discs is thought to last for 1-10 Myr (e.g. Haisch et
al. Haischetal2001 (2001), Lawson et al. Lawsonetal2004 (2004)).
After the gas is dispersed from the discs, the dust grains are removed
from the optically thin disc by radiation pressure, Poynting-Robertson drag
or dust sublimation on timescales shorter than the stellar pre-main
sequence lifetime (Backman & Paresce bp (1993), Meyer et
al. Meyeretal2007 (2007)).
Nevertheless, an infrared excess above the stellar photosphere has been
discovered around more than 300 pre- and main-sequence stars.
These stars are thought to host a remnant debris disc.
Backman & Paresce (bp (1993)) suggested that the infrared excess of these objects
comes from small dust particles which are the products of collisions of larger bodies. Thus, a debris disc
should consist of a ‘second generation’ of small dust particles, larger bodies and, possibly, planets.
The formation of large bodies is thought to be faster in the inner part of
the disc (Kenyon & Bromley 2004a ).
As a consequence, new small dust particles will be produced by collisions
first in the inner region of the disc and, later, further out
(Kenyon & Bromley 2004a ). During this phase, small dust particles
are continuously produced in the disc. In this perspective, transitional objects are of particular interest. These may represent
a transitional phase between the primordial optically thick
disc phase and the debris optically thin disc phase. Their infrared excess
suggests the presence of an inner hole in the disc where the small grain
population, which emits in the near-IR, is missing. Some of them are still
accreting material onto the central star, while others show intense
collisional activity in their inner part, possibly induced by the
formation of planets (Currie et al. (2007), Kenyon & Bromley 2004b ).
While the dissipation of debris discs takes place by radiation pressure
and/or Poynting-Robertson drag and the total dust mass decreases with time,
at early stages the stellar wind drag can be an important dust removal
mechanism. Depending on which of these processes is the main driver of dust
removal, we expect a power-law dependence with a different index (Dominik
& Decin (2003ApJ…598..626D (2003)), Wyatt et
al. (2007a ,b), Löhne et
al. (Loehneetal2008 (2008)))
and a different dust distribution if a planetesimal belt at a given
distance is creating dust of just one size (Wyatt Wyatt2005 (2005)).
Spangler et al. (2001ApJ…555..932S (2001)) measured the fractional
luminosity () of pre- and main sequence stars with
ISO. They found that the fractional luminosity, which is proportional
to the dust present in the disc, decreases with time as .
While the analysis of Spangler et al. (2001ApJ…555..932S (2001)) included also
pre-main sequence stars, Habing et al. (Habingetal2001 (2001)) analysed the
ISO and IRAS data of nearby main-sequence stars alone: they concluded that
most of the stars reach the main-sequence surrounded by a disc which decays
in about 400 Myr. Decin et al. (Decinetal2003 (2003)) reviewed the different
studies on the time dependency of Vega-like systems done with ISO/IRAS. They
concluded that the observations only indicated a large spread in fractional
luminosity for stars at most ages, that the maximum excess was independent of
time and that the debris disc phenomenon was more common in younger stars. An
analysis of the near to far infrared excess, carried out with Spitzer, led to
the finding of a general decrease of the fractional luminosity with time as
, starting later at longer wavelengths (Su et al. (2006)).
This suggested a disc clearing more efficiently in the inner parts
(Su et al. (2006)). Deviations from these trends have been
associated with a recent or still ongoing collisional cascade that
produces a small dust grain population which is rapidly removed by radiation
pressure or by the action of the Poynting-Robertson drag
(Song et al. (2005), Wyatt et al. 2007b ).
A complementary picture of the evolution of the outer part of the debris
discs is provided by (sub)millimetre observations. These show a decline in
the dust mass as a function of age and significant evolution of the
circumstellar dust mass within the first 10 Myr and between 10 Myr and a
few Gyr (e.g. Liu et al. (2004), Carpenter et
al. 2005AJ….129.1049C (2005) (hereafter C05)).
In this paper we present the results of two deep sub-millimetre and
millimetre surveys of circumstellar discs around solar-type stars with ages
between 3 Myr and 3 Gyr. The characteristics of our sample are presented in §2.1. The
observations carried out at 350 m and at 1.2 mm are reported in
section 2.2 and section 2.3. The results from our two surveys are presented
in section 2.4.
The discussion of the dust disc mass evolution as a function of the age of
the systems, compared with the history of our solar system, is presented in
section 3.
A detailed analysis of the debris disc properties by modelling their
spectral energy distribution (SED) is provided in section 4 and finally
the summary is presented in section 5.
2 Observations
2.1 Sample
Nearby sources (d150 pc) were selected from The Formation and Evolution of Planetary Systems (FEPS) Spitzer Legacy program (Meyer et al. meyerFEPS2006 (2006)). The FEPS sample contains 314 stars with stellar masses between 0.5 and
2 M☉, ages spanning the range from 3 Myr to 3 Gyr and spectral
types between K7 and F5. In addition, 14 objects were initially included
in the FEPS sample because of an infrared excess previously detected with
IRAS/ISO. Since these sources can introduce a bias in the FEPS
sample with respect to the presence of a disc, they are not taken
into account in any statistical analysis in this paper.
The characteristics of the entire star sample have been extensively analysed by
the FEPS team (e.g. Meyer et al. meyerFEPS2006 (2006), Mamajek & Hillenbrand Mamajek&Hillenbrand2008 (2008)).
The stellar ages are based on pre-main sequence tracks for stars younger than 10 Myr, X-ray activity and the
strength of the CaII H and K emission for nearby solar-type stars
(50 pc), and the association of stars with clusters or star-forming regions of known age. A new calibration presented in Mamajek &
Hillenbrand (Mamajek&Hillenbrand2008 (2008)) has been applied.
Final ages will be presented by Hillenbrand et al. (in preparation, see also Mamajek & Hillenbrand Mamajek&Hillenbrand2008 (2008)).
The distances of the sources were determined by the FEPS team on the basis of Hipparcos
parallaxes for nearby stars and kinematic distances for stars associated with
young moving groups and associations.
Our total sample contains 141 sources of which:
- 16 targets were observed at 350 m with the CSO (Caltech
Submillimetre Observatory) 10-m telescope (see col. 6 Table LABEL:fluxes)
- 40 targets were observed at 1.2 mm with the IRAM (Institut de
Radioastronomie Millimétrique) 30-m telescope (see col. 7 Table LABEL:fluxes)
- 121 targets are taken from the SEST (Swedish-ESO Submillimetre
Telescope) and OVRO (Owens Valley Radio Observatory) surveys
performed by Carpenter at. al (2005AJ….129.1049C (2005)), of which 17 have been re-observed during our surveys.
The sample includes 15 sources younger than 10 Myr, 16
intermediate-age systems (10-20 Myr) and 110 evolved systems
( 20 Myr). In section 3 we only consider the evolved systems
in order to search for a correlation between
the mass of the debris disc and the age of the system. In particular, 104
out of the 110 evolved systems are
analysed excluding the sources not compatible with the FEPS sample
selection (see above). The 104 sources analysed here include 45% of the
FEPS sample older than 20 Myr and in particular: 35% of the systems with
no infrared excess (until 70 m) and 89% with excess.
2.2 CSO observations at 350 m
Observations of the sources listed in Table 1 were carried out at the CSO between 17 and 21 April 2005, using the Submillimetre High Angular Resolution Camera II (SHARC-II) with the 350 m filter. The full width at half maximum (FWHM) for the 10.4 m telescope beam profile is 8.5 at this wavelength. The median zenith opacity at 225 GHz was 0.04. The typical on-source integration times varied from 40 minutes to 2 hours depending on source elevation and zenith opacity, although a deeper 3.5 hour integration was obtained for HD 107146 (see Corder et al. Corderetal2008 (2009)). Pointing and instrumental flux calibrators were selected from the CSO SHARC-II list of calibrators. Data imaging and reduction were carried out using the Comprehensive Reduction Utility for SHARC-II. The errors associated with each detection are the quadratic sum of the instrumental error (between 5.3 and 45 mJy) and the calibration errors (between 12 and 22 of the flux). Instrumental errors are computed based on the rms computed in a sky annulus, and propagated over the photometric aperture. Calibration errors were determined based on repeatability of the flux calibrators over the entire observing run.
2.3 IRAM observations at 1.2 mm
Millimetre continuum observations of 40 sources at 1.2 mm were
carried out between May and December 2005 (Projects num. 013-05, 141-05)
and between January and April 2008 (Project num. 185-07) at the IRAM
30-m telescope at Pico Veleta with MAMBO2, the 117 channel IRAM
bolometer. The FWHM of the 30-m telescope beam is 11 at 1.2 mm.
The median zenith opacity at 230 GHz was 0.5 during the first run between May and
November 2005, and 0.3 during the second run carried out in December 2005 and
during the last run in 2008. Pointing and calibrator sources were selected
from a standard list provided by IRAM.
The observations were carried out in on-off integration mode using a
standard calibration. An rms of 0.7 mJy was obtained in one hour (blocks of three times 20
minutes) of on-off integration. The weather conditions were stable during
most of the nights and the calibrators were observed within a few hours from the science targets.
The data were reduced with the data reduction package MOPSIC (R. Zylka 2006).
Observations of the same target at different dates were coadded to increase the
signal to noise. The uncertainties associated with each flux are the quadratic sum of the
statistical error and the calibration error. The statistical error is the rms of the flux
over the entire telescope field of view, while the calibrator error is based on the agreement
between the predicted calibrator fluxes and those measured over 48 hours
before and after the observations. We obtained statistical errors between
0.8 and 2.8 mJy and calibration errors between 11 and 16 in flux.
The final uncertainties are dominated by the statistical error in the IRAM observations.
2.4 Detections and upper limits
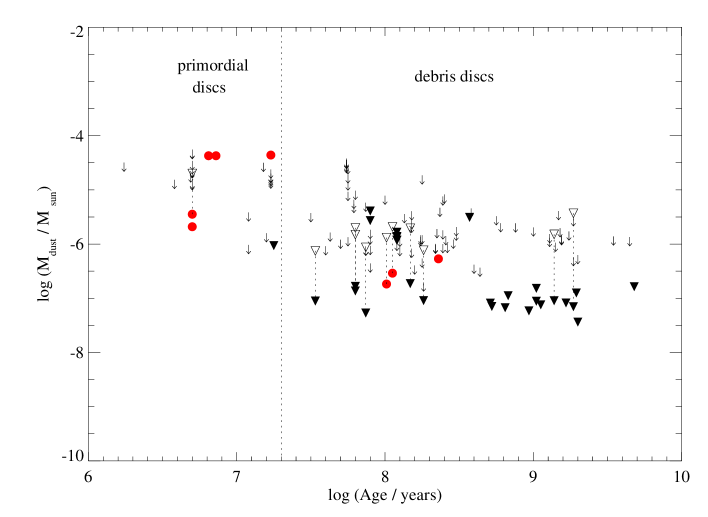
The fluxes (in the case of detections) and the 3 upper limits (in the case of non-detections) measured at 350 m and 1.2 mm are listed in Table LABEL:fluxes. The detection errors and the upper limits include only the statistical error. The calibration uncertainty is reported in the note to Table LABEL:fluxes. The 3 upper limits were computed as 3 times the statistical error described above. 31 sources have been observed with IRAM, 7 sources only with CSO and 9 sources with both telescopes. We detected 11 sources in total: 5 sources with IRAM, 8 with the CSO. Two of the sources were detected with both IRAM and CSO. Five of them are primordial discs younger than 10 Myr, and six are debris discs. All sources were unresolved with the exception of HD 107146 which had a deconvolved size at 350 m of with an uncertainty of about per axis (Corder et al. Corderetal2008 (2009)).
3 Disc dust mass
The main goal of this project is to analyse the temporal evolution of
circumstellar debris discs and the mechanism of their dissipation around solar-type stars.
The dust mass in debris discs is expected to decrease with time. Depending on which
process (collisions or Poynting-Robertson drag) is the main driver of dust
removal, we expect a different power-law dependence of the dust mass as a function of the age of
the system (Dominik & Decin 2003ApJ…598..626D (2003)).
In this analysis we include the dust masses computed from the
observations of nearby solar-type stars obtained with IRAM presented here and with SEST and OVRO (from C05).
The disc is assumed to be isothermal and optically thin () at millimetre wavelengths.
The dust disc mass can then be derived from
the millimetre flux, using the following equation:
| (1) |
where is the mass absorption coefficient, parametrises the frequency dependence of and is the observed flux. is the distance to the source, is the dust temperature and is the Planck function.
In order to be consistent with C05, we compute the dust masses assuming , =2 at 1.3 mm (Beckwith et al. (1990)) and =40 K.
The uncertainty in the dust mass is computed
using error propagation.
In the following, we discuss the principal systematic errors which are
present in the final dust mass uncertainty.
The mass absorption coefficient is poorly constrained. We consider as
limit the commonly used value for debris discs of =1.7 at
800 m adopted by Zuckerman & Becklin (Zuckerman&Becklin1993 (1993)),
which corresponds to =1.0 at 1.3 mm.
The mass absorption coefficient alone introduces at least a factor 2
in the final uncertainty associated to the mass.
In order to be consistent with the previous analysis of C05, we adopted a
temperature of 40 K. This represents a compromise between the
temperature associated with cold
dust in protoplanetary discs (20-30 K,
e.g. Beckwith et al. (1990)) and warm dust
in debris discs (40-100 K; Zuckerman &
Song 2004a ).
Since the mass is proportional to , the temperature
alone introduces a factor of 2 in the uncertainty of the masses.
Another source of uncertainty in the final mass error is introduced by the
source’s distance. Nevertheless, the parallax of most of the sources older than 20 Myr
(which will be in the following analysed), has been measured by Hipparcos, and the distance uncertainty is directly computed from the
parallax uncertainty. This contributes an uncertainty of at least 10 of the dust masses.
The 3 upper limits to the dust mass have been computed when the
sources were not detected with a signal to noise ratio of at least three.
The mass of the newly observed sources younger than 20 Myr is also plotted
as reference 111Note however, that the
assumption of optically thin emission at millimetre wavelength cannot
be generalised to all primordial discs.
Taking into account the uncertainty on distance, temperature, measured
flux and mass absorption coefficient, the final uncertainty is 55 of the dust mass.
3.1 Evolution of the dust mass
Mass detections and upper limits are presented in Fig. 1 as a
function of age. In total, we plotted 132 upper limits and 9 detections
computed from the millimetre measurements. 17 sources have been observed
in both surveys, C05 and with IRAM (connected by a dotted line in Fig. 1).
Due to the higher sensitivity of the IRAM bolometer compared to SEST
and OVRO, we detected 4 discs with dust masses down to
, about one order of magnitude smaller than
those in C05.
The other variable which can strongly affect our analysis is the age
determination of the discs older than 20 Myr.
Their ages derived using different techniques are summarised in
Table 2. The final
ages are computed as the average and the standard deviation is adopted as
uncertainty (Table 2). A more detailed discussion of the ages of
the whole FEPS sample will be presented by Hillenbrand et al. (in
preparation, see also Mamajek & Hillenbrand (Mamajek&Hillenbrand2008 (2008))).
In the following subsection we present the statistical analysis aimed at constraining
the physical characteristics of the dust in circumstellar discs at ages
older than 20 Myr, in order to understand the timescale and the
dissipation mechanism in debris discs.
| Method | HD 377 | HD 8907 | HD 104860 | HD 107146 |
|---|---|---|---|---|
| 8.34 | 8.78 | 8.44 | 8.09 | |
| 7.99 | 8.1 | - | 8.89 | |
| – | - | 7.62 | - | |
| - | 7.9 | 7.88 | 8.06 | - |
| 7.8 | 9.28 | 8.08 | 8.1 | |
| average | 8.01 | 8.51 | 8.05 | 8.36 |
| stdev | 0.23 | 0.64 | 0.34 | 0.46 |
3.1.1 Method: statistical analysis
A quantitative analysis of the dust mass-age relation was performed for
systems older than 20 Myr. We
carried out a survival analysis (Feigelson & Nelson
1985ApJ…293..192F (1985)) in order to include the information contained
in the dust mass upper limits derived from the millimetre non-detections.
We use the program ASURV Rev. 1.2 (Lavalley et al. (1992)), which
implements the survival analysis methods presented in Feigelson & Nelson
(1985ApJ…293..192F (1985)) and Isobe et al. (1986ApJ…306..490I (1986)).
The generalised Kendall’s tau correlation (Brown et
al. Brownetal1974 (1974)) was used to measure the degree of correlation
between age and disc mass among debris discs. Such a method includes the
analysis of both detections and upper limits.
The probability that the disc mass is correlated with the age is 76.
To determine whether there is a different dust mass distribution in debris
disc systems older than 20 Myr, we used two-sample tests. We applied
three different tests: the Gehan, logrank, and Peto-Prentice tests (e.g.
Feigelson & Nelson 1985ApJ…293..192F (1985)).
In order to investigate the evolution of the debris dust we divided the
sample of objects older than 20 Myr in two sub-samples with almost the same
number of objects: the first with ages between 20 and 180 Myr, and
the second sub-sample with ages between 180 Myr and 5 Gyr.
The three two-sample tests give a probability between 70 and 83
that younger and older debris systems belong to different parent populations
in terms of dust mass.
The relatively low significance of our results comes from the low number of
detected sources, compared to the upper limits, and the small range in
age of the detected debris discs. This leads to a high probability to assign
a detected disc to a different sub-sample in age.
We could not perform any conclusive linear regression to the data points
since the detected objects span a very narrow range in age and masses, and in general
there are too many upper limits compared to detections.
3.2 Discussion
The detection limit of our survey does not allow to draw any firm conclusion
about the evolution of the debris dust around solar-like stars as a function of age.
Even more sensitive millimetre observations are needed to find statistically
reliable trends.
Our sample is biased toward sources with infrared excess. However, with the current
sensitivity limit, additional observations of sources without infrared excess, which
have a smaller probability to be detected in the millimetre, would only increase
the number of upper limits. This would not change the result of our
statistical analysis.
We recall that all the mass derivations are valid only if the mass
absorption coefficient , which is inversely proportional to the
mass of the dust in the disc, remains constant with time.
While in the protoplanetary disc phase we would expect a strong
change of the mass absorption coefficient with time, in the debris disc phase
we expect an equilibrium phase which is characterised by an almost constant
second generation of dust.
The assumption of a roughly time-independent dust opacity seems to be
reasonable as long as we consider discs in the debris phase.
4 SED analysis of debris discs detected at 350 m and/or 1.2 mm
The debris discs detected by our surveys offer the opportunity to
characterise and compare the disc properties around solar type stars.
This is the case for the following objects: HD 104860, HD 8907, HD 377,
HD 107146, HD 61005 and HD 191089.
We compiled the spectral energy distributions from the infrared data
available in the literature and our new detections at sub-millimetre and/or millimetre
wavelengths. Synthetic photometric points at 13 and 33 m, derived from
the IRS spectrum (Hillenbrand et al. Hillenbrandetal2008 (2008)), were also
included in the SEDs. These data points allow us to distinguish the
infrared excess of the debris disc from the stellar photosphere,
determined by a Kurucz model. The IRS spectrum is overplotted in
Figures 2-7, but was not considered during
the SED modelling.
To further characterise the debris discs detected during our survey, we compute:
- the index from their SED to derive the dust grain size present in the disc,
- the collisional and Poynting-Robertson drag timescales
- the blowout grain size ()
- best fit model parameters by modelling the SED.
Index - In the millimetre wavelength range, where , the Planck function can be approximated with the Rayleigh-Jeans relation (). The disc is assumed to be optically thin with the optical depth . Under these conditions . At wavelengths the mass absorption coefficient is , where is the dust opacity index. Since the slope of the SED in the millimetre wavelength range is proportional to , the measure of the spectral index enables us to directly constrain the index via the relation and to derive the index . The index is 2 for interstellar medium grain sizes, between 0 and 2 for pebbles of the order of in size, and 0 for even larger grains (e.g. Beckwith et al. beckwithetal.PPIV (2000)). The slope of the SED in the sub-millimetre/millimetre wavelength range is derived, using a linear regression that gives the errors in slope of the best-fit. The values for the index of the power law of the dust absorption coefficient are always (see Table 3), which suggests the presence of dust with at least millimetre size particles (e.g. Henning & Stognienko HenningStognienko1996 (1996), Rodmann et al. Rodmannetal2006 (2006)).
Blowout grain size - Small grains are affected by the interaction with the stellar radiation field. This causes a force acting on the particles which is parametrized by the ratio of the radiation force to the stellar gravity. We compute the blowout grain size () in the debris disc systems using the equations presented in Hillenbrand et al. (Hillenbrandetal2008 (2008), based on Burns et al. Burnsetal1979 (1979) and Backman & Paresce bp (1993)):
| (2) |
where, is the grain density, the grain albedo (0.1 for silicate grains) and the grain radius. Sub-micron sized particles are therefore blown out from the disc near a Sun-like star.
Poynting-Robertson and collisional timescales -
Defining (Wyatt et
al. Wyattetal1999 (1999)-Wyatt2005 (2005)), where and
are the Poynting-Robertson drag () and collisional
timescales respectively, it is possible to distinguish between discs in collisional
regime () and Poynting-Robertson drag regime ().
When the disc is dense and the collisions occur faster than the P-R drag:
the dynamically bound dust remains at the same radial location as
the planetesimals, while unbound grains are blown out and their
surface density distribution falls off as (where is
the distance from the star).
The Poynting-Robertson drag () and collisional timescales
() of the debris discs are computed, using the equations
presented in Hillenbrand et al. (Hillenbrandetal2008 (2008), based on
Burns et al. Burnsetal1979 (1979) and Backman & Paresce bp (1993)):
| (3) |
where, is the grain density, the grain albedo (again 0.1 for silicate
grains) and the grain radius.
We assume silicate grains of 10 in size and a grain density of
2.7 at the inner radius of the disc (computed by our model,
see Table 4).
Under the assumption of circular orbits and completely destructive
collisions between grains of the same size, the collisional timescale
is computed using the equation:
| (4) |
where is the face-on fractional surface density: for a constant surface density,
, with the
inner disc boundary, the outer disc radius and (e.g.,
Backman Backman2004 (2004)).
The collisional timescale has been computed for grains of 10 m in size. According to Wyatt (Wyatt2005 (2005)), the ratio is proportional to , where is the grain size.
These values are summarised in Table 3.
| HD 104860 | HD 8907 | HD 377 | HD 107146 | HD 61005 | HD 191089 | |
|---|---|---|---|---|---|---|
| 0.64 | 0.81 | 0.54 | 0.49 | 0.34 | 1.14 | |
| 0.39 | 0.5 | 0.03 | 0.08 | 9.85 | 1.86 | |
| tcoll [Myr] | 0.007 | 0.007 | 0.003 | 0.002 | 0.009 | 0.005 |
| 0.50.7 | -0.11.3 | – | 0.40.2 | – | – |
| HD 104860 | HD 8907 | HD 377 | HD 107146 | HD 61005 | HD 191089 | |
|---|---|---|---|---|---|---|
| /M⊕ | 0.0820.007 | 0.0400.005 | 0.0580.013 | 0.1100.008 | 0.2610.023 | 0.1100.037 |
| [AU] | 215 | 27.813.9 | 6.10.8 | 10.20.8 | 95.623 | 7998 |
| [m] | 82 | 62 | 145 | 8.61.2 | 0.40.3 | 0.230.78 |
| 2.6 | 4.3 | 5.0 | 4.5 | 16.3 | 8.7 |
SED modelling -
The SEDs were modelled using the radiative transfer model of
Wolf & Hillenbrand (WolfHillenbrand2003 (2003)).
The model assumes that the dust grains are compact spherical particles
heated only by the direct stellar radiation.
The interaction between stellar radiation and dust particles can be
described by the following radiative processes: scattering (neglecting
multiple scattering), absorption and re-emission of stellar radiation
by dust grains.
The disc is then checked to be optically thin to the stellar
radiation and to the dust re-emission at all wavelengths.
The contribution to the SED from a single dust
grain results from the integration of the scattering and re-emission
processes over all wavelengths. Finally the emergent spectrum is the
sum of all the dust grain contributions.
The model parameters are the radiation emitted by the central star, the
total disc mass, the disc size, the radial density distribution, the
minimum and maximum grain size in the disc, the grain size distribution,
and the chemical composition of the grains.
The radial density distribution is described by a power-law,
where corresponds to a disc with a constant surface density
. The grain size distribution is also described by a power-law
where the canonical value characterises a size distribution
initially produced by a collisional cascade. We always use this
grain size distribution in our models.
For each grain size a temperature distribution over the disc
size is computed.
The model parameter space has been extensively analysed by
Wolf & Hillenbrand (WolfHillenbrand2003 (2003)). They found that the
increase of the inner radius causes a loss of the warm dust that
is mainly responsible for the near-infrared (NIR)/ mid-infrared (MIR) shape of
the SED; the excess emission over the stellar photosphere starts at longer
wavelengths.
This is more pronounced when the minimum grain size amin
increases, because the main contribution to the NIR/MIR spectrum
at high temperatures comes from small grains. The presence of an inner gap
causes the loss of warm dust which is mainly responsible for the NIR/MIR
shape of the SED. Increasing the size of the gap, the MIR flux decreases
and the excess is shifted to longer wavelengths. Keeping the disc mass
constant, the flux in the millimetre region increases slightly, but
the net flux is smaller compared to a disc without an inner gap.
This is because the fraction of the stellar flux absorbed by a single
dust grain decreases with increasing radial distance from the
star.
We assumed astronomical silicate
grains (optical data from Draine & Lee DraineLee1984 (1984) and
Weingartner & Draine WeingartnerDraine2001 (2001)) since they are expected
to be the main component of the dust in protoplanetary discs (Pollack et al. Pollacketal1994 (1994)).
Since the outer radius cannot be constrained from the SED alone, it was assumed
to be 150 AU, consistent with the location of the most distant object of the
Kuiper belt in our Solar System (e.g. Gladman et al. Gladmanetal2002 (2002)).
The choice of such a value is supported by a recent resolved millimetre map of one of the debris
discs analysed (Corder et al. Corderetal2008 (2009)), where the
millimetre emission is extended up to 150 AU from the central star.
The maximum grains size is assumed to be 3 mm, since the
index measurements suggested the presence of at least
millimetre-sized particles in the discs; this is the grain size
which strongly contributes to the millimetre emission that we detect.
The Levenberg-Marquardt method was applied to find the best-fit parameters
of the model leaving the inner radius (), minimum grain
size () and dust mass () as free parameters.
The reduced , associated with each best-fit model, was computed
for each fit normalising the standard statistic to the number of
free parameters of the fit (Bevington bevington (1969)). These parameter uncertainties
are estimated from the covariance matrix (inverse of the
curvature function) by the Levenberg-Marquardt algorithm. The modelling results are listed in Table 4.
The degeneracy of the SED models was checked using the -confidence regions delineated by lines of constant .
The model parameter space (xx) was explored around the best fit values.
The 2-dimensional confidence regions in Figs. 2-7
are the projections of the 3-dimensional isosurfaces defined by
fixed (e.g. Press et al. Pressetal (1992)).
The shape of the confidence regions confirm an intrinsic degeneracy
of our model probably between inner radius, minimum grain size and
dust mass.
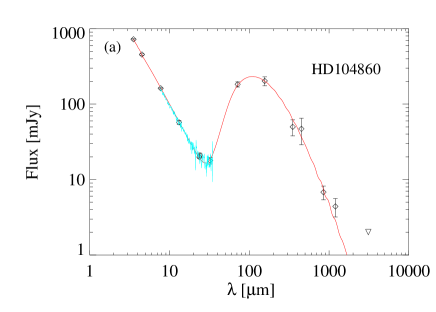


4.1 HD 104860
HD 104860 is an F8 star at a distance of 47 pc from the Sun.
It was classified as a Doradus variable candidate by
Handler (Handler1999 (1999)). Wichmann et al. (Wichmannetal2003 (2003))
identified the object as a young zero age main sequence star using LiI
in absorption (Wichmann et al. Wichmannetal2003 (2003)).
In Table 2 we summarise the ages derived from different
methods (L. Hillenbrand, private communication). The average age is 140 Myr,
the value that we adopted in our analysis.
The SED of HD 104860 is presented in Fig. 2. Infrared-excess
emission has been detected by Spitzer, suggesting the presence of debris
material around this main sequence star (Carpenter et al. Carpenteretal2008 (2008)).
Early modelling of the spectral energy distribution of HD 104860 was
presented by Najita & Williams (Najita&Williams2005 (2005)). Treating dust
grains as simple blackbody radiators, their sub-millimetre observations
at 450 and 850 m indicate a dust temperature of =33 K and a mass
of the disc of 0.16 M⊕.
Our new detection allows us to sample the SED at longer wavelengths and
hence constrain the slope of the far-infrared to millimetre excess.
The best-fit model parameters are reported in Table 4 and
the computed best-fit model is plotted in Fig. 2. The
confidence regions of the fit (see lower plots in Fig. 2)
show some degree of degeneracy of the model.
The dust mass is constrained between 0.07 M⊕ and 0.15 M⊕,
while the inner radius is located between 10 and 50 AU and the minimum
grain size is between 5 and 15 m.
The dust mass computed by the model (see Table 4) is of the
same order of magnitude as the masses computed using a simple black-body
model (Najita & Williams Najita&Williams2005 (2005)) and Eq. 1.
The minimum grain size obtained is one order of magnitude higher than the
“blowout” grain size of the system.
The confidence regions delineated by constant contours
suggest that a minimum grain size of the same order of magnitude of the
blowout size is a poor fit to the data.
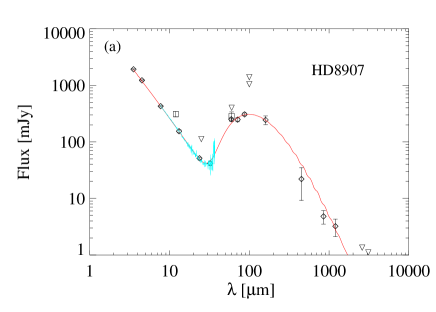
4.2 HD 8907
HD 8907 is a F8 star, located at 34 pc from the Sun, which has already reached the main sequence.
In our analysis we adopt an age of the system of 680 Myr, which is
the average of the ages derived from different methods
(Table 2, L. Hillenbrand, private communication).
The SED of HD 8907 is presented in Fig. 3.
The infrared excess detected by ISO (Zuckerman & Song 2004a )
suggested the presence of debris dust. Under the assumption that the dust
particles radiate as a black body, a temperature of K was inferred
for particles orbiting at 30 AU from the central star
(Zuckerman & Song 2004a ). The SED infrared excess has
also been detected by Spitzer between 3.6 and 70 m by
Kim et al. (kimetal2005 (2005)),
and they found an inner radius of 48 AU with a
temperature of K.
Our new detection allows us to sample the SED at longer wavelengths
and hence constrain the slope of the far-infrared to millimetre excess.
The best-fit model parameters are reported in Table 4 and the
computed best-fit model is plotted in Fig. 3. The confidence
regions of the fit which show some degree of degeneracy of the model
(see lower plots in Fig. 3): the dust mass is constrained
between 0.03 M⊕ and 0.1 M⊕, while the inner radius is
located between 15 and 30 AU and the minimum grain size is between 5
and 10 m.
As in the case of HD 104860, the dust mass computed by the model of
HD 8907 (see Table 4) is comparable to the value computed
using Eq. 1. The minimum grain size is between 4 and 8 m.
This is one order of magnitude higher than the “blowout” grain size of
the system and is consistent with previous modelling
(Kim et al. kimetal2005 (2005)). The inner radius computed by our model
is poorly constrained since it has an uncertainty of 50%.
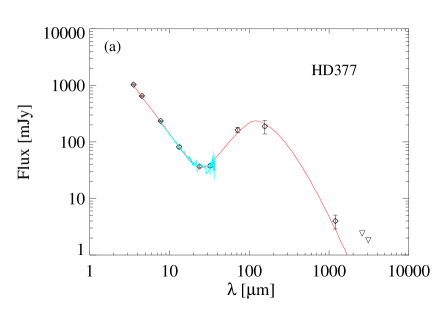
4.3 HD 377
HD 377 is a G2V star at a distance of 40 pc which has already reached the
main sequence. It is surrounded by a debris disc with a high
fractional luminosity (), 4.010-4
(Moór et al. (2006)).
The ages of HD 377 derived from different methods (L. Hillenbrand, private
communication) are summarised in Table 2. The average age is 110 Myr,
the value that we adopted in our analysis.
Pascucci et al. (pascucci2006 (2006)) investigated the presence of gas in the disc of
HD 377, but they did not detect any gas emission lines in the infrared
nor in the millimetre wavelength range.
The SED was compiled from the literature including our new detection at
1.2 mm (Fig. 4). The best-fit model parameters are reported in
Table 4 and the computed best-fit model is plotted in
Fig. 4.
The confidence regions of the fit (see lower plots in Fig. 4)
show a high degree of degeneracy of the model compared to the other debris
discs modelled. This results from the poor constraints on the SED in the
sub-millimetre region.
As for HD 104860 and HD 8907, the dust mass computed by the model (see
Table 4) is comparable to the value computed using Eq. 1.
The inner radius is the smallest in our sample, but the disc seems to lack
small dust grains with sizes up to 14 m. The minimum grain size
obtained is one order of magnitude higher than the blowout grain size
of the system.
4.4 HD 107146
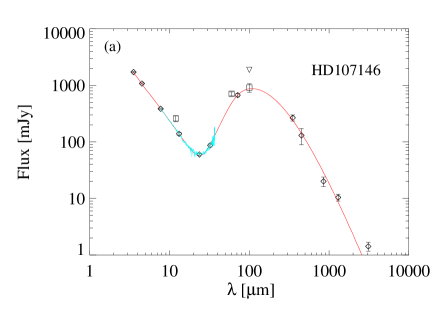
HD 107146 is a G2 V star located 28.5 pc from the Sun. The star is a candidate periodic V-band photometric variable (Koen & Eyer (2002)). From the average between the ages derived with different methods (Table 2), we obtain an age of 230 Myr. HD 107146 is also the first debris disc around a solar-type star resolved in scattered light by the Hubble Space Telescope (Ardila et al. (2004)). They resolved a ring-like disc with most of the material concentrated between 86 and 130 AU, using a coronograph of 1.8″in radius. The disc was also marginally resolved at 450 and 850 m and the observations suggested the presence of an inner hole with a radius larger than 31 AU (Williams et al. (2004)). Such an inner hole would also explain the lack of an IRAS 25 m excess and a far-infrared excess at 60 and 100 m (Silverstone 2000PhDT……..17S (2000)). C05 presented OVRO 3 mm images of this source. HD 107146 has also been resolved during our survey at 350 m with CSO and at 1.3 mm with CARMA (Corder et al. Corderetal2008 (2009)). The millimetre image shows a clumpy disc extended between 60 AU and 150 AU with a symmetric peak of the emission at 97 AU from the central star. The SED was compiled from the literature, including our new detection at 350 m (Fig. 5). HD 107146 is the only disc detected at 3.1 mm. The best-fit model parameters are reported in Table 4 and the computed best-fit model is plotted in Fig. 5. The degree of degeneracy of the model is shown in the confidence regions of the fit (see lower plots in Fig. 5). The dust mass is constrained between 0.08 M⊕ and 0.15 M⊕, while the inner radius is located between 7 and 15 AU and the minimum grain size is between 8 and 15 m. It is interesting to notice that the inner radius computed by our model, is more than 7 times smaller than the inner radius of the ring-like disc in the HST images. This is because different grain populations are traced by our model and the HST image: while the HST traces only the distribution of the sub-micron size population (below ), our model includes the re-emission from grains from micron to millimetre in size. This explanation is also supported by the resolved images in the sub-millimeter wavelength range of HD 107146 which suggest the presence of grains at radii smaller compared to the ring-like structure seen in the HST image.
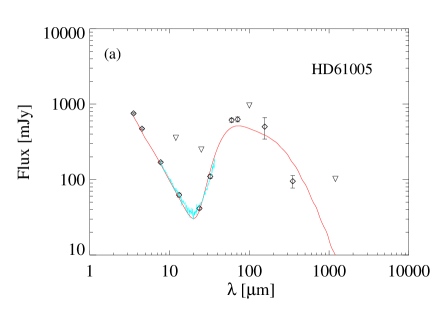
4.5 HD 61005
HD 61005 is a G3/G5V star with a Hipparcos distance of 351 pc,
located in the local bubble, a region that is thought to be almost
completely free of diffuse dust clouds (Franco et
al. francoetal1990 (1990)).
From an average of the chromospheric activity available from the
literature, and a new calibration of the chromospheric activity-age
relation (FEPS, private communication), we adopt an age of 135 Myr.
The SED was previously modelled by Hines et al. (hinesetal2007 (2007)):
under the assumption that dust particles of 10 m radiate as
a black body with a temperature of 50-70 K, they obtained a minimum
distance for the circumstellar material of 7 AU. This star was also
monitored during a radial velocity survey looking for planets around active
stars, but no planets were detected (Setiawan et
al. setiawanetal2007 (2008)).
HST/NICMOS observations (Hines et al. hinesetal2007 (2007)) reveal
dust-scattered starlight extending to distances of 240 AU from
the occulted star. The structure is strongly asymmetric about its major
axis, but is mirror-symmetric about its minor axis; morphologically, the
object resembles a wing-spread moth with the star as the head.
HST scattered light images reveal a swept shape of the disc with
an inner radius 10 AU and an outer radius up to 240 AU (Hines
et al. hinesetal2007 (2007)). Such emission is thought to be associated
to the local interstellar medium that scatters the stellar light, so that the
movement of HD 61005 through the medium causes the swept shape of the
disc (Hines et al. hinesetal2007 (2007)). These observations give
a complementary picture of the circumstellar material present in
the disc since different grain populations are traced in our model
and in the scattered light images.
The SED was compiled from the literature including our new detection at
350 m (Fig. 6).
The best-fit model parameters are reported in
Table 4 and the computed best-fit model is plotted in
Fig. 6. The confidence regions of the fit (see lower plots in
Fig. 6) show that the best fit parameters represent only a local
minimum of the model parameters space. This is probably due to the fact that
the model assumptions are not valid in this case. As suggested from the HST
images, the object seems to be located in the local interstellar medium
material, which probably introduces an additional small grain population
which contributes to the scattered light in the SED. Our model assumes
that all the detected flux is stellar light scattered and/or absorbed and re-emitted
only by the dust particles in the disc.
4.6 HD 191089
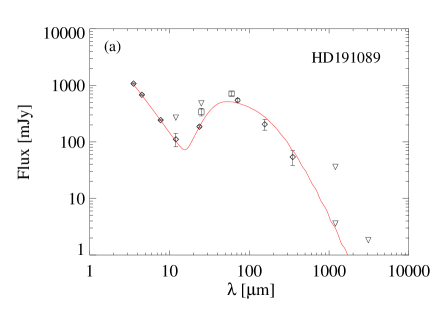
HD 191089 is an F5V star with an Hipparcos distance of 543 pc from the Sun. This star was selected for the FEPS program because it was known to have a debris disc based on ISO and IRAS measurements and it was not considered in our statistical analysis presented in section 3. An upper limit of the age (3 Gyr) for the system was presented by Nordström et al. (Nordstrometal2004 (2004)), using main-sequence isochrones. We adopt an age of 300 Myr (Hillenbrand et al. Hillenbrandetal2008 (2008)). The SED compiled from the literature and the Spitzer spectro-photometry (Carpenter et al. 2008) is presented in Fig. 7. The best-fit model parameters are reported in Table 4 and the computed best-fit model is plotted in Fig. 7. The confidence regions of the fit show some degree of degeneracy of the model (see lower plots in Fig. 7). We note that the model result is not significant at all. This is due to the few data points which constrain the SED.
4.7 Modelling discussion
Comparing the collisional timescale to the Poynting-Robertson timescale, we
conclude that all the detected debris disc are systems in the collision
dominated regime.
The SED of the debris discs has been modelled leaving 3 parameters simultaneously
free: inner radius, dust mass and minimum grain size.
We notice that the slope of the SEDs seems to change from the
sub-millimetre to the millimetre wavelength range, but is well reproduced by our models
within the errors.
Including grains larger than 3 mm in the model would decrease the steepness
of the slope in the sub-millimetre, but would not reproduce at the same time the
sub-millimetre and millimetre fluxes.
A degeneracy between the inner radius and minimum grain size
can still exist:
in this case the -contours plots would represent only a local
minimum in the parameter space, instead of the absolute solution.
Only a resolved image of the entire grain population which delineates
the inner radius of the disc will allow to break the degeneracy between
smallest grain size present in the disc and inner radius.
We now discuss how well constrained the fixed model parameters are
(i.e. , , dust composition and size distribution) and in
particular if and how they can alter our conclusions about , and . We are not going to further
discuss the cases of HD 61005 and HD 191089 because our modelling was not
significant at all, nor the case of HD 107146 because the assumption on the outer
radius is supported by millimetre resolved images (Corder et al. Corderetal2008 (2009)).
- The outer radius was assumed to be 150 AU. While in the case of
HD107146 such an assumption is supported by resolved millimetre images,
in the other cases, we need to investigate the robustness of our model
results. While the most distant objects of the Kuiper belt have been
observed up to 150 AU from the Sun (e.g. Gladman et al. Gladmanetal2002 (2002)),
the edge of the Kuiper belt is commonly considered close to the 2:1 resonance
with Neptune at about 50 AU from the Sun (e.g. Trujillo & Brown Trujillo&Brown2001 (2001)).
There is also no reason why all discs would be expected to have the same outer edge. For these
reasons we use five different outer radii (1000, 500, 300, 100
and 50 AU, or 60 AU when the fitting routine was not
able to find any reasonable inner radius smaller than 50 AU), leaving
free the dust mass (), the inner radius () and
the minimum grain size .
The results are summarised in Table 5.
| HD 104860 | ||||||
|---|---|---|---|---|---|---|
| ROUT | 1000 AU | 500 AU | 300 AU | 150 AU | 100 AU | 50 AU |
| /M⊕ | 5.8430.652 | 2.9300.245 | 1.774 0.133 | 0.0820.007 | 0.0530.005 | 0.0390.004 |
| [AU] | 185 23 | 20.37.8 | 207 | 215 | 222 | 303 |
| [m] | 0.070.03 | 4.50.9 | 62 | 85 | 112 | 214 |
| 6.1 | 7.0 | 4.1 | 2.6 | 2.7 | 3.0 | |
| HD 8907 | ||||||
| ROUT | 1000 AU | 500 AU | 300 AU | 150 AU | 100 AU | 60 AU |
| /M⊕ | 3.097184 | 1.6140.099 | 0.9310.050 | 0.0400.005 | 0.0240.002 | 0.0170.003 |
| [AU] | 8914 | 2914 | 19.45.4 | 2717 | 277 | 4115 |
| [m] | 0.50.08 | 3.10.8 | 5.61.1 | 62 | 82 | 7.72.6 |
| 22.8 | 17.8 | 9.2 | 4.3 | 3.6 | 3.5 | |
| HD 377 | ||||||
| ROUT | 1000 AU | 500 AU | 300 AU | 150 AU | 100 AU | 60 AU |
| /M⊕ | 3.6550.507 | 2.6490.322 | 1.339 0.367 | 0.0580.013 | 0.0340.006 | 0.0390.012 |
| [AU] | 7012 | 4.61.1 | 4.60.65 | 6.10.8 | 388 | 518 |
| [m] | 0.020.001 | 6.51.5 | 9.13.5 | 145 | 144 | 3820 |
| 8.6 | 7.7 | 4.6 | 5.0 | 395. | 395. | |
We notice that, in the case of HD104860 and HD 8907, changing the
outer radius from 500 to 50 AU affects only the dust mass.
In the case of HD 377 fixing the outer radius to 100 and 50 AU
the model fitting is no longer satisfactory, while we find a better result
increasing the outer radius up to 500 AU (see different in
Table 5). The minimum grain size remains at least one order of
magnitude bigger than the blowout size, despite the case of an outer
radius of 1000 AU where it becomes of the same order of magnitude or
smaller than the blowout size.
- The maximum grain size has been fixed to 3 mm; despite the fact that a
collisional cascade generates a distribution of grain size which does not
stop at the millimetre size, we include in our model the maximum particle
size which contributes significantly to the emission which we detect
during our observations. We remind the reader that the mass derived
by our model represents the mass of the grains smaller than 3 mm
present in the disc and that increasing the maximum grain size would increase
the disc mass.
- The dust has been assumed to be made up of astronomical silicate;
this is expected to be the main component in protoplanetary discs (Pollack
et al. Pollacketal1994 (1994)). Although a different composition of the dust
can be present in the disc, Spitzer infrared spectroscopic observations do not
allow to constrain the material properties due to the lack of diagnostic features,
caused by large grain sizes (see the IRS spectra overplotted in the SEDs, Fig.2-7).
A different dust composition would change the blow-out size as
well as the minimum grain size present in the disk computed by our model. A detailed
investigation of different dust compositions is beyond the goal of this paper.
- We finally recall that a more realistic grain size distribution can also
affect our modelling results. Departures from the canonical size distribution we
assumed, have been highlighted by collisional evolution studies of spatially resolved
debris disks (e.g. Thébault & Augereau Thebault&Augereau2007 (2007)).
Despite previously discussed degeneracies, the objects HD 104860, HD 8907 and
HD 107146 show the inner part of their discs cleared from small micron-sized
dust grains because of the lack of near/mid-infrared emission (Wolf & Hillenbrand WolfHillenbrand2003 (2003)). These inner holes can be maintained by the presence of a
planet-sized body (Roques et al. Roquesetal1994 (1994)), which avoids the
filling of the central cavity by Poynting-Robertson drag.
5 Summary and conclusions
We have carried out two deep surveys at 350 m and 1.2 mm of circumstellar discs around solar-type stars at ages between 3 Myr and 3 Gyr. These new observations are an order of magnitude more sensitive to dust emission than previous observations of C05. The dust disc masses have been computed from the millimetre emission, where the discs are assumed to be optically thin. A survival analysis of the dust disc masses as a function of time has been carried out of systems older than 20 Myr, including the dust mass upper limits. The spectral energy distributions of the debris discs detected by our sub-millimetre and millimetre surveys have been modelled. We draw the following main conclusions from our work:
-
1.
The Kendall’s tau correlation yields a probability of 76 that the mass of debris discs and their age are correlated. Similarly, the three different two-sample tests gives a probability between 70 and 83 that younger and older debris systems belong to different parent populations in terms of dust mass. Our result on the relation between dust mass and age is limited by the sensitivity of our millimetre survey. Deeper millimetre observations are needed to confirm the evolution of debris material around solar-like stars.
-
2.
The spectral energy distributions of the debris discs detected at 350 m and/or 1.2 mm were modelled. We found a degeneracy in the best fit parameters which will only be broken with high-resolution images which resolve the entire disc. Nevertheless, this approach allows us to identify debris discs with an inner region that has been evacuated from small micron-sized dust grains.
-
3.
In the case of the detected debris discs, the comparison between collision and Poynting-Robertson timescales suggests that the debris discs are collision dominated.
Acknowledgements.
All the authors wish to thank the entire FEPS team for their work. VR thanks A. Sicilia-Aguilar for helpful discussions on the IRAM data reduction, E. Feigelson for his suggestions about the survival analysis, L. Hillenbrand for some details about the stellar ages, S. J. Kim for her suggestions about the FEPS sample, A. Pasquali and A. Martinez-Sansigre for reading the manuscript. SW was supported at the MPIA by the German Research Foundation (DFG) through the Emmy Noether grant WO 857/ 2. JR wishes to thank Jesús Falcón-Barroso for a helpful discussion on how to project 3-d isosurfaces to lower dimensions. MRM thanks support provided through the LAPLACE node of the NASA Astrobiology Institute. Research at the Caltech Submillimeter Observatory is supported by grant AST-0540882 from the National Science Foundation.References
- Andrews & Williams (2005) Andrews, S. M., & Williams, J. P. 2005, ApJ, 631, 1134
- Andrews & Williams (2007) Andrews, S. M., & Williams, J. P. 2007, ApJ, 659, 705
- Ardila et al. (2004) Ardila, D. R., et al. 2004, ApJ, 617, L147
- (4) Backman, D. E., & Paresce, F. 1993, Protostars and Planets III, 1253
- (5) Backman, D. 2004, in ASP Conf. Ser 324, Debris Disks and the Formation of Planets, ed. L. Caroff et al. (San Francisco: ASP), 9
- Beckwith et al. (1990) Beckwith, S. V. W., Sargent, A. I., Chini, R. S., & Güsten, R. 1990, AJ, 99, 924
- (7) Beckwith, S. V. W., Henning, T., & Nakagawa, Y. 2000, “Protostars and Planets IV”, Book - Tucson: University of Arizona Press; eds Mannings, V., Boss, A.P., Russell, S. S., p. 533
- (8) P. R. Bevington, 1969, “Data Reduction and Error Analysis for the Physical Sciences”, McGraw-Hill, New York, ed. 1
- (9) Bottke, W. F., Durda, D. D., Nesvorný, D., Jedicke, R., Morbidelli, A., Vokrouhlický, D., & Levison, H. F. 2005, Icarus, 179, 63
- (10) Brown, B.W.M., Hollander, M., and Korwar, R.M. 1974, Reliability and Biometry ed. F. Proschan and R.J. Serfling (Philadelphia: SIAM), p.327
- (11) Buckley, J., & James, I. 1979, Biometrika, 66, 429
- (12) Burns, J. A., Lamy, P. L., & Soter, S. 1979, Icarus, 40, 1
- (13) Calvet, N., D’Alessio, P., Watson, D. M., Franco-Hernández, R., Furlan, E., Green, J., et al. 2005, ApJ, 630, L185
- (14) Carpenter, J. M., Wolf, S., Schreyer, K., Launhardt, R., & Henning, T. 2005, AJ, 129, 1049
- Carpenter et al. (2006) Carpenter, J. M., Mamajek, E. E., Hillenbrand, L. A., & Meyer, M. R. 2006, ApJ, 651, L49
- (16) Carpenter, J. M., Bouwman, J., Mamajek, E. E., Meyer, M. R., Hillenbrand, L. A., Backman, D. E., Henning, Th., Hines, D. C., Hollenbach, D., Kim, J. S., et al. 2008, arXiv:0810.1003
- Chen et al. (2005) Chen, C. H., Jura, M., Gordon, K. D., & Blaylock, M. 2005, ApJ, 623, 493
- (18) Corder, S. A., Carpenter, J. M., Sargent, A. I., Zauderer B. A., Wright, M. C. H., White, S., Woody, D. P., Teuben, P. et al. 2009, ApJL, 690, 65
- Currie et al. (2007) Currie, T., Kenyon, S. J., Rieke, G., Balog, Z., & Bromley, B. C. 2007, ApJ, 663, L105
- Cutri et al. (2003) Cutri, R. M., et al. 2003, The IRSA 2MASS All-Sky Point Source Catalog, NASA/IPAC Infrared Science Archive. http://irsa.ipac.caltech.edu/applications/Gator/,
- (21) de Zeeuw, P. T., Hoogerwerf, R., de Bruijne, J. H. J., Brown, A. G. A., & Blaauw, A. 1999, AJ, 117, 354
- (22) Dominik, C., & Decin, G. 2003, ApJ, 598, 626
- (23) Decin, G., Dominik, C., Waters, L. B. F. M., & Waelkens, C. 2003, ApJ, 598, 636
- (24) Draine, B. T., & Lee, H. M. 1984, ApJ, 285, 89
- (25) Feigelson, E. D., & Nelson, P. I. 1985, ApJ, 293, 192
- (26) Franco, J., Tenorio-Tagle, G., & Bodenheimer, P. 1990, ApJ, 349, 126
- Ghez et al. (1993) Ghez, A. M., Neugebauer, G., & Matthews, K. 1993, AJ, 106, 2005
- (28) Gladman, B., Holman, M., Grav, T., Kavelaars, J., Nicholson, P., Aksnes, K., & Petit, J.-M. 2002, Icarus, 157, 269
- (29) Habing, H. J., Dominik, C., Jourdain de Muizon, M., Laureijs, R. J., Kessler, M. F., Leech, K., Metcalfe, L., Salama, A., Siebenmorgen, R., Trams, N., Bouchet, P. 2001, A&A, 365, 545
- (30) Haisch, K. E., Jr., Lada, E. A., & Lada, C. J. 2001, ApJ, 553, L153
- (31) Handler, G. 1999, MNRAS, 309, L19
- (32) Hartmann, W. K., Ryder, G., Dones, L., & Grinspoon, D. 2000, Origin of the earth and moon, edited by R.M. Canup and K. Righter and 69 collaborating authors. Tucson: University of Arizona Press., p.493-512, 493
- Helou & Walker (1988) Helou, G., & Walker, D. W. 1988, Infrared astronomical satellite IRAS catalogues and atlases. Volume 7, p.1-265, 7,
- (34) Henning, Th., & Stognienko, R. 1996, A&A, 311, 291
- (35) Henning Th. 2008, Physica Scripta T 130, 014019
- Hillenbrand (2005) Hillenbrand. L.A. 2005, astroph/0511083
- (37) Hillenbrand, L. A., et al. 2008, ApJ, 677, 630
- (38) Hines, D. C., Schneider G., Hollenbach D., Mamajek E.E., Hillenbrand L. A., Metchev S. A., Meyer M. R., Carpenter J. M., Moro-Martı´n A., Silverstone M. D., Kim J. S., Henning T., Bouwman J. & Wolf S. 2007, ApJ, 671, 165
- (39) Isobe, T., Feigelson, E. D., & Nelson, P. I. 1986, ApJ, 306, 490
- Johansen et al. (2007) Johansen, A., Oishi, J. S., Low, M.-M. M., Klahr, H., Henning, T., & Youdin, A. 2007, Nature, 448, 1022
- Kenyon & Hartmann (1995) Kenyon, S. J., & Hartmann, L. 1995, ApJS, 101, 117
- (42) Kenyon, S. J., & Bromley, B. C. 2001, AJ, 121, 538
- (43) Kenyon, S. J., & Bromley, B. C. 2002, AJ, 123, 1757
- (44) Kenyon, S. J., & Bromley, B. C. 2002, ApJ, 577, L35
- (45) Kenyon, S. J., & Bromley, B. C. 2004, AJ, 127, 513
- (46) Kenyon, S. J., & Bromley, B. C. 2004, ApJ, 602, L133
- (47) Kim, J. S., et al. 2005, ApJ, 632, 659
- Koen & Eyer (2002) Koen, C., & Eyer, L. 2002, VizieR Online Data Catalog, 733, 10045
- Lavalley et al. (1992) Lavalley, M., Isobe, T., & Feigelson, E. 1992, Astronomical Data Analysis Software and Systems I, eds. D. M. Worrall, C. Biemesderfer, & J. Barnes (San Francisco: ASP), 245
- (50) Lawson, W. A., Lyo, A.-R., & Muzerolle, J. 2004, MNRAS, 351, L39
- Levison et al. (2007) Levison, H. F., Morbidelli, A., Gomes, R., & Backman, D. 2007, Protostars and Planets V, 669
- Liu et al. (2004) Liu, M. C., Matthews, B. C., Williams, J. P., & Kalas, P. G. 2004, ApJ, 608, 526
- (53) Löhne, T., Krivov, A. V., & Rodmann, J. 2008, ApJ, 673, 1123
- (54) Mamajek, E. E., Meyer, M. R., Hinz, P. M., Hoffmann, W. F., Cohen, M., & Hora, J. L. 2004, ApJ, 612, 496
- (55) Mamajek, E. E., & Hillenbrand, L. A. 2008, ArXiv e-prints, 807, arXiv:0807.1686
- (56) Meyer, M. R., Hillenbrand, L. A., Backman, D., Beckwith, S., Bouwman, J., Brooke, T., Carpenter, J., Cohen, M., Cortes, S., Crockett, N., et al. 2006, PASP, 118, 1690
- (57) Meyer, M. R., Backman, D. E., Weinberger, A. J., & Wyatt, M. C. 2007, “Protostars and Planets V”, B. Reipurth, D. Jewitt, and K. Keil (eds.), University of Arizona Press, Tucson, 951 pp., 2007., p.573-588
- (58) Meyer, M. R., Carpenter, J. M., Mamajek, E. E., Hillenbrand, L. A., Hollenbach, D., Moro-Martin, A., Kim, J. S., Silverstone, M. D., Najita, J., Hines, D. C. et al. 2008, ApJ, 673, L181
- Moór et al. (2006) Moór, A., Ábrahám, P., Derekas, A., Kiss, C., Kiss, L. L., Apai, D., Grady, C., & Henning, T. 2006, ApJ, 644, 525
- (60) Najita, J., & Williams, J. P. 2005, ApJ, 635, 625
- (61) Natta, A., Testi, L., Neri, R., Shepherd, D. S., & Wilner, D. J. 2004, A&A, 416, 179
- (62) Natta, A., Testi, L., Calvet, N., Henning, T., Waters, R., & Wilner, D. 2007, “Protostars and Planets V”, B. Reipurth, D. Jewitt, and K. Keil (eds.), University of Arizona Press, Tucson, p.767
- (63) Nordström, B., et al. 2004, A&A, 418, 989
- (64) Pan, X., Shao, M., & Kulkarni, S. R. 2004, Nature, 427, 326
- (65) Pascucci, I., Gorti, U., Hollenbach, D., Najita, J., Meyer, M. R., Carpenter, J. M., Hillenbrand, L. A., Herczeg, G. J., Padgett, D. L., Mamajek, E. E. et al. 2006, ApJ, 651, 1177
- (66) Perryman, M. A. C., Lindegren, L., Kovalevsky, J., Hoeg, E., Bastian, U., Bernacca, P. L., Crézé, M., Donati, F., Grenon, M., van Leeuwen, F., et al. 1997, A&A, 323, L49
- (67) Pinsonneault, M. H., Stauffer, J., Soderblom, D. R., King, J. R., & Hanson, R. B. 1998, ApJ, 504, 170
- (68) Pollack, J. B., Hollenbach, D., Beckwith, S., Simonelli, D. P., Roush, T., & Fong, W. 1994, ApJ, 421, 615
- Prato (2007) Prato, L. 2007, ApJ, 657, 338
- Preibisch et al. (1998) Preibisch, T., Guenther, E., Zinnecker, H., Sterzik, M., Frink, S., & Roeser, S. 1998, A&A, 333, 619
- Preibisch et al. (2002) Preibisch, T., Brown, A. G. A., Bridges, T., Guenther, E., & Zinnecker, H. 2002, AJ, 124, 404
- (72) Press, W. H., Flannery, B. P., Teukolsky, S. A., Vetterling, W. T., 1992, “Numerical Recipes in C”, Cambridge University Press, 2nd edition (November 27, 1992), Sect. 15.6
- (73) Rodmann, J., Henning, T., Chandler, C. J., Mundy, L. G., & Wilner, D. J. 2006, A&A, 446, 211
- (74) Roques, F., Scholl, H., Sicardy, B., & Smith, B. A. 1994, Icarus, 108, 37
- (75) Schneider, G., et al. 2006, ApJ, 650, 414
- (76) Schneider, G., et al. 1999, ApJ, 513, L127
- (77) Setiawan, J., et al. 2008, Precision Spectroscopy in Astrophysics, 201
- (78) Silverstone, M. D. 2000, Ph.D. Thesis
- Silverstone et al. (2006) Silverstone, M. D., et al. 2006, ApJ, 639, 1138
- (80) Spangler, C., Sargent, A. I., Silverstone, M. D., Becklin, E. E., & Zuckerman, B. 2001, ApJ, 555, 932
- (81) Soderblom, D. R., et al. 2004, Bulletin of the American Astronomical Society, 36, 735
- Song et al. (2005) Song, I., Zuckerman, B., Weinberger, A. J., & Becklin, E. E. 2005, Nature, 436, 363
- (83) Strom, S. E., Edwards, S., & Skrutskie, M. F. 1993, Protostars and Planets III, 837
- Su et al. (2006) Su, K. Y. L., et al. 2006, ApJ, 653, 675
- (85) Thébault, P., & Augereau, J.-C. 2007, A&A, 472, 169
- (86) Trujillo, C. A., & Brown, M. E. 2001, ApJ, 554, L95
- (87) Weingartner, J. C., & Draine, B. T. 2001, ApJ, 548, 296
- (88) Wichmann, R., Schmitt, J. H. M. M., & Hubrig, S. 2003, A&A, 399, 983
- Williams et al. (2004) Williams, J. P., Najita, J., Liu, M. C., Bottinelli, S., Carpenter, J. M., Hillenbrand, L. A., Meyer, M. R., & Soderblom, D. R. 2004, ApJ, 604, 414
- Williams & Andrews (2006) Williams, J. P., & Andrews, S. M. 2006, ApJ, 653, 1480
- (91) Wolf, S., & Hillenbrand, L. A. 2003, ApJ, 596, 603
- (92) Wright, J. T., Marcy, G. W., Butler, R. P., & Vogt, S. S. 2004, ApJS, 152, 261
- (93) Wyatt, M. C., Dermott, S. F., Telesco, C. M., Fisher, R. S., Grogan, K., Holmes, E. K., & Piña, R. K. 1999, ApJ, 527, 918
- Wyatt et al. (2003) Wyatt, M. C., Dent, W. R. F., & Greaves, J. S. 2003, MNRAS, 342, 876
- (95) Wyatt, M. C. 2005, A&A, 433, 1007
- (96) Wyatt, M. C., Smith, R., Greaves, J. S., Beichman, C. A., Bryden, G., & Lisse, C. M. 2007, ApJ, 658, 569
- (97) Wyatt, M. C., Smith, R., Su, K. Y. L., Rieke, G. H., Greaves, J. S., Beichman, C. A., & Bryden, G. 2007, ApJ, 663, 365
- Zacharias et al. (2004) Zacharias, N., Urban, S. E., Zacharias, M. I., Wycoff, G. L., Hall, D. M., Monet, D. G., & Rafferty, T. J. 2004, AJ, 127, 3043
- (99) Zuckerman, B., & Becklin, E. E. 1993, ApJ, 414, 793
- (100) Zuckerman, B., & Song, I. 2004, ApJ, 603, 738
- (101) Zuckerman, B., & Song, I. 2004, ARA&A, 42, 685
- (102) Zwahlen, N., North, P., Debernardi, Y., Eyer, L., Galland, F., Groenewegen, M. A. T., & Hummel, C. A. 2004, A&A, 425, L45
| Source | Spectral | ) | Distance | Ref. | ||||
|---|---|---|---|---|---|---|---|---|
| Type | [oK] | [mJy] | [mJy] | [pc] | ||||
| FEPS sources older than 10 Myr | ||||||||
| HD~60737 | G0 | 5895 | 0.01 | 8.0 - 8.5 | 4.5 | 382 | (2) | |
| HII1101 | G0V | 5988 | 0.08 | 8.0 - 8.5 | 2.3 | 1334 | (5) | |
| HII152 | G5V | 5823 | 0.10 | 8.0 - 8.5 | 2.7 | 1334 | (5) | |
| HII1200 | F6V | 6217 | 0.35 | 8.0 - 8.5 | 2.3 | 1334 | (5) | |
| HD~90905 | G1V | 6028 | 0.16 | 8.0 - 8.5 | 3 | 321 | (2) | |
| HII514 | — | 5727 | 0.11 | 8.0 - 8.5 | 2.6 | 1334 | (5) | |
| HD~104860 | F8 | 5950 | 0.12 | 8.0 - 8.5 | 50.19.3 | 4.4 1.1 | 482 | (2) |
| HD~377 | G2V | 5852 | 0.09 | 8.0 - 8.5 | 4.0 1.0 | 402 | (2) | |
| HD~61005 | G8V | 5456 | 0.25 | 8.0 - 8.5 | 9512 | 351 | (2) | |
| HD~107146 | G2V | 5859 | 0.04 | 8.0 - 8.5 | 3196 | 291 | (2) | |
| HD~72687 | G5V | 5738 | 0.05 | 8.0 - 8.5 | 54 | 462 | (2) | |
| HII250 | — | 5767 | 0.04 | 8.0 - 8.5 | 3.28 | 1334 | (5) | |
| HD~219498 | G5 | 5671 | 0.69 | 8.5 - 9.0 | 4.8 | 15013 | (3) | |
| HD~61994 | G6V | 5538 | 0.01 | 8.5 - 9.0 | 2.6 | 282 | (2) | |
| HD~145229 | G0 | 5893 | 0.02 | 8.5 - 9.0 | 22.5 | 2.8 | 331 | (2) |
| HD~150706 | G3(V) | 5883 | 0.02 | 8.5 - 9.0 | 3.2 | 271 | (2) | |
| HD~204277 | F8V | 6190 | 0.29 | 8.5 - 9.0 | 2.1 | 341 | (2) | |
| HD~85301 | G5 | 5605 | 0.15 | 8.5 - 9.0 | 17.4 | 2.7 | 321 | (2) |
| HD~69076 | K0V | 5405 | 0.28 | 9.0 - 9.7 | 42 | 2.1 | 341 | (2) |
| HD~205905 | G2V | 5925 | 0.04 | 9.0 - 9.7 | 4.6 | 261 | (2) | |
| HD~201219 | G5 | 5604 | 0.16 | 9.0 - 9.7 | 4.1 | 362 | (2) | |
| HD~206374 | G6.5V | 5580 | 0.17 | 9.0 - 9.7 | 3.9 | 271 | (2) | |
| HD~38529 | G8III/IV | 5361 | 0.82 | 9.0 - 9.7 | 3.2 | 422 | (2) | |
| HD~136923 | G9V | 5343 | 0.29 | 9.0 - 9.7 | 3.2 | 201 | (2) | |
| HD~6963 | G7V | 5517 | 0.26 | 9.0 - 9.7 | 4.2 | 271 | (2) | |
| HD~122652 | F8 | 6157 | 0.18 | 9.0 - 9.7 | 19.5 | 3.2 | 371 | (2) |
| HD~187897 | G5 | 5875 | 0.12 | 9.0 - 9.7 | 2.4 | 331 | (2) | |
| FEPS sources older than 10 Myr not included in the statistical analysis | ||||||||
| HD~134319 | G5(V) | 5660 | 0.14 | 7.5 - 8.0 | 25.2 | 8.5 | 441 | (2) |
| HD~191089 | F5V | 6441 | 0.50 | 8.0 - 8.5 | 5415 | 3.6 | 543 | (2) |
| HD~25457 | F7V | 6172 | 0.32 | 8.0 - 8.5 | 2.2 | 191 | (2) | |
| HD~8907 | F8 | 6250 | 0.32 | 8.5 - 9.0 | 3.20.9 | 341 | (2) | |
| FEPS sources younger than 10 Myr | ||||||||
| [PZ99] J161411.0-230536 | K0 | 4963 | 0.50 | 6.5 - 7.0 | 21.9 | 3.51.1 | 1452 | (1) |
| RXJ1612.6-1859a | K0IV | 5372 | 0.38 | 6.5 - 7.0 | 438.7 | 5.9 1.4 | 1452 | (1) |
| HD~143006 | G6/8 | 5884 | 0.39 | 6.5 - 7.0 | 1400 39 | 1452 | (1) | |
| SCOPMS214 | K0IV | 5318 | 0.26 | 6.5 - 7.0 | 72 | 1452 | (1) | |
| RX J1842.9-3532 | K0IV | 4995 | 0.01 | 6.5 - 7.0 | 65029 | 13010 | (3) | |
| RX J1852.3-3700 | K3 | 4759 | 0.23 | 6.5 - 7.0 | 1200 45 | 13010 | (3) | |
| HD~35850 | F7/8V | 6047 | 0.25 | 7.0 - 7.5 | 3.7 | 271 | (2) | |
| HE848 | F9V | 6309 | 0.47 | 7.5 - 8.0 | 3.1 | 1765 | (4) | |
| HD~77407 | G0(V) | 5986 | 0.08 | 7.5 - 8.0 | 3.45 | 301 | (2) | |
| HD~22179 | G0 | 5986 | 0.36 | 7.5 - 8.0 | 3.3 | 10020 | (3) | |
| HD~12039 | G3/5V | 5688 | 0.05 | 7.5 - 8.0 | 2.7 | 422 | (2) | |
| HD~70573 | G1/2V | 5896 | 0.14 | 7.5 - 8.0 | 2.73 | 4615 | (3) | |
| HE750 | F5 | 6421 | 0.28 | 7.5 - 8.0 | 4.60 | 1765 | (4) | |
| HD~135363 | G5(V) | 4728 | 0.48 | 7.5 - 8.0 | 2.22 | 291 | (2) | |
| Not in the FEPS list | ||||||||
| HD~82943 | 27.9 | |||||||
| HD~38207 | F2V | 6769 | 0.72 | 8.0 - 8.5 | 0.33 | 12725 | (3) | |
| HD~117176 | 14.1 | |||||||
| HD~218738 | 21.9 | 3.3 | ||||||
⋆: The calibration error is between 12 and 22% of the flux. ⋆⋆: The calibration error is between 11 and 16% of the flux. Distance references: 1 de Zeeuw et al. (1999AJ….117..354D (1999)); 2Perryman et al. (Perrymanetal1997 (1997)); 3 Hillenbrand et al (Hillenbrandetal2008 (2008)); 4 Pinsonneault et al. (1998ApJ…504..170P (1998)); 5 based on recent Pleiades distances: de Zeeuw et al. (1999AJ….117..354D (1999)), Zwahlen et al. (2004A&A…425L..45Z (2004)), Soderblom et al. (2004AAS…204.4507S (2004)) and Pan et al. (2004Natur.427..326P (2004)).