A search for massive UCDs in the Centaurus Galaxy Cluster ††thanks: Based on observations obtained in service mode at the VLT (programme 080.B-0307)
Abstract
Context. We recently initiated a search for ultra-compact dwarf galaxies (UCDs) in the Centaurus galaxy cluster (Mieske et al. 2007), resulting in the discovery of 27 compact objects with mag. Our overall survey completeness was 15-20% within kpc projected clustercentric distance.
Aims. In order to better constrain the luminosity distribution of the brightest UCDs in Centaurus, we continue our search by substantially improving our survey completeness specifically in the regime mag ( mag).
Methods. Using VIMOS at the VLT, we obtain low-resolution spectra of 400 compact objects with mag ( mag at the Centaurus distance) in the central 25′ of the Centaurus cluster, which corresponds to a projected radius of 150 kpc. Our survey yields complete area coverage within kpc.
Results. For 94% of the sources included in the masks we successfully measure a redshift. Due to incompleteness in the slit assignment, our final completeness in the area surveyed is 52%. Among our targets we find three new UCDs in the magnitude range mag, hence at the faint limit of our survey. One of them is covered by archival HST WFPC2 imaging, yielding a size estimate of 8-9 pc. At 95% confidence we can reject the hypothesis that in the area surveyed there are more than 2 massive UCDs with mag and 70 pc. Our survey hence confirms the extreme rareness of massive UCDs. We find that the radial distributions of Centaurus and Fornax UCDs with respect to their host clusters’ centers agree within the 2 level.
Key Words.:
galaxies: clusters: individual: Centaurus – galaxies: dwarf – galaxies: fundamental parameters – galaxies: nuclei – galaxies: star clusters1 Introduction
A new class of compact stellar systems called ’ultra-compact dwarf galaxies’ (UCDs; Phillipps et al. Philli01 (2001)) has been established during the last decade (Hilker et al. Hilker99 (1999); Drinkwater et al. Drinkw00 (2000), Drinkw03 (2003); Hasegan et al. Hasega05 (2005); Jones et al. Jones06 (2006); Mieske et al. Mieske07 (2007); Firth et al. Firth07 (2007); Misgeld et al. Misgel08 (2008)). UCDs are characterised by typical luminosities of mag, half-light radii of pc and masses of . An intriguing finding from recent studies is that on average, the dynamical M/L ratios of UCDs are about twice as large as those of Galactic globular clusters of comparable metallicity (e.g. Hasegan et al. Hasega05 (2005); Hilker et al. Hilker07 (2007); Evstigneeva et al. Evstig07 (2007); Rejkuba et al. Rejkub07 (2007); Mieske et al. 2008a ). Indications exist that M/L ratios may be somewhat higher for UCDs in Virgo than in Fornax (e.g. Hasegan et al. Hasega05 (2005); Hilker et al. Hilker07 (2007); Evstigneeva et al. Evstig07 (2007)), which could be explained by differences in age, stellar mass function, or, dark matter content.
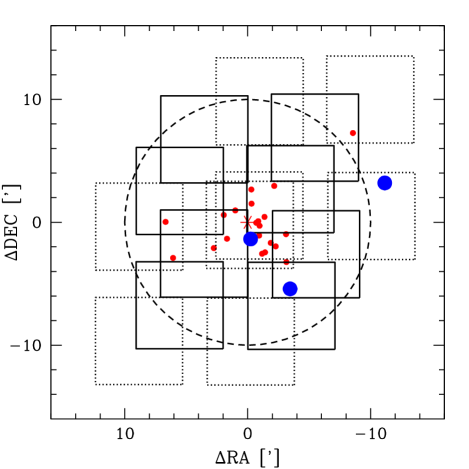
In our efforts to broaden the environmental baseline of UCD research, we have embarked on UCD searches in the Centaurus galaxy cluster (Mieske et al. Mieske07 (2007)) and the Hydra I galaxy cluster (Misgeld et al. Misgel08 (2008)), based on data obtained with VIMOS at the VLT (program 076.B-0293). From the UCD search in Centaurus, we found 27 compact objects with radial velocities consistent with them being members of Centaurus, covering an absolute magnitude range 12.2 MV 10.9 mag. Their distribution in magnitude and space was found to be consistent with that of the GC population. We did not find very luminous UCDs with mag as found in the Virgo and Fornax cluster (Jones et al. Jones06 (2006), Chilingarian & Mamon Chilin08 (2008), Drinkwater et al. Drinkw00 (2000)), which may be due to the moderate overall completeness of 15-20% within 120 kpc: the survey covered about 50-60% of the total area within 120 kpc, within which only 30% of photometrically selected sources were observed, due to too high candidate density (see Mieske et al. Mieske07 (2007) and Fig. 2).
In this Research Note, we report on the second part of our search for UCDs in Centaurus with VIMOS (program 380.B-0207), with the aim to better constrain their luminosity distribution at the bright end. We increase the area coverage and focus on the bright luminosity regime mag. Our medium-term strategy is to derive dynamical mass estimates for UCDs beyond the Fornax and Virgo clusters to investigate in depth whether average M/L ratios of UCDs systematically vary with environment. Technically, ground-based medium-to-high resolution spectroscopy (R10000) is only possible for objects with 21.5 mag (e.g. Mieske et al. 2008a , Chilingarian et al. Chilin08 (2008)), which translates to a feasibility limit of mag at the distance of the Centaurus cluster ((m-M)33.3 mag, Mieske et al. Mieske05 (2005)). This is another driver for focusing on the bright luminosity regime mag.
2 The data
The data for this publication were obtained in service mode with the VIsible MultiObject Spectrograph VIMOS (Le Fevre et al. Lefevr03 (2003)) mounted on UT3 Melipal at the VLT (programme 380.B-0207). VIMOS allows simultaneous observing of 4 quadrants, each of dimension , and separated by about 2′. We observed four multi-object spectroscopy (MOS) pointings close to NGC 4696, the central galaxy of the main cluster component Cen30 (see Fig. 2). Two of those pointings had been targeted already as part of our previous observing program in Period 76 (Mieske et al. Mieske07 (2007)). However, given the slit allocation completeness of about 30% in that run, we re-observed these pointings. We observed two further pointings slightly offset, with the aim to fill the chip gaps, increasing the area coverage within 120 kpc to almost 100% (see Figs. 2 and 3). Within the four pointings, a slit could be allocated for 54% of the photometrically selected objects (see Sect. 2.2).
2.1 Candidate selection
The candidates for our search for bright UCDs were selected from the VIMOS pre-imaging in the and filters which were taken under clear conditions. Prior to applying any selection, we matched the detections in V,R to the catalog of well calibrated FORS photometry (Mieske et al. Mieske05 (2005)) of the central Centaurus cluster in V and I, whose areas overlap with the VIMOS pre-imaging. From this matching we were able to verify that the V-band VIMOS zeropoints available from the ESO QC web pages111http://www.eso.org/observing/dfo/quality/index_vimos.html for the date of the pre-imaging (17-01-2008) were accurate to within 0.03-0.05 mag.
For de-reddening the apparent magnitudes we used Schlegel et al. (Schleg98 (1998)). To select sources as compact object candidates, we defined three criteria regarding size, colour and luminosity.
1. Be unresolved on the VIMOS pre-imaging (as judged by SExtractor star-galaxy separator, Bertin & Arnouts Bertin96 (1996)). At the distance of the Centaurus cluster (45 Mpc, Mieske et al. Mieske05 (2005)), the typical PSF FWHM of 0.85′′ corresponds to 190pc. In Fig. 1 we show that the limit up to which SExtractor classifies a source as unresolved corresponds to 70 pc at the Centaurus cluster distance. Our size selection criterion hence encompasses all known UCDs except the two most massive ones, each of which have 100 pc (Evstigneeva et al. 2008). This corresponds to 95% of all known UCDs, and 85% of known UCDs with mag. 222A complementary observing campaign targeting canonical dwarf galaxies – including resolved UCD candidates – in Centaurus has been approved for ESO observing period P83.
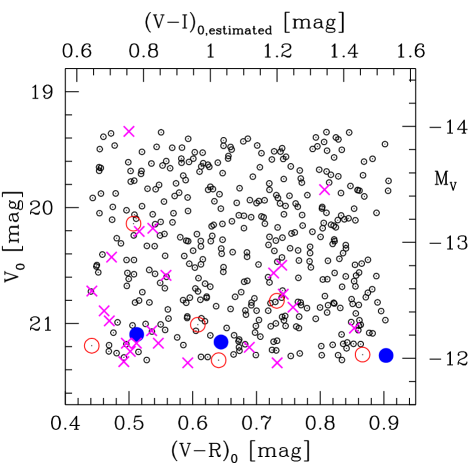
2. Have de-reddened colours mag. This (V-R)0 range corresponds to a (V-I)0 range of 0.65 to 1.50 mag (see Fig. 3), which is the colour range typically covered by GCs (e.g. Gebhardt & Kissler-Patig Gebhar99 (1999), Larsen et al. Larsen01 (2001), Kundu & Whitmore Kundu01 (2001)). This also covers the colour range of UCDs discovered in the first part of our search (Mieske et al. Mieske07 (2007)). Fig. 3 shows the directly measured (V-R)0 colours, and the corresponding (V-I)0 scale. This scale is derived from matching the V,R pre-imaging photometry of unresolved sources with V,I photometry from spatially overlapping FORS data (see above; Mieske et al. Mieske05 (2005)). The derived scaling in apparent magnitude space is
| (1) |
with an rms of 0.11 mag.
3. Have de-reddened apparent magnitudes mag ( mag). The faint magnitude cut is more than a magnitude brighter than in the first part of our search (Mieske et al. Mieske07 (2007)).
2.2 Spectroscopic observations
Within our 16 masks (4 pointings 4 quadrants) the VIMOS mask creation software VMMPS enabled the allocation of slits for 412 objects (minimum slit length 6′′), compared to a total of 766 photometrically selected sources. We were able to measure redshifts for 389 out of those 412 sources. Our completeness in the entire area surveyed is hence 51% (Fig. 4), about three times higher than in the previous part of our survey (Mieske et al. Mieske07 (2007)). Within the central 120 kpc, the completeness is 52%, only marginally higher.
We used the medium resolution MR grism with the order sorting filter GG475. This covers the wavelength range from 4800 to 10000 Å at a dispersion of 2.5 Å per pixel. The average seeing for the spectroscopic observations was around 0.8′′, at a slit width of 1.0′′. With a pixel scale of 0.2′′, the instrumental resolution (FWHM) is 10-12 Å, corresponding to a velocity resolution of 600 km/s. For each pointing the total exposure time was 2100 seconds. Arc-lamp exposures for wavelength calibration were attached to each science exposure.
2.3 Data reduction
For the data reduction from 2D raw spectra to wavelength calibrated 1D spectra we used the recipe vmmosobsstare provided by the ESO VIMOS pipeline333http://www.eso.org/projects/dfs/dfs-shared/web/vimos/vimos-pipe-recipes.html. This recipe performs bias subtraction, flat field division, wavelength calibration, and spectrum extraction. Fig. 5 shows four examples of calibrated 1D spectra.
The radial velocity measurements of the calibrated 1D spectra were performed via cross-correlation using the IRAF task fxcor (Tonry & Davis Tonry79 (1979)) in the RV package. As template for cross-correlation we used a synthetic spectrum created to resemble a typical early-type galaxy (Quintana et al. Quinta96 (1996)). This template has proven most reliable for such kind of radial velocity surveys (e.g. Mieske et al. 2004a , Misgeld et al. Misgel08 (2008)). For a measurement to be accepted as reliable, we demanded the cross-correlation confidence value to be larger than 5.5. We then re-run fxcor for those spectra for which was achieved in the first run, and accepted measurements for those that showed clearly identifiable cross-correlation peaks, see Fig. 5 for an example. For more than 90% of our observed sources we could reliably measure a redshift (see Fig. 3). The radial velocity measurement errors were of the order 50-100 km/s. As a cluster membership criterion we required km/s, excluding both foreground stars and background galaxies.


3 Results
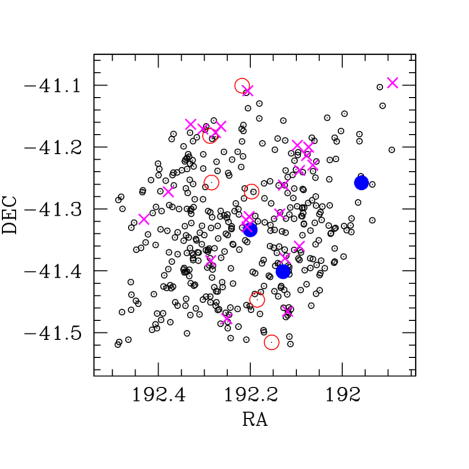
Fig. 6 shows a radial velocity histogram of the 389 sources with measured redshifts. Of these 389 sources, 380 are foreground stars, and six objects are background galaxies with km/s444The list of foreground stars and background galaxies including their coordinates is available upon request from smieske@eso.org. Only three objects are members of the Centaurus cluster. At the cluster’s distance modulus ((m-M)=33.3 mag, Mieske et al. 2005), they cover the magnitude range (Fig. 3), at the faint limit of our survey. Table 1 shows the properties of these three confirmed UCDs. We list their and magnitudes, their radial velocities and errors, and the confidence level of the radial velocity measurement. Also given is the estimated colour, as derived from equation 1. For one of the UCDs, CCOS J192.200-41.334, archival HST imaging in the F555W filter (WFPC2, Proposal 5956, PI Sparks) is available. To measure its size, we use the program KINGPHOT (Jordán et al. Jordan04 (2004) and Jordan05 (2005)), which was already successfully applied to measure half-light radii of GCs in Virgo and Fornax, and UCDs in Centaurus (Jordán et al. Jordan05 (2005) and Jordan07 (2007), Mieske et al. Mieske07 (2007)). From this fit, we derive a 2 upper limit of the projected half-light radius of 0.43 WFPC2 wide-field pixel, corresponding to 8-9 pc at the assumed distance modulus of 33.3 mag.
Note that we have not discovered a UCD in the bright luminosity regime , within which also only very few UCDs are found in Fornax and Virgo. This confirms the rareness of these extreme objects. Given our overall survey completeness of 50% and assuming a Poisson distribution for UCD number counts, we can exclude at 95% confidence the existence of more than two UCDs with mag and pc, within 120 kpc of NGC 4696.
In spite of the lack of such very bright UCDs, there is now a total of eight confirmed UCDs with mag in Centaurus (this paper, Mieske et al. Mieske07 (2007)), comparable to the numbers in Virgo/Fornax (Jones et al. Jones06 (2006), Firth et al. Firth07 (2007)). Seven of those eight sources belong to the main cluster Cen30. Given our completeness of 50% within the central 120 kpc of Cen30, we can constrain the true number of UCDs with mag in that area to 14 5. How does this compare to the number of GCs expected from extrapolating a Gaussian globular cluster luminosity function to mag? For the central Cen30 galaxy NGC 4696, we would expect a total of 14000 GCs, adopting a specific frequency of 7.3 (Mieske et al. Mieske05 (2005)) and an absolute magnitude of mag (Misgeld et al. Misgel09 (2009)) for NGC 4696. Since we observe within a radius of 120 kpc, we assume that we include most of the GC systems (e.g., Rhode & Zepf Rhode01 (2001) show the GC system of NGC 4472, the most luminous early-type galaxy in Virgo, extends to 80 kpc). Adopting an absolute turnover magnitude of mag (Kundu & Whitmore Kundu01 (2001)) and a GCLF width of 1.35 mag (Jordán et al. Jordan06 (2006), Jordan07 (2007)), the expected number of GCs with mag is about 5. Although being on the low side, this is still within 2 of the estimated number of UCDs. Note that only for mag the expected number of GCs drops below 0.5. From a purely statistical point of view, only the very brightest UCD luminosities ( mag) are thus unaccounted for by a Gaussian GCLF.
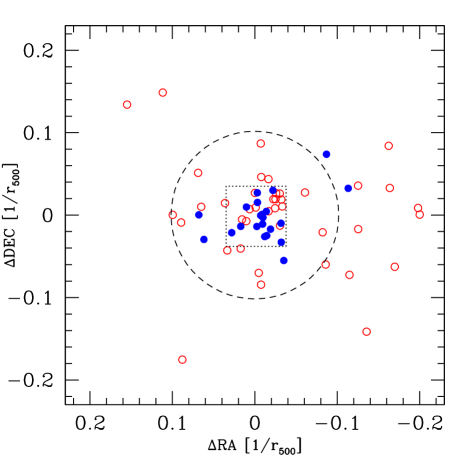
With the database of Centaurus UCDs at hand, it is worthwhile to compare their spatial distribution to those in Fornax. In Fig. 7 we show the projected distance of these two UCD populations (with UCDs defined as compact stellar systems with mag) relative to the central galaxies of Centaurus and Fornax. The Fornax UCD database is the same as used in Mieske et al. (2008b ). The distances are normalised to the r500 radii of either cluster, for which Reiprich & Boehringer (Reipri02 (2002)) give r500=840 kpc for Fornax, and r500=1.14 Mpc for Centaurus. Within the radius of 120 kpc surveyed for this publication, the Centaurus UCD population is slightly more clustered than the Fornax UCD population, at the 96.5% confidence level according to a KS-test. However, this may at least partially be due to the fact that all Centaurus UCDs with mag were discovered in our P76 survey, which had a more complete area coverage for kpc than for kpc (see Fig. 2). When restricting to kpc in Centaurus and the corresponding kpc Fornax, the cumulative radial distribution of both samples is indistinguishable. When considering only UCDs with mag – for which the spatial survey coverage is comparable between Fornax and Centaurus – we also find indistinguishable distributions according to a KS-test. We can therefore state that within 2, Fornax and Centaurus UCDs have the same radial distribution, when scaled to the respective radius of their host clusters.
There are a number of ongoing investigations of the UCD luminosity function towards very bright luminosities ( mag) in a range of environments, (e.g. the present work, Wehner & Harris Wehner08 (2008), Misgeld et al. Misgel08 (2008)). It will be interesting to investigate how the luminosities/masses of the most massive UCDs correlate with the properties of their host environments (Hilker et al. 2009, in preparation), as previously studied in an analogous fashion for globular cluster systems (Whitmore Whitmo03 (2003), Larsen Larsen02 (2002)) and systems of young massive clusters (e.g. Weidner et al. Weidne04 (2004)).
References
- (1) Bertin E., Arnouts S., 1996, A&AS 117, 393
- (2) Chilingarian, I., & Mamon, G. 2008, MNRAS, 385L, 83
- (3) Drinkwater M.J., Jones J.B., Gregg M.D., Phillipps S., 2000, PASA 17, 227
- (4) Drinkwater, M.J., Gregg, M.D., Hilker, M. et al., 2003, Nature, 423, 519
- (5) Evstigneeva, E. A., Gregg, M. D., Drinkwater, M. J., & Hilker, M. 2007, AJ, 133, 1722
- (6) Fellhauer, M., & Kroupa, P., 2002, MNRAS, 330, 642
- (7) Fellhauer, M., & Kroupa, P. 2005, MNRAS, 359, 223
- (8) Firth, P., Drinkwater, M. J., Evstigneeva, E. A., Gregg, M. D., Karick, A. M., Jones, J. B., & Phillipps, S. 2007, MNRAS, 382, 1342
- (9) Gebhardt, K. & Kissler-Patig, M. 1999, AJ, 118, 1526
- (10) Haşegan, M., Jordán, A., Côté, P. et al. (VCS team) 2005, ApJ, 627, 203
- (11) Hilker, M., Infante, L., Vieira, G., Kissler-Patig, M., & Richtler, T. 1999, A&AS, 134, 75
- (12) Hilker, M. et al. 2007, A&A, 463, 119
- (13) Jones, J.B., Drinkwater, M.J., Jurek, R. et al. 2006, AJ, 131, 312
- (14) Jordán, A., Blakeslee, J. P., Peng, E. W. et al. 2004, ApJS, 154, 509
- (15) Jordán, A. et al. 2005, ApJ, 634, 1002
- (16) Jordán, A. et al. 2006, ApJ, 651, L25
- (17) Jordán, A. et al. 2007, ApJS, 171, 101
- (18) Kundu, A., Whitmore, B. 2001, AJ, 121, 2950
- (19) Larsen, S. S., Brodie, J. P., Huchra, J. P., Forbes, D. A., Grillmair, C. J. 2001, AJ, 121, 2974
- (20) Larsen, S. S. 2002, AJ, 124, 1393
- (21) Le Fevre, O. et al. 2003, SPIE, 4841, 1670
- (22) Mieske, S., Hilker, M., Infante, L. 2004a, A&A, 418, 445
- (23) Mieske, S., Hilker, M., & Infante, L. 2005, A&A, 438, 103
- (24) Mieske, S., Hilker, M., Jordán, A., Infante, L., & Kissler-Patig, M. 2007, A&A, 472, 111
- (25) Mieske, S. et al. 2008a, A&A, 487, 921
- (26) Mieske, S. et al. 2008b, A&A, 489, 1023
- (27) Misgeld, I., Mieske, S., & Hilker, M. 2008, A&A, 486, 697
- (28) Misgeld, I., Hilker, M., & Mieske, S. 2009, submitted to A&A
- (29) Phillipps S., Drinkwater M.J., Gregg M.D., Jones J.B., 2001, ApJ 560, 201
- (30) Quintana, H., Ramirez, A., & Way, M. J. 1996, AJ, 111, 603
- (31) Reiprich, T. & Böhringer, H. 2002, ApJ, 567, 716
- (32) Rejkuba, M., Dubath, P., Minniti, D., & Meylan, G. 2007, A&A, 469, 147
- (33) Rhode, K. L., & Zepf, S. E. 2001, AJ, 121, 210
- (34) Schlegel, D.J., Finkbeiner, D.P., & Davis, M. 1998, ApJ, 500, 525
- (35) Thomas, P. A., Drinkwater, M. J., & Evstigneeva, E. 2008, MNRAS, 389, 102
- (36) Tonry, J. & Davis, M. 1979, AJ, 84, 1511
- (37) Wehner, E. & Harris, W. 2008, ApJL, 668, 35
- (38) Weidner, C., Kroupa, P. & Larsen, S.S. 2004, MNRAS, 350, 1503
- (39) Whitmore, B., in: Extragalactic Globular Cluster Systems:: Proceedings of the ESO Workshop Held in Garching, Germany, 27-30 August 2002, ESO ASTROPHYSICS SYMPOSIA. ISBN 3-540-40472-4. Edited by M. Kissler-Patig. Springer-Verlag, 2003, p. 336
| ID | RA (J2000) | DEC (J2000) | V0 | (V-R)0 | (V-I)0,estimated | vrad [km/s] | R | rh [pc] |
|---|---|---|---|---|---|---|---|---|
| CCOS J192.129-41.401 | 12:48:30.88 | -41:24:04.96 | 21.15 | 0.51 | 0.77 | 2650 (47) | 8.06 | |
| CCOS J192.200-41.334 | 12:48:48.01 | -41:20:01.52 | 21.22 | 0.64 | 1.03 | 2061 (76) | 5.79 | |
| CCOS J191.958-41.258 | 12:47:49.93 | -41:15:28.04 | 21.34 | 0.90 | 1.52 | 3185 (60) | 5.94 |