Hunting high and low: XMM monitoring of the eclipsing polar HU Aquarii ††thanks: Based on observations obtained with XMM-Newton, an ESA science mission with instruments and contributions directly funded by ESA member states and NASA.
Abstract
Aims. We want to study the temporal and spectral behaviour of HU Aqr in the X-ray domain during different accretion states.
Methods. We obtained spectra and light curves from four different XMM-Newton pointings covering intermediate and low states. The X-ray observations were accompanied with high time resolution photometry obtained with the Optima and ULTRACAM instruments.
Results. On two occasions in May 2002 and 2003 HU Aqr was found in an intermediate state with the accretion rate reduced by a factor of 50 compared to earlier high state measurements. X-ray spectra in the intermediate state can be described by a model containing a blackbody component and hot thermal plasma. Contrary to the high state the ratio between soft and hard X-ray flux is nearly balanced. In agreement with previous measurements we observed a migration of the accretion spot and stream towards the line connecting both stars. The brightness of HU Aqr was further reduced by a factor of 80 during two low states in October 2003 and May 2005, where it was detected at a luminosity of only erg s-1 . This luminosity would fit well with an active coronal emitter, but the relatively high plasma temperatures of 3.5 and 2.0 keV are more compatible with residual accretion. We updated the eclipse ephemeris of HU Aqr based on the eclipse egress of the accretion spot measured in various wavelength bands. The -diagram of the observed accretion spot eclipse timings reveals complex deviations from a linear trend, which can be explained by a constant or cyclic period change or a combination thereof. The quadratic term implies a period decrease at a rate of s s-1. In case the observed period change reflects a true angular momentum loss, this would be a factor of 30 larger than given by gravitational radiation.
Key Words.:
X-rays: stars – stars: cataclysmic variables – accretion – stars: magnetic fields – AM Her systems – stars: individual: HU Aqr1 Introduction
Polars or AM Herculis stars are important objects to understand accretion in the presence of a strong magnetic field. In these Cataclysmic Variables (Warner, 1995) the field of the white dwarf primary is sufficient to lock its rotation to the binary orbit, and to prevent the formation of an accretion disc. To date, we know 15 eclipsing systems of this kind, which additionally provide constraints on the viewing geometry and allow the different emission sites to be disentangled. Among those, HU Aqr is one the of the brightest and has become one of the most comprehensively studied systems. Since its discovery in the ROSAT survey (Schwope et al., 1993) it has been studied in various wavelength bands, and was the first system in which the ballistic stream was detected via Doppler tomography (Schwope et al., 1997). It features a rather simple accretion geometry with one dominating accretion spot that undergoes self-eclipses. It was the target of a long-term monitoring programme with the ROSAT and EUVE satellites (Schwope et al., 2001). Part of these observations were obtained in a high state that revealed a strong soft X-ray excess and could be used to resolve the eclipse egress, thus directly constraining the diameter of the soft X-ray emitting area to km. Modelling of the X-ray eclipse during the high state located the accretion region at azimuth ° and colatitude ° and required a substantial amount of vertical extent. During the monitoring HU Aqr displayed large variations of the accretion rate, accompanied by a correlated migration of the accretion spot and the coupling region. For the reduced (intermediate) state of accretion both accretion spot and stream were shifted towards the line connecting both stars in agreement with an increased threading radius given by the magnetic/ram pressure balance. All of the intermediate state observations where obtained with the ROSAT-HRI and EUVE only, thus lacking spectral information. In this paper we present a series of XMM pointings that continue the monitoring through intermediate and low brightness states of the system. Preliminary results of this study were presented in Schwope et al. (2004) and Vogel et al. (2008).
2 Observations and reduction
| Date | Detector(1) | Mean rate(2) | |
|---|---|---|---|
| (ksec) | (cts/s) | ||
| 2002 May 16–17 | PN-sw | 36.4 | 1.11 |
| MOS1-sw | 37.2 | 0.19 | |
| MOS2-sw | 37.2 | 0.26 | |
| 2003 May 19 | PN-ti | 18.5 | 0.94 |
| MOS1-ti | 20.2 | 0.21 | |
| MOS2-ti | 20.0 | 0.18 | |
| 2003 Oct 24–25 | PN-sw | 11.4 | 0.011 |
| MOS1-sw | 11.6 | - | |
| MOS2-sw | 11.6 | - | |
| 2005 May 16 | PN-ti | 18.6 | - |
| MOS1-sw | 19.4 | 0.0025 | |
| MOS2-sw | 19.4 | 0.0022 |
(1) The abbreviations after the PN/MOS detector
indicate the instrument mode: sw = small window, ti = timing
(2) In the bright phase interval and . Energy range used
0.18–10 keV and 0.3–10 keV for imaging and timing
modes, respectively. Count rates have been corrected
for the 65% encircled energy fraction corresponding
to the aperture used.
Between 2002 and 2005 HU Aqr was the target of four dedicated XMM pointings. Different instrument configurations of the EPIC cameras (Table 1) were used to best match the brightness level of the source.
For the MOS and PN data taken in image mode source photons have been extracted within a circular aperture of 15″. The resulting count rates given in the paper have been corrected for the 65% encircled energy fraction corresponding to this radius. The background level has been determined from a larger source-free region close to the source. For the timing mode observation the level of background radiation was comparable to the source flux resulting in much poorer data quality. The PN-data additionally suffered from soft proton flares, so here all photons with energies lower than 0.3 keV had to be omitted. Apart from this particular data set, spectral analysis was applied to the energy range between 0.18–10 keV including good events (flag = 0) identified with patterns 0–12 and 0–4 for the MOS and PN-CCD, respectively. We used version 7.0.0 of the XMMSAS package.
During each pointing the Optical Monitor (OM) was operated with the filter UVM2 using the fast mode. These data were reduced using the task omfchain. For conversion of the count rates to flux units we applied the factors given in the XMM calibration file OM_COLORTRANS.
We also obtained contemporary optical data with the fast-timing photometric devices ULTRACAM (Dhillon et al., 2007) and Optima (Kanbach et al., 2003). These instruments were operated at the 4.2-m William Herschel Telescope (WHT) on La Palma, the VLT on Paranal, and the 1.3 m telescope of the Skinakas Observatory, Crete. A detailed description of these optical and the OM UV observations will be given in a different paper (Vogel et al., in prep.).
3 Results
3.1 An updated accretion spot ephemeris
We have updated the eclipse ephemeris of HU Aqr using newly available timings of the spot egress measured in the optical, UV and X-rays (Table LABEL:t:timings) and the older ROSAT and EUVE measurements of Schwope et al. (2001). As the timestamp of egress/ingress in the optical we used the moments of half intensity. For the photon counting data (UV and X-ray) this datum was computed from the mean of the arrival times of the first three photons after the eclipse. Excluded were the low state OM light curves, which are of low counting statistic and likely dominated by the white dwarf photosphere. All timings have been converted to the solar system’s barycenter and are in the time frame of ephemeris time which accounts for leap seconds.
| Linear ephemeris: | |
| BJED = T0 + P | |
| T | P d |
| = 101 | |
| Quadratic ephemeris: | |
| BJED = T0 + P + | |
| T | P d |
| Q | |
| = 100 | |
| Sinusoidal ephemeris: | |
| BJED = T0 + P + A | |
| T d | P d |
| A d | B cycles |
| C cycles | |
| Quadratic + sinusoidal ephemeris: | |
| BJED = T0 + P + + A | |
| T | P d |
| Q | A d |
| B cycles | C cycles |
| = 97 | |
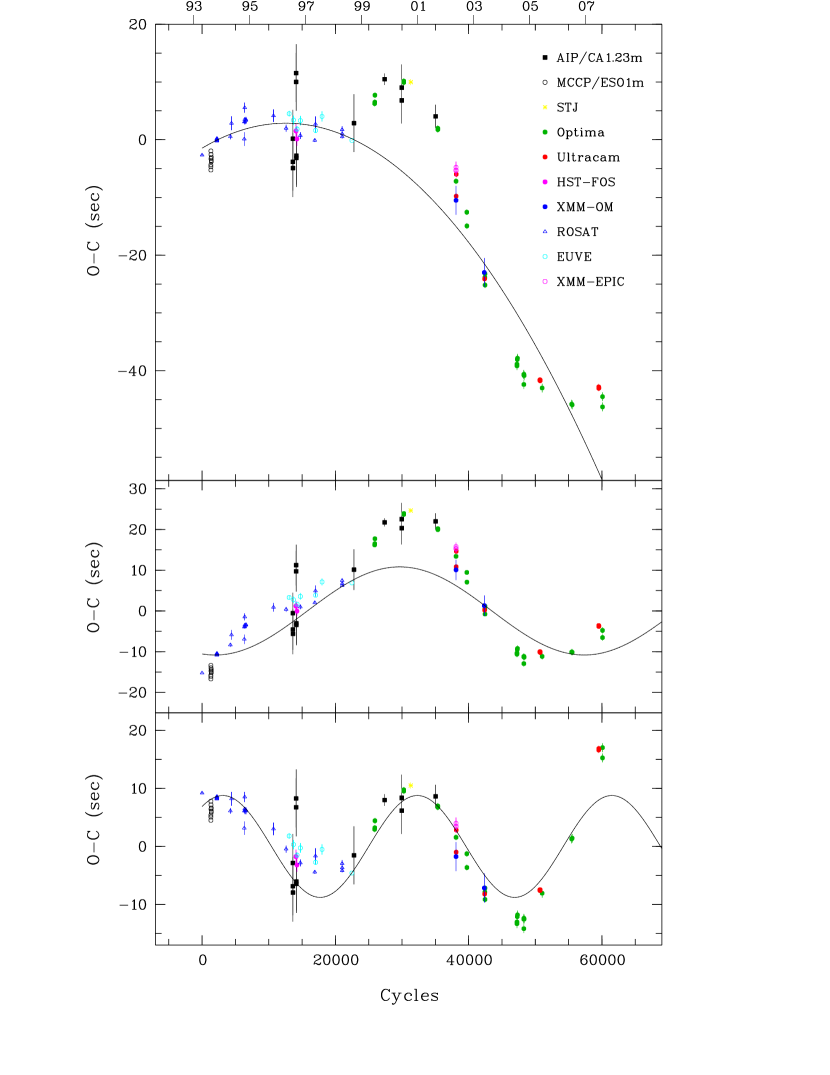
In Fig. 1 we compare the observed egress timings with the predictions of the linear ephemeris of Schwope et al. (2001), which reveals conspicuous deviations of up to 45 sec for the latest observations. We have updated the linear ephemeris using a least-squares fit weighted by the inverse of the squares of the eclipse timings. The best-fit parameters together with their formal 1- errors are given in Table 2. The fit is very poor, showing large positive and negative residuals.
A better match to the data can be achieved by introducing either a quadratic or a sinusoidal term. The first would indicate a secular variation of the orbital period, while the latter indicates a cyclical period change. The quadratic term is large and would imply an orbital period decrease of s s, which is larger than what is expected from angular momentum loss due to gravitational radiation. The cycle length of the sinusoidal modulation is 13 yr, close to the time-span of our observations. The quadratic and sinusoidal ephemerides are shown as solid lines in the upper and middel panels of Fig. 1. Both models feature a large of 40.5 and 30.4 emphasizing that the period variation is more complex than these simple fits. Of particular note is a rapid increase in the -values of 10 sec/yr between 1998 and 2000, and a subsequent strong period decrease in the following years lasting until 2004. This could be indicative of a cyclical period modulation on a shorter time-scale of just a few years. As a possible model we assumed a combination of a quadratic plus sinusoidal term, which account for a long-term period change and cyclical modulation simultaneously. The result of this fit is displayed in the lower panel of Fig. 1, where the residuals of the linear and quadratic part of the ephemeris are shown together with the fitted sinusoidal term. The combined fit yields a of s s, slightly larger compared to the simple quadratic ephemeris. The cyclical variation has a period of 6.9 yr and an semi-amplitude of sec. Our data so far faithfully revealed two consecutive cycles of this putative modulation lending some support for its existence. On the other hand, the very latest data points are already deviating by 10 sec suggesting that the derived period decrease might be to large.
With a of 11.5 the fit is clearly better than the single quadratic or sinusoidal models. Using an -test following the prescription of Pringle (1975) the significance of the quadratic plus sinusoidal ephemeris compared to the linear plus sinusoidal ephemeris is per cent with . While this model is statistically favoured, it is too early to say what the future behavior of the period wanderings in HU Aqr will be. However, the eclipse timings to be taken in the next few years should clearly discriminate between the different possible solutions and confirm the existence of a large quadratic term.
3.2 X-ray and UV light curve morphology
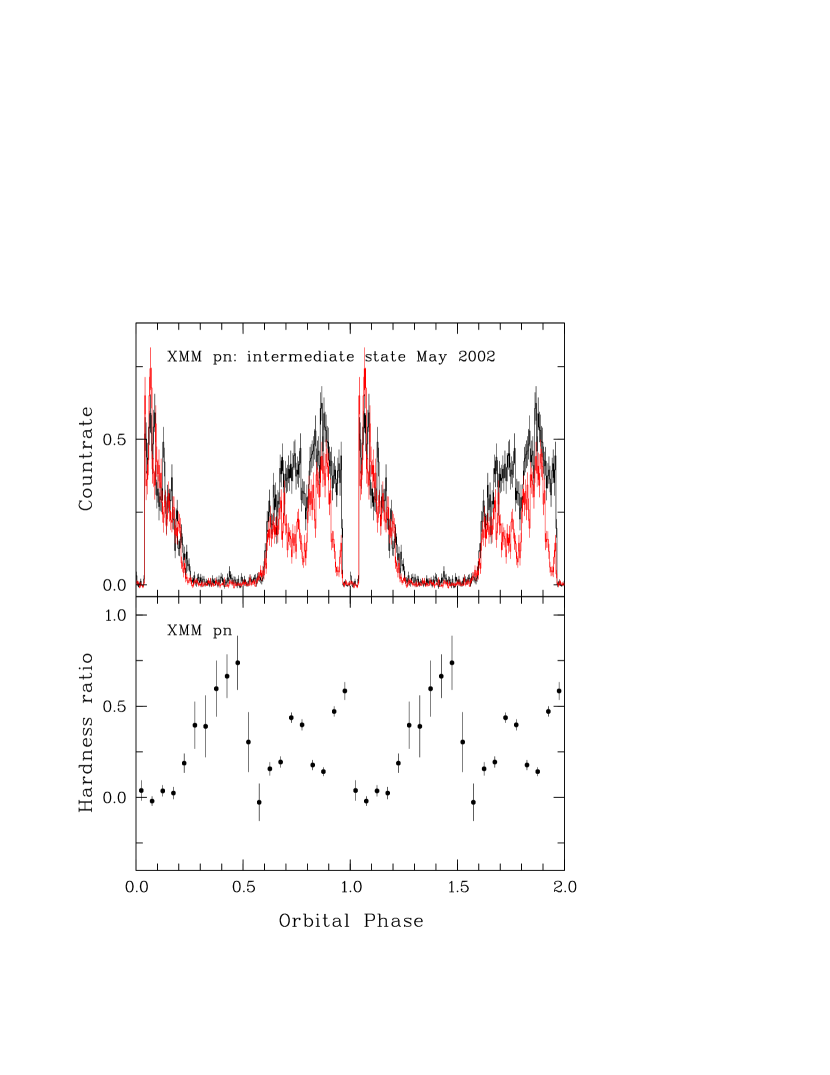
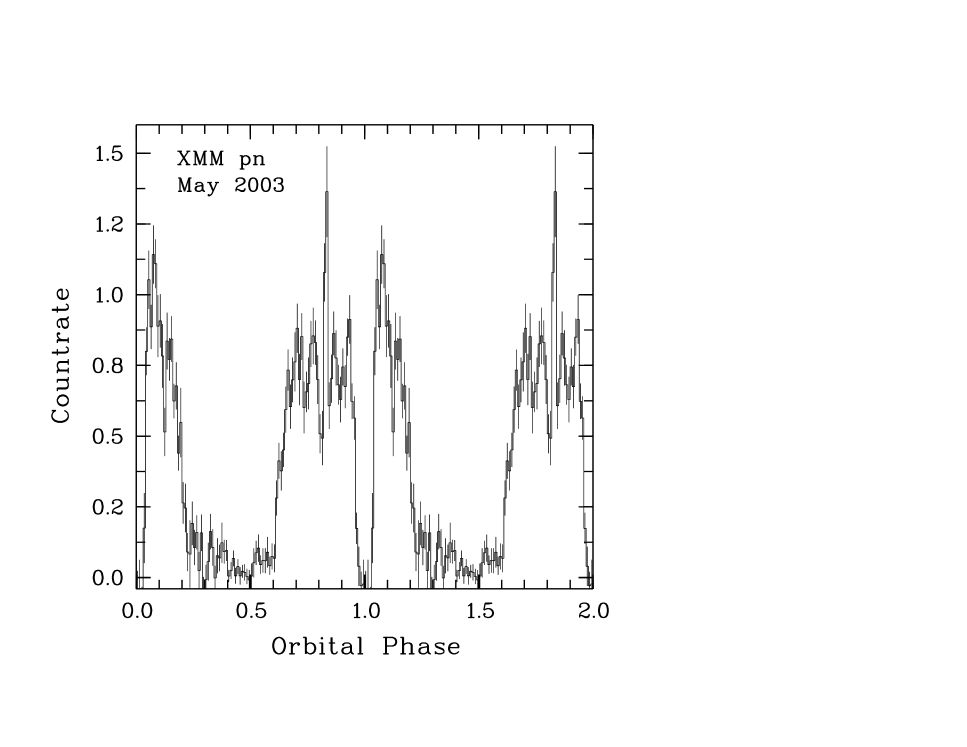
In Fig. 2 and Fig. 3 we show the EPIC-PN light curves during the intermediate states observed in May 2002 and May 2003. For the data from May 2002 we extracted photons in two spectral bands ranging from 0.18–0.35 and 0.5–10 keV, which match the two spectral components (see below). A corresponding hardness ratio has been calculated with the two bands related as (hard-soft)/(hard+soft).
As in previous X-ray observations the light curves are dominated by a single bright phase interval of a self-eclipsing pole. The centre of the bright phase of the main accretion region was at and for the May 2002 and 2003 observation, respectively. This corresponds to an azimuthal position of . There is no obvious difference between the location of the soft and hard X-ray emitting region. Compared to previous observations these new measurements show the main accretion region most closely shifted towards the line connecting both stars. Such a relation between position and instantaneous accretion rate is expected for an intermediate state from the general trend seen in some older ROSAT/EUVE observations (Schwope et al., 2001).
The light curve from May 2002 reveals the presence of narrow and broad absorption dips in the soft X-ray light curve. For the observation of May 2003 the counting statistic in the soft band is not sufficient for a clear detection of either dip. In May 2002 the narrow absorption feature was centred at phase with the dip ingress starting at . These values are among the closest to the eclipse observed, indicating a migration of the stagnation point towards the line connecting both stars. A broad absorption trough is centred around very similar to what was previously observed in several ROSAT and EUVE pointings.
There is a substantial hardness ratio variation during both the narrow and the broad absorption dip. The narrow dip is not total even in the softest X-ray band. A fit to the dip spectrum with the temperature of the blackbody components fixed yields a cold absorption column of cm-2. This is a factor of ten lower then the cm-2 measured during the ROSAT high-state observation from October 1993.
Contrary to the bright-state ROSAT observation from October 1993, eclipse ingress and egress profiles are unresolved for the XMM observations at a timescale shorter than sec due to the low count rate of the data.
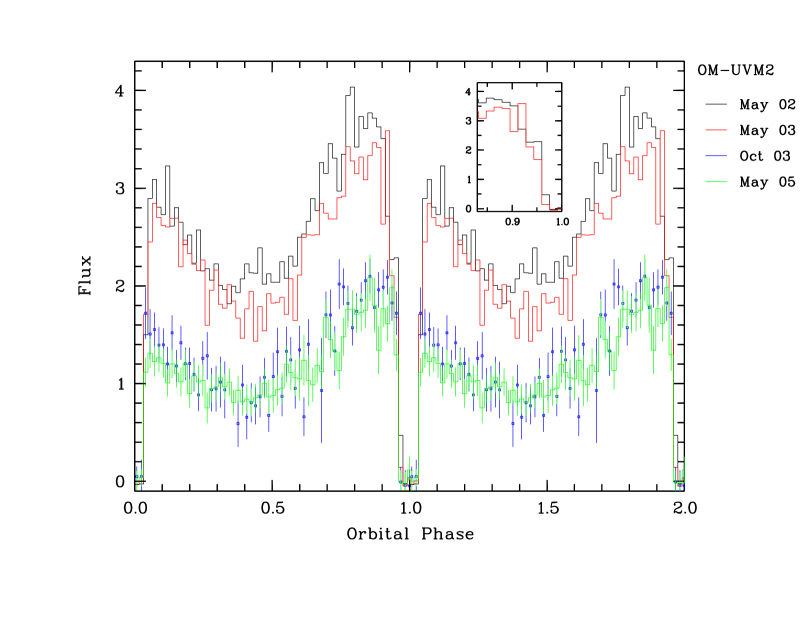
Fig. 4 shows the phase folded light curves of HU Aqr taken with the Optical Monitor and the UVM2 filter. The source was in two different brightness states, being brighter by a factor of two during the intermediate state observed in May 2002 and May 2003. During both low states HU Aqr was at the same brightness level, between in the faint phase and at orbital maximum. At all four epochs we observe a smooth sine-like modulation reminiscent of a heated cap on the surface of the white dwarf (Gänsicke et al., 2006). The level of modulation is rather similar for all brightness states. This suggests that the amount of heating does not strongly depend on the instantaneous irradiation. A detailed modelling of this feature will be presented in Vogel et al., in prep.
In the intermediate brightness state the pre-eclipse UV flux is depressed by 30% starting at phase 0.92 (see inset of Fig. 4). A plausible explanation for this dip is absorption by the accretion stream also seen in soft X-rays. The additional brightness compared to the low state is seen in the bright and faint phase, i.e. it does not come from the self-eclipsing heated cap. A possible source of this emission is the accretion stream, which is also indicated by a prolonged ingress after eclipse of the white dwarf.
3.3 X-ray spectroscopy
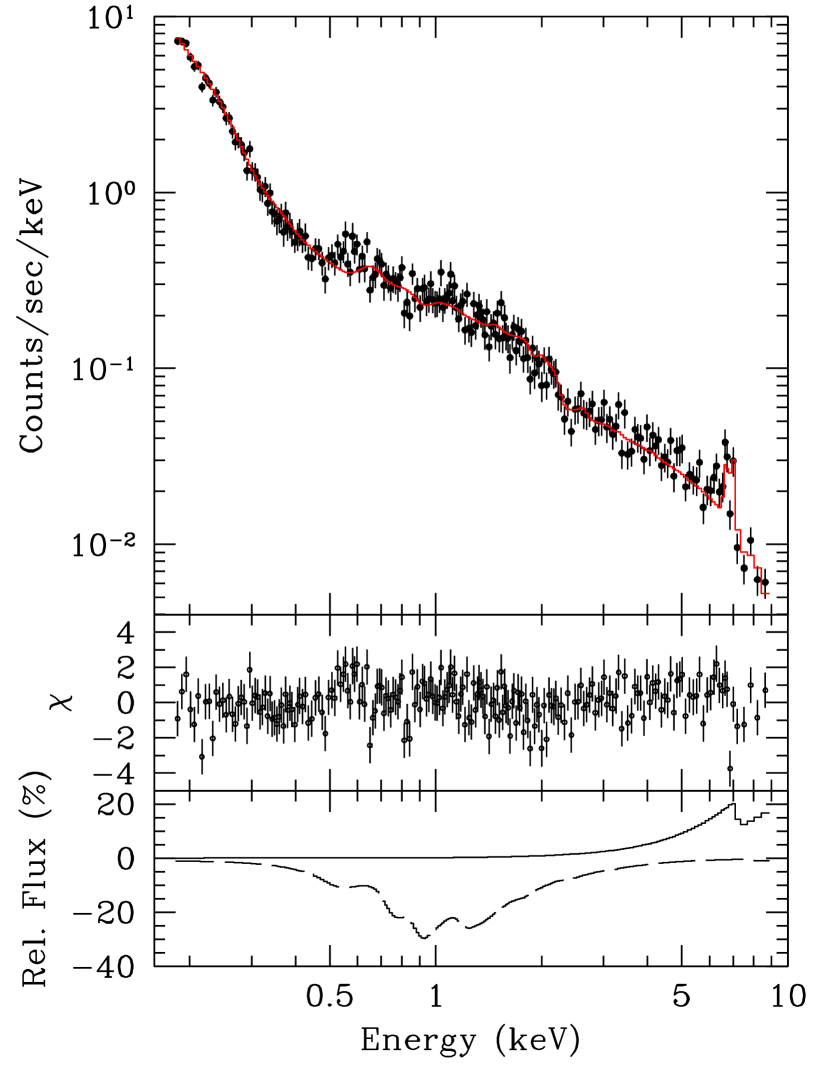
X-ray spectra in the intermediate state have been extracted using the bright phase intervals from and , thus excluding the absorption dip and the eclipse. The spectra of the PN and MOS detectors have been fitted together and can be described with a two component model including a soft blackbody and hot thermal plasma. For the latter both a mekal or a bremstrahlung model fits relatively well with a of 1.46 and 1.49. The observation from May 2002 is sufficient to resolve individual line features. Above 6 keV all three lines of fluorescent, H-like and He-like iron are present and do contribute to the . We also note weak residuals seen at 0.5 keV from a blend of line emission, probably dominated by the O vii and O viii lines at 21.8 and 19 Å. The ratio between the H-like and He-like iron lines indicates plasma with temperatures between 5–15 keV, while the continuum slope at energies larger 5 keV forces the fit to unrealistically high temperatures of keV and keV. Introducing a continuous temperature cmekal model does not help to solve the discrepancy between the temperature indicators.
A way to reconcile the spectral slope with more realistic plasma temperature is by adopting an ionised absorber as implemented in XSPEC by the absori model (Done et al., 1992). Introduction of the absori model significantly improves the fit to . Using an -test this model is better than the model without warm absorption at the 75% significance level. Comparison with fits to the PN-data alone yields a of 1.12, showing that the remaining discrepancy is mainly due to the uncertainty in the cross-calibration of the different detectors. As parameters of the absori model we fixed the power law index of the incident radiation to 1.25 and the temperature of the ionised material to 30000 K. The remaining best fit parameters then are an absorption column of cm-2 and an ionisation parameter erg cm sec-1. For the observation of May 2003 these parameters were fixed at the values from 2002 given the low quality of the data. The complex absorption drastically decreases the best-fit temperatures of the mekal model to 19 and 15 keV for the observation in 2002 and 2003, respectively.
The incidence of the fluorescent iron line at 6.4 keV reveals that there is also reflection from neutral material at the surface of the white dwarf. This has been taken into account by adding the reflect model (Magdziarz & Zdziarski, 1995) to our fitting. The new model component only marginally improves the , but lowers the temperatures of the mekal component to 15 and 13 keV for the observation in 2002 and 2003, respectively. The only free paramter is the scaling factor of the reflected component, which for the fit of the 2002 data is . This value was fixed for the fit to the much poorer data from 2003. For completeness we also provide a fit using only the reflection model without an ionised absorber. For the 2002 observation this fit has a significantly higher compared to the fit including warm absorption, while the difference between both models is negligible for the data of May 2003. Using this model the best-fit temperatures of the mekal component change to 35 and 22 keV for the observation in 2002 and 2003, respectively.
The blackbody temperatures for the observations of May 2002 and May 2003 differ and also depend on the details of the absorption and reflection models used. The best-fit values for our finally adopted model including warm absorber and reflection are eV and eV, differing only slightly above the -level. Those values fall right into the range of temperatures measured for polars with a dominant soft component (Ramsay & Cropper, 2003; Ramsay et al., 2004). The decrease of the temperature in May 2003 is accompanied by an increase of the unabsorbed, bolometric soft X-ray flux by a factor of 6. At the same time the bolometric hard X-ray flux decreased by 10% . A much more significant change (at the level) of the blackbody temperature is observed if one compares the 34 eV of the intermediate state in 2002 with the 22 eV measured during the previous high state in October 1993 (Schwope et al., 2001).
We also note the change of the hydrogen column density compared to the high state ROSAT observation. Both intermediate state observations require at maximum a density of cm-2, whereas the ROSAT pointing is consistent with a larger column of cm-2. The large variability of the absorption column point toward an intra-binary origin.
Using the values from the fit including absorption and reflection, and taking and for the scaling of the blackbody and thermal emission, the unabsorbed flux ratio were 1.3 and 8.4 for the May 2002 and May 2003 intermediate states. Taking into account the uncertainty due to the unknown emission characteristic and the neglect of the cyclotron component, the value from May 2002 is relatively close to the ratio of of the standard accretion shock model of Lamb & Masters (1979) and King & Lasota (1979). Both values mark a dramatic decrease of the soft X-ray excess compared to the high state of October 1993, where the soft-to-hard ratio of the bolometric fluxes was . Note that this change is almost solely due to the decrease of the soft X-ray component, whereas the hard X-ray flux remained nearly constant from the high to the intermediate state.
The total luminosity in X-rays , assuming a distance of 180 pc, was and erg s-1 in May 2002 and May 2003. The inferred accretion rate is between M⊙/yr , a factor of 20 lower compared to the high state.
| Model | ||||||
|---|---|---|---|---|---|---|
| (1019 cm-2) | (eV) | (keV) | ||||
| May 2002 | ||||||
| bb+brems | 35 | 115 | 1.49 | |||
| bb+mek | 35 | 98 | 1.46 | |||
| reflect(bb+mek) | 35 | 1.44 | ||||
| absori(bb+mek) | 32 | 1.37 | ||||
| reflect absori(bb+mek) | 34 | 1.36 | ||||
| May 2003 | ||||||
| bb+brems | 29 | 69 | 1.46 | |||
| bb+mek | 29 | 54 | 1.43 | |||
| reflect(bb+mek) | 29 | 1.38 | ||||
| absori(bb+mek) | 25 | 1.39 | ||||
| reflect absori(bb+mek) | 25 | 1.36 | ||||
| Oct 2003 | ||||||
| mek | 0.5 | |||||
| May 2005 | ||||||
| mek | 1.25 |
1 The refers to cold absorption applied to all model components.
3.4 Deep low-state observations
In October 2003 HU Aqr was found in a deep X-ray low-state. An optical light curve taken on October 21, 2003 three days in advance of the X-ray observations showed HU Aqr with a bright phase magnitude of only . The source was detected with the PN detector at a rate of only cts/sec. The spectrum of the source photons can be fitted with a thermal plasma mekal model with a of 0.5. A fit using Cash statistics led to similar results. No dedicated soft blackbody component is required for the low state of HU Aqr. The fit temperature of keV is not very well constrained. The unabsorbed bolometric flux of the observed spectrum is erg cm-2 s-1 yielding an X-ray luminosity of erg s-1 for a distance of 180 pc. There is weak indication for a variability pattern, where the photons cluster in the X-ray bright phase.
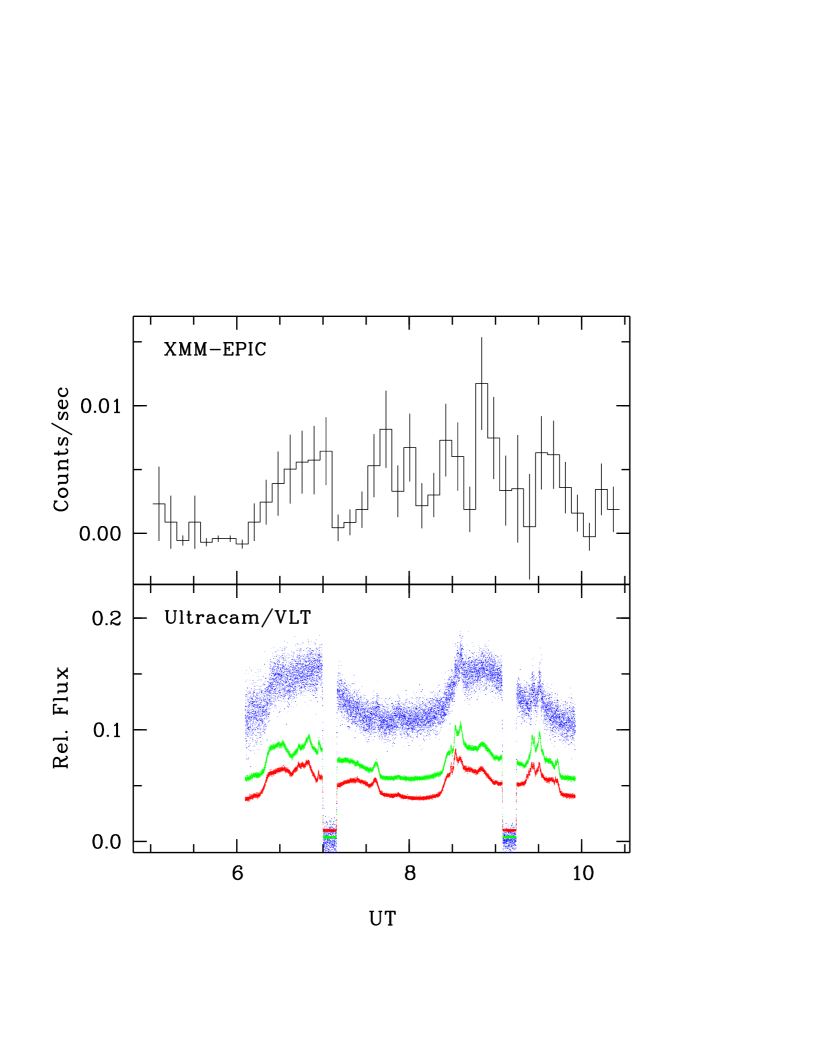
A second deep low state was observed in May 2005. This observations was accompanied by a series of ULTRACAM light curves taken on consecutive nights between May 14 and 17, 2005. In the and -band residual accretion activity was evident by cyclotron beaming and flaring. The -band, on the otherhand, was clearly dominated by sine-like variations reminiscent of a heated white dwarf cap. Starting from a bright phase magnitude of seen on May 14, 2005 the level of additional accretion activity increased from night to night. For the simultaneous observations on May 16, 2005 the maximum brightness was at . HU Aqr was detected in both MOS detectors at mean rates of 0.0022 and 0.0025 cts/sec. The X-ray light curve (Fig. 6) reveals clear variability, which was only partially correlated with the visibility of the main accretion region. For instance the source appears X-ray bright during one faint phase interval. As for the first low state observation the spectrum can be sufficiently fitted by a single temperature thermal plasma model. The fit parameters imply a negligible amount of absorption and a temperature of keV. The source was at a similar brightness level compared to the October 2003 low state with a bolometric flux of erg cm-2 s-1 .
The observed X-ray emission can be compared with that of single, active late type stars (Pizzolato et al., 2003). Assuming a bolometric luminosity of erg s-1 for the M4.5 secondary (Leggett et al., 1996) results in . This value is compatible with the saturated X-ray regime observed for the fastest rotators, although it falls into the top end being a factor of two higher than the mean. An argument against a coronal origin are the relatively high plasma temperatures, that lie above the peak of in the temperature distribution of coronal emitters (Sanz-Forcada et al., 2003) and are also higher than the temperatures of keV observed in low accretion rate polars (Vogel et al., 2007). The plasma temperatures measured in the low-state of HU Aqr are better matched with an origin in a low density accretion column that predominantly cools via cyclotron radiation (Woelk & Beuermann, 1992). Signs of residual accretion are obviously present in the and light curves in May 2005, where cyclotron beaming and flaring is observed. The problem with this interpretation is that one would expect a clear on/off variability pattern in X-rays due to the self-eclipse of the accretion region, which is not observed at least for the low state in May 2005.
4 Discussion
One of the major results of our study is the dependence of the soft X-ray excess on the X-ray brightness level and thus the instantaneous accretion rate. Unlike the high state when a strong soft X-ray excess was observed, the system reverted to a more balanced flux ratio in its intermediate accretion state. A similar result has been reported for a handful of systems in the XMM snap-shot survey of polars (Ramsay & Cropper, 2004). It can be understood in terms of a density change in the coupling region, and is therefore an indirect confirmation of the blobby accretion scenario (Frank et al., 1988). Our observation indicates a temperature increase of the blackbody component from 22 eV to 34 eV as the system changed from the high to the intermediate state. There are only few observations of polars which constrain the physical parameters that determine the temperature of the reprocessed X-ray emission. One particular example is the ROSAT PSPC observation of AM Her (Beuermann et al., 2008), which shows a correlated increase of the blackbody temperature with increasing soft X-ray flux. This result is an indication that the temperature is set in response to a locally enhanced accretion rate, at least for this given system at certain epoch. The anti-correlation of temperature and soft X-ray flux in HU Aqr would contradict this picture and could be explained by a much smaller soft X-ray emitting area in the intermediate state.
During the intermediate state the main accretion spot shifted toward the line connecting both stars to an azimuth of °. It thereby follows the accretion-rate dependent migration previously seen in some ROSAT/EUVE pointings (Schwope et al., 2001). We did not observe the irregular behaviour seen in a few ROSAT/EUVE intermediate state observations, where the accretion spot flipped back to the high state position. The accretion stream was detected via the absorption dip. Compared to the high state its column density was reduced by a factor of 10, while its position moved by with respect to its high state position, also in accord with previous observations.
The origin of X-rays during the low state of HU Aqr remains ambiguous. While the luminosity is consistent with a coronal emitter, the observed temperatures are better explained by an accretion plasma. For the latter interpretation we would expect a clear orbital modulation which is not observed.
The diagram of the accretion spot eclipse timings in HU Aqr reveals large deviations from a constant period on relatively short timescales. It should be noted that the observed spot timings, beside a true change of the orbital period, are influenced by the location of the accretion spot on the surface of the white dwarf, which is established in HU Aqr to depend on the mass accretion rate. Taking the observed accretion geometry changes from high to intermediate states, the movement of the accretion spot from ° to ° (Schwope et al., 2001), we estimate the possible, additional shift of the -values to be only 2 sec, being thus small compared to the observed deviations.
The observed variations in the -diagram must either be attributed to a secular period variation due to angular momentum loss or cyclic variations or a combination thereof. The situation remains so far ambiguous with both a quadratic and sinusoidal ephemeris being equally possible and providing a similarly bad or good description of the data. A combined quadratic and sinusoidal ephemeris results in a significantly better fit. If true, the observed period decrease s s would be large, implying an angular momentum loss of erg neglecting the effects of mass loss. This is in the range of standard magnetic braking (Rappaport et al., 1983), but a factor of 30 larger than expected by gravitational radiation alone. Such a strong angular momentum loss for a system below the period gap would clearly violate the standard evolutionary scenario of disrupted magnetic braking. Notably, a period decrease at a similar level was recently detected in three other short period binaries: DP Leo (Schwope et al., 2002), NN Ser (Brinkworth et al., 2006) and OY Car (Greenhill et al., 2006). Future observations have to show if these variations are indeed secular or if their periodic nature is masked by the yet insufficient baseline.
Borges et al. (2008) have compiled a selection of 14 eclipsing CVs for which a well sampled -diagram has been established. All these systems show variations of the period, which in the long-run mostly appear to be cyclic masking any remaining secular trend. The ()-diagram of HU Aqr also reveals clear indication for a cyclic change, irrespective of whether a strong secular period evolution is assumed or not. The measured modulation periods (13 or 6.9 yrs) and the amplitudes imply a fractional period change of , which is comparable to the values of the four CVs of Borges et al. (2008) that lie below the period gap. The preferred mechanism invoked to explain these cyclic variations in CVs and other long-period close binaries (Algol, RS CVn and W UMa stars) are period modulations due to shape changes induced by a variable magnetic field (Applegate, 1992).
A recent recalculation of Applegate’s mechanism for the short-period pre-CVs NN Ser (Brinkworth et al., 2006) shows that the energy budget of the low-mass secondary is one order of magnitude lower than the energy needed to drive the observed period variations. The new calculations take into account a variable shell mass and the contribution of the quadrupole moment of the core. Following the calculations of Brinkworth et al. (2006) we tested if the energy budget of the secondary star in HU Aqr allows for the Applegate mechanism at all. Using M2 = 0.2 , R2 = 0.22 and MWD = 0.88 (Vogel et al., in prep.) the change in period implied by the sinusoidal terms of the ephemerides result in a required energy to drive the Applegate mechanism which exceeds the total radiant energy of the secondary in the case of the quadratic + sinusoidal ephemeris by a factor of 3.5 and still requires 80 per cent at minimum in the case of the sinusoidal ephemeris. Neglecting any angular momentum loss the quadratic ephemeris also requires more than half of the total energy output of the star. We therefore claim that the Applegate mechanism cannot account for the possible sinusoidal modulation of the orbital period.
As an alternative origin the cyclic period changes could also be caused by an unseen third body in which case the variation should be strictly periodic. Taking the elements of the quadratic plus sinusoidal ephemeris we compute the minimum mass of such a body assuming that its inclination is 90°. The observed mass function (Borkovits & Hegedues, 1996) is M⊙ implying a minimum mass of the third body of 0.0047M⊙ (5 Jupiter masses) for an assumed total mass of the system of 1.0 M⊙. On the otherhand, a third body more massive than an object at the hydrogen-burning limit would require an inclination ° and is therefore not very likely.
Acknowledgements.
RS and JV are supported by the Deutsches Zentrum für Luft- und Raumfahrt (DLR) GmbH under contracts No. FKZ 50 OR 0206 and 50 OR 0404. ULTRACAM is supported by STFC grant PP/D002370/1.References
- Applegate (1992) Applegate, J. H. 1992, ApJ, 385, 621
- Beuermann et al. (2008) Beuermann, K., El Kholy, E., & Reinsch, K. 2008, A&A, 481, 771
- Borges et al. (2008) Borges, B. W., Baptista, R., Papadimitriou, C., & Giannakis, O. 2008, A&A, 480, 481
- Borkovits & Hegedues (1996) Borkovits, T. & Hegedues, T. 1996, A&AS, 120, 63
- Bridge et al. (2002) Bridge, C. M., Cropper, M., Ramsay, G., et al. 2002, MNRAS, 336, 1129
- Brinkworth et al. (2006) Brinkworth, C. S., Marsh, T. R., Dhillon, V. S., & Knigge, C. 2006, MNRAS, 365, 287
- Dhillon et al. (2007) Dhillon, V. S., Marsh, T. R., Stevenson, M. J., et al. 2007, MNRAS, 378, 825
- Done et al. (1992) Done, C., Mulchaey, J. S., Mushotzky, R. F., & Arnaud, K. A. 1992, ApJ, 395, 275
- Frank et al. (1988) Frank, J., King, A. R., & Lasota, J.-P. 1988, A&A, 193, 113
- Gänsicke et al. (2006) Gänsicke, B. T., Long, K. S., Barstow, M. A., & Hubeny, I. 2006, ApJ, 639, 1039
- Greenhill et al. (2006) Greenhill, J. G., Hill, K. M., Dieters, S., et al. 2006, MNRAS, 372, 1129
- Kanbach et al. (2003) Kanbach, G., Kellner, S., Schrey, F. Z., et al. 2003, in Presented at the SPIE Conference, Vol. 4841, SPIE Conference Series, ed. M. Iye & A. F. M. Moorwood, 82–93
- King & Lasota (1979) King, A. R. & Lasota, J. P. 1979, MNRAS, 188, 653
- Lamb & Masters (1979) Lamb, D. Q. & Masters, A. R. 1979, ApJ, 234, L117
- Leggett et al. (1996) Leggett, S. K., Allard, F., Berriman, G., Dahn, C. C., & Hauschildt, P. H. 1996, ApJS, 104, 117
- Magdziarz & Zdziarski (1995) Magdziarz, P. & Zdziarski, A. A. 1995, MNRAS, 273, 837
- Pizzolato et al. (2003) Pizzolato, N., Maggio, A., Micela, G., Sciortino, S., & Ventura, P. 2003, A&A, 397, 147
- Pringle (1975) Pringle, J. E. 1975, MNRAS, 170, 633
- Ramsay & Cropper (2003) Ramsay, G. & Cropper, M. 2003, MNRAS, 338, 219
- Ramsay & Cropper (2004) —. 2004, MNRAS, 347, 497
- Ramsay et al. (2004) Ramsay, G., Cropper, M., Mason, K. O., Córdova, F. A., & Priedhorsky, W. 2004, MNRAS, 347, 95
- Rappaport et al. (1983) Rappaport, S., Verbunt, F., & Joss, P. C. 1983, ApJ, 275, 713
- Sanz-Forcada et al. (2003) Sanz-Forcada, J., Brickhouse, N. S., & Dupree, A. K. 2003, ApJS, 145, 147
- Schwope et al. (2004) Schwope, A., Hambaryan, V., Staude, A., et al. 2004, in ASP Conf. Ser. 315: IAU Colloq. 190: Magnetic Cataclysmic Variables, 92–+
- Schwope et al. (2002) Schwope, A. D., Hambaryan, V., Schwarz, R., Kanbach, G., & Gänsicke, B. T. 2002, A&A, 392, 541
- Schwope et al. (1997) Schwope, A. D., Mantel, K.-H., & Horne, K. 1997, A&A, 319, 894
- Schwope et al. (2001) Schwope, A. D., Schwarz, R., Sirk, M., & Howell, S. B. 2001, A&A, 375, 419
- Schwope et al. (1993) Schwope, A. D., Thomas, H. C., & Beuermann, K. 1993, A&A, 271, L25
- Vogel et al. (2008) Vogel, J., Schwope, A., Schwarz, R., et al. 2008, in American Institute of Physics Conference Series, Vol. 984, High Time Resolution Astrophysics: The Universe at Sub-Second Timescales, ed. D. Phelan, O. Ryan, & A. Shearer, 264–267
- Vogel et al. (2007) Vogel, J., Schwope, A. D., & Gänsicke, B. T. 2007, A&A, 464, 647
- Warner (1995) Warner, B. 1995, Cataclysmic variable stars (Cambridge Astrophysics Series, Cambridge, New York: Cambridge University Press, 1995)
- Woelk & Beuermann (1992) Woelk, U. & Beuermann, K. 1992, A&A, 256, 498
| Cycle | BJED | BJED | Instrument |
|---|---|---|---|
| 1319 | 9217.4361120 | 0.0000115 | MCCP+CA2.2 |
| 1320 | 9217.5229220 | 0.0000115 | MCCP+CA2.2 |
| 1321 | 9217.6097490 | 0.0000115 | MCCP+CA2.2 |
| 1322 | 9217.6966010 | 0.0000231 | ESO1m |
| 1333 | 9218.6516100 | 0.0000231 | ESO1m |
| 1334 | 9218.7384390 | 0.0000231 | ESO1m |
| 1367 | 9221.603501 | 0.0000231 | ESO1m |
| 1368 | 9221.690319 | 0.0000231 | ESO1m |
| 1369 | 9221.777148 | 0.0000231 | ESO1m |
| 14087 | 10325.959254 | 0.0000277 | HST |
| 14088 | 10326.046074 | 0.0000277 | HST |
| 14236 | 10338.895480 | 0.0000277 | HST |
| 13620 | 10285.414104 | 0.0001157 | AIP |
| 13621 | 10285.500878 | 0.0001157 | AIP |
| 13632 | 10286.455890 | 0.0001157 | AIP |
| 14115 | 10328.390324 | 0.0001157 | AIP |
| 14116 | 10328.477162 | 0.0001157 | AIP |
| 14138 | 10330.387041 | 0.0001157 | AIP |
| 14139 | 10330.473866 | 0.0001157 | AIP |
| 22788 | 11081.383711 | 0.0001157 | AIP |
| 27394 | 11481.278636 | 0.0000231 | AIP |
| 29955 | 11703.625705 | 0.0000810 | AIP |
| 29966 | 11704.580704 | 0.0000810 | AIP |
| 35043 | 12145.367925 | 0.0000463 | AIP |
| 29955 | 11703.625705 | 0.0000925 | CA123 |
| 29966 | 11704.580704 | 0.0000925 | CA123 |
| 31312 | 11821.441021 | 0.0000115 | STJ1 |
| 31313 | 11821.527841 | 0.0000115 | STJ1 |
| 25892 | 11350.874322 | 0.0000115 | Optima |
| 25926 | 11353.826219 | 0.0000115 | Optima |
| 25938 | 11354.868078 | 0.0000115 | Optima |
| 30276 | 11731.495069 | 0.0000115 | Optima |
| 30277 | 11731.581892 | 0.0000115 | Optima |
| 35376 | 12174.279097 | 0.0000115 | Optima |
| 35377 | 12174.365920 | 0.0000115 | Optima |
| 38109 | 12411.559191 | 0.0000115 | Optima |
| 39731 | 12552.381844 | 0.0000115 | Optima |
| 39742 | 12553.336841 | 0.0000115 | Optima |
| 42441 | 12787.665041 | 0.0000115 | Optima |
| 42463 | 12789.575075 | 0.0000115 | Optima |
| 42464 | 12789.661918 | 0.0000115 | Optima |
| 47253 | 13205.444710 | 0.0000173 | Optima |
| 47254 | 13205.531527 | 0.0000173 | Optima |
| 47300 | 13209.525279 | 0.0000173 | Optima |
| 47335 | 13212.563996 | 0.0000173 | Optima |
| 48265 | 13293.306950 | 0.0000173 | Optima |
| 48288 | 13295.303800 | 0.0000173 | Optima |
| 48299 | 13296.258845 | 0.0000173 | Optima |
| 48334 | 13299.297557 | 0.0000173 | Optima |
| 51032 | 13533.539015 | 0.0000173 | Optima |
| 55466 | 13918.500708 | 0.0000173 | Optima |
| 55546 | 13925.446340 | 0.0000173 | Optima |
| 60096 | 14320.479250 | 0.0000173 | Optima |
| 60097 | 14320.566050 | 0.0000173 | Optima |
| 38105 | 12411.211871 | 0.0000578 | XMM OM |
| 42352 | 12779.938034 | 0.0000578 | XMM OM |
| 38107 | 12411.385572 | 0.0000231 | XMM MOS1 |
| 38107 | 12411.385578 | 0.0000231 | XMM MOS2 |
| 38108 | 12411.472392 | 0.0000231 | XMM PN |
| 38133 | 12413.642851 | 0.0000115 | ULTRACAM |
| 38145 | 12414.684740 | 0.0000115 | ULTRACAM |
| 42395 | 12783.671299 | 0.0000115 | ULTRACAM |
| 50702 | 13504.888294 | 0.0000056 | ULTRACAM |
| 50713 | 13505.843317 | 0.0000056 | ULTRACAM |
| 50714 | 13505.930139 | 0.0000056 | ULTRACAM |
| 50724 | 13506.798342 | 0.0000056 | ULTRACAM |
| 50725 | 13506.885162 | 0.0000056 | ULTRACAM |
| 50737 | 13507.927008 | 0.0000056 | ULTRACAM |
| 59524 | 14270.817989 | 0.0000157 | ULTRACAM |
| 59525 | 14270.904812 | 0.0000157 | ULTRACAM |
| 59558 | 14273.769884 | 0.0000157 | ULTRACAM |
| 59559 | 14273.856704 | 0.0000157 | ULTRACAM |
| (1) From Bridge et al. (2002) |