Entropic contributions to the splicing process
Abstract
It has been recently argued that the depletion attraction may play an important role in different aspects of the cellular organization, ranging from the organization of transcriptional activity in transcription factories to the formation of the nuclear bodies. In this paper we suggest a new application of these ideas in the context of the splicing process, a crucial step of messanger RNA maturation in Eukaryotes. We shall show that entropy effects and the resulting depletion attraction may explain the relevance of the aspecific intron length variable in the choice of the splice-site recognition modality. On top of that, some qualitative features of the genome architecture of higher Eukaryotes can find an evolutionary realistic motivation in the light of our model.
pacs:
87.16.-b, 87.16.A-, 87.10.VgKeywords: splicing, depletion attraction, introns, macromolecular crowding
1 Introduction
1.1 The splicing process and the spliceosome assembly
Eukaryotic genes have a split nature, in which the exons, that encode the information for the final product of a messanger RNA (mRNA), are interrupted by non-coding introns in the DNA and in the precursor mRNA (pre-mRNA) transcript. The intron excision and the concomitant joining of exons, which basically represent the splicing process, are a necessity in order to obtain a mature mRNA that can be exported in the cytoplasm and for example correctly translated into a protein. This process is carried out by the spliceosome, a macromolecular ribonucleoprotein complex, that assembles on pre-mRNA in a stepwise manner [1, 2, 3]. The first requirement is the correct recognition of the intron/exon boundaries by small nuclear ribonucleoproteins (snRNPs) and some auxiliary splicing factors by binding to sequences located at the ends of introns. Subsequently the splice-site pairing takes place, bringing the two exons near to each other and looping the intron that have to be cut away.
1.2 Exon definition and intron definition
Although the molecular players and the key steps of spliceosome assembly are remarkably conserved through different species [4],
there are two alternative pathways of splice-site recognition: intron definition and exon definition [1, 5, 6, 7, 8].
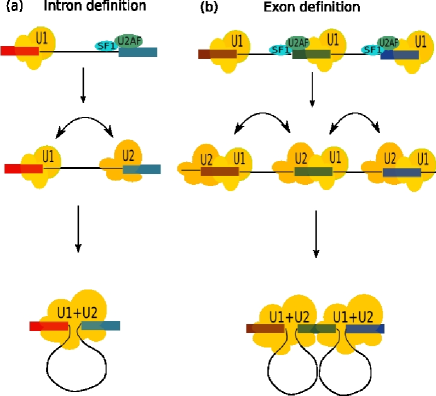
Intron definition (see figure 1a) begins with the direct interaction of the U1 snRNP with the splice-site in the upstream end of the intron
(5’ splice-site).
The splice-site in the downstream end (3’ splice-site) is then recognized by the U2 snRNP and associated auxiliary factors such as U2AF and SF1.
When the two complexes are constructed on the intron/exon boundaries they can be juxtaposed, closing an intron loop
which is then spliced away in order to correctly glue the exons. The interaction of the splicing factors bound at
the splice-sites occurs in this case across the intron. The exon definition (see figure 1b) requires
instead that the initial interaction between the factors bound at the splice-sites occurs across the exon:
the U1 and U2 snRNP and associated splicing factors bind to the 3’ and 5’ ends of an exon and a complex is built
across it (usually with the participation of serine/arginine-rich (SR) proteins [6]); then complexes on different exons join together
so as to allow intron removal.
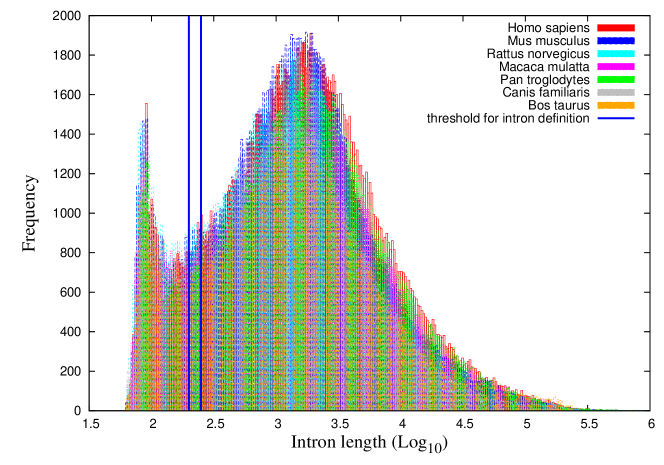
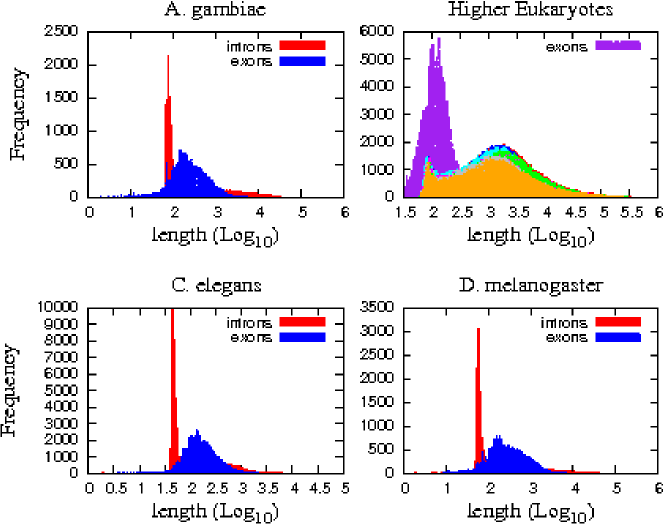
Previuos studies have shown that the length of the intron that has to be removed has a key role in the choice of the splice-site recognition modality [7, 10, 11]. Short introns are spliced away preferentially through intron definition, while longer introns seem to require an exon definition process. In particular the analysis of [10] suggests the presence of a threshold in intron length - between 200 and 250 nucleotides (nt) long- above which intron-defined splicing ceases almost completely. Lower Eukaryotes present typically short introns, below the threshold, so it is expected that intron removal proceeds through intron definition [5, 8, 11, 12]. Higher Eukaryotes instead have an intron length distribution presenting two pronounced peaks, with the threshold in between (see figure2), so even if the vast majority of introns are above the threshold (data in table 1), the first peak contains introns suitable for intron definition. This agrees with several studies [11, 12, 13, 14] which have shown that both ways of splice-site recognition are present in higher Eukaryotes, even if the exon definition pathway seems to be the prevalent one.
As it can be seen in figure 2, not only the shape of the distribution is quite conserved through different species, but also the position of the peaks.
2 Intron removal and depletion attraction
The first goal of our paper is to propose a simple physical model of early steps of spliceosome assembly on a pre-mRNA, taking
into account possible entropic contributions to the splicing process. Subsequently we will show that, despite its simplicity, the
model is able to produce quantitative predictions which are in rather good agreement with experimental and bioinformatical observations.
Our starting point is the assumption that the splicing complexes, which are immersed in the crowded nuclear
environment ([15] and reference therein), feel the so called “depletion attraction” [16]. This interaction is
essentially an entropic effect due to the fact
that when two large complexes (like the splicing ones) approach each other, they reduce the volume between them excluded to the depleting particles.
If the complexes are immersed in an environment crowded of macromolecules of
smaller (but comparable) size, then this excluded volume effect
induces an attractive interaction between the two complexes.
This simple geometrical reasoning forms the basis for the Asakura-Oosawa (AO) theory [16, 17]. In more recent years, a more sophisticated hypernetted-chain-based theory describing depletion forces in fluids has been developed [18, 19] and tested in Monte Carlo simulations [20]. However, as discussed in [15], the AO theory is an approximation that remains quite accurate up to , with representing the fraction of volume occupied by the crowding molecules. As far as the value inside a living cell has been estimated between 0.2-0.3 [21, 22] we can safely use in the following the simpler AO description of depletion effects.
Since the two splicing complexes are joined by a freely fluctuating RNA chain the depletion-based interaction becomes effectively long range, with a logarithmic dependence on the chain length. We suggest that this depletion attraction is the driving force which allows the splicing complexes to meet and join one another, in order to start up the splicing process. As we shall see this assumption naturally leads to a smooth cross-over from an intron defined to an exon defined splicing pathway as the chain length increases.
2.1 Presentation of the model
Let us model, as a first approximation, the pre-mRNA as a Freely Jointed Chain (FJC) [23, 24], i.e a succession of infinitely penetrable segments, each of length equal to the Kuhn length of the single strand RNA (ssRNA). The estimated Kuhn length of ssRNA is approximately in the range 2-4 nm, i.e 3-6 nt [25, 26, 27]. We chose to neglect the self avoidance in order to use the analytical tractable FJC and moreover the diameter of ssRNA, approximately 2 nm, is not so relevant with respect to long chains: as reported in [25, 28] the FJC modelization is suitable for ssRNA chains with a length greater than 5-6 Kuhn segment, as will always be the case in the following.
The two complexes, composed by U1, U2 and
splicing factors, that bind to the exon/intron
boundary in the intron definition process, will be modeled as spheres with a diameter (the
dimensions of the major components U1 and U2 are quite similar, both of the order of nm,
see [29] and [30] for details).
The same geometrical approximation will be done for complexes constructed across exons in exon definition.
They will be considered as spheres of diameter , with since
they are composed by both the U1 and the U2 subcomplexes plus the exon in between, usually with SR proteins bound to it [8].
The simple FJC model allows the analytical calculation of the radial probability distribution of the end-to-end distance [23]:
| (1) |
where , is the number of indipendent segments in the FJC and is the length of a segment (in our case the Kuhn length of mRNA). Following [31], in order to include the depletion attraction contribution, we weighed the radial probability distribution of the end-to-end distance (we assume that the ends of the intron can be considered as the center of the beads) with a Boltzmann factor, which takes into account the depletion attraction potential and which is non-zero in the range . This potential is easy to evaluate in this “hard sphere” approximation (see for instance [17]) and takes a particularly simple expression in the limit. We can therefore define a new function as the weighed FJC radial probability distribution:
| (2) |
where denotes the volumetric concentration of the small molecules and their typical size. With the typical values of these quantities for the nuclear environment: and one finds for the problem at hand a potential energy of the order of one hydrogen bond, which is exactly in the range of energies needed to join together the two ends of an intron of length of about 10 Kuhn length (equivalent to 50 nucleotides).
Passing to the variabile (distance from the surfaces of the two spheres), we construct our probability distribution as:
| (3) |
which can be simply normalized as:
| (4) |
It’s now straigthforward to define the looping probability as the probability of finding the surfaces of the two beads at the end of the chain within a sufficiently short distance (choosen as 5 nm in the following, in line with [31]):
| (5) |
We reported the equations for the case for the sake of simplicity, but in the numerical estimates reported in the following sections we used the full effective potential of depletion attraction taken from [16].
The appealing feature of this model is that it introduces in a natural way a logarithmic relation between the intron length and the dimensions of spliceosome subcomplexes attached to its ends, if we constrain the system to keep a fixed looping probability.
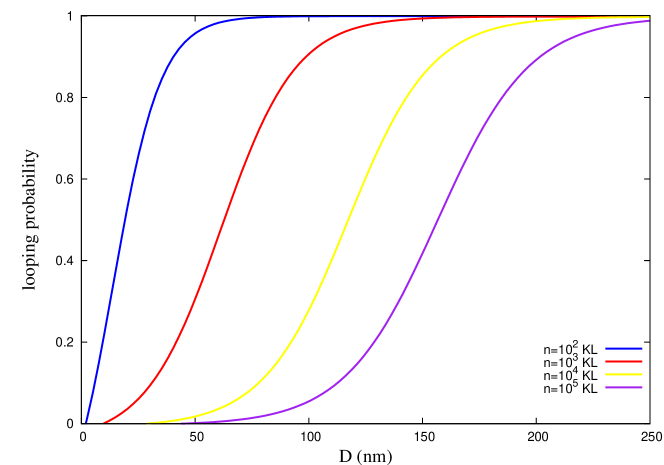
This can be seen by looking at figure 3 where we plotted the looping probability for different intron lengths as a function of the diameter of the spheres attached to its ends. If we increase the intron length of an order of magnitude the beads’ diameter must be enlarged by a (roughly constant) multiplicative factor in order to obtain the same looping probability. This observation may be used to explain the switch from intron to exon definition as the intron length increases. When the intron length becomes too large the dimensions of merely U1 and U2 subcomplexes is not sufficient to ensure a reasonable looping probability. This does not mean that such a process is forbidden but simply that it would require much longer times. For large enough introns it becomes more probable that the two complexes instead join across the exon (a process mediated again by the depletion attraction), if it is sufficiently short. The complexes constructed across exons can actually result large enough to maintain a suitable looping probability, even in the case of long introns.
2.2 Towards a more quantitative model: a compromise between soft and hard hypothesis
Looking at figure 3 we see that while the model works nicely from a qualitative point of view it predicts intron lengths which are slightly smaller than those actually observed. In fact, in order to make the model more realistic and to be able to obtain also a quantitative agreement with the data, we must take into account two other ingredients. The first one is that pre-mRNAs can be bound to various regulatory proteins which have the effect of increasing their Kuhn length. Unfortunately no direct estimate of the Kuhn length in this conditions exists, thus to obtain the curves reported in figure 3 we were compelled to use the Kuhn length of pure ssRNAs. Hence the intron length reported in the figure should be better considered as lower bounds.
The second one is that the splicing (sub)complexes are rather far from the hard sphere approximation. If the irregular shape of the molecules allows a snugly fit or if parts of the two subcomplexes can intermingle, the free energy gain will be larger. Again this suggests that our results should be better considered as lower bounds. In this case however we can slightly improve our model and obtain also a reliable upper bound for our looping probability. The maximal relaxation of the hard hypothesis can be achieved considering that the two spheres can fuse with volume conservation (soft hypothesis). While we can’t actually write the analytical expression of the potential in this “soft beads” case, it’s undemanding to calculate the free energy gain obtained by the complete fusion of the two spheres. It’s directly related to the portion of volume that becomes available to the crowding molecules:
| (6) |
Following again [31] we may at this point assume that the functional dependence on of the potential is the same as in the hard-hypothesis scenario and that the free energy gain reported in equation 6 can be a good estimate of the variation of the potential from zero at to its maximal absolute value at (i.e. when the beads are in contact). Starting from these resonable assumptions we may write the weighted radial probability distribution as in equation 2, by simply substituting the maximal free energy gain of the hard beads scenario (which is proportional to ) with that of equation 6 :
| (7) |
2.3 The intron length distribution of higher Eukaryotes
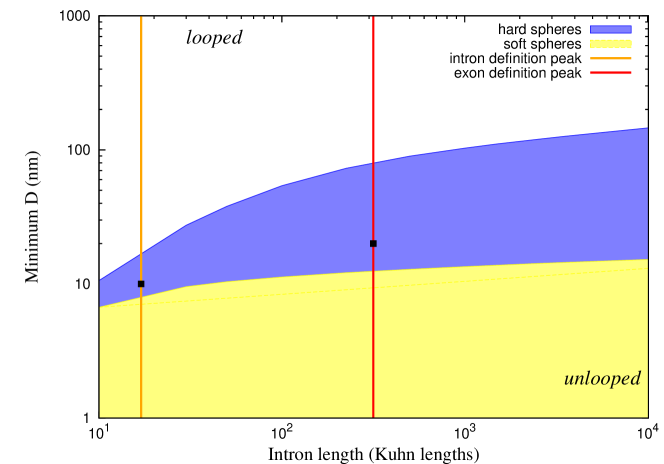
If the depletion attraction plays a role in exon juxtaposition, the typical length of introns with different splicing fate should be in a range suitable to obtain an high looping probability, given the diameter of the beads attached to their ends. In figure 4 we report the diameter of the beads needed to have a looping probability of 99%, in the hard sphere hypothesis (blue line) and soft sphere hypothesis (yellow line).
To be more precise, the two colored regions represent the D values, obtained by numerical integrations for different intron lengths, for which (see equation 5), with the radial probability distributions (described by equation 4), derived starting from equation 2 (hard-sphere) or from equation 7 (soft-sphere).
In figure 4 we also plot two vertical lines corresponding to the intron lengths of the left and right peak of the distribution in figure 2 as typical values for the introns devoted to intron definition and exon definition respectively. Remarkably enough in both cases the actual dimensions of the splicing complexes (the black dots along the vertical lines in the figure) lie exactly in between the two bounds. Moreover looking at the curves it is easy to see that moving from the first to the second peak, the subcomplexes size must increase roughly of the amount actually observed in the transition from intron definition to exon definition in order to keep the same looping probability.
Obviously many other types of specific and elaborate regulation of the splicing dynamic are present in the cell, but the ATP-free depletion attraction could explain the widespread importance of the aspecific intron length variable and the necessity of exon definition when the intron length is increased.
Another interesting extension of the model that we propose occurs if the U1 and U2 subcomplexes can form intermolecular bonding. In this case there would be an additional force driving the intron looping, besides depletion attraction. Unfortunately, even if it is likely that such an interaction is present, there is yet no definitive experimental evidence supporting it and, what is more important for our purposes, the nature and form of its potential is still unclear. In particular even the occurrence of a direct interaction is still under debate: while evidences of such an interaction were proposed in some early paper [32, 33], more recent works suggest instead that intermediate protein(s) are needed to mediate the interaction. For instance the need of the protein Prp5 acting as a bridge between U1 and U2 was recently discussed in [34, 35]. In any case, once the interaction potential will be known, it will be rather straigthforward to generalize our model keeping it into account by suitably modifying the Boltzmann factor in equation 3. Generally speaking, protein-protein interactions are usually short-range (for example an hydrogen bond is formed at distances of the order of 0.1-1 nm) and in a range of energy compatible with the energy gain due to depletion attraction (see section 2.1). Thus we may safely predict that an additional short-range attraction would only lead to an overall increasing of the looping probability. Qualitatively the effect would be a left translation of the curves in figure 3 and a lowering of the curves in figure 4, but this would not change the main results of this paper. As a matter of fact only a contribution of the depletion attraction type, introducing a dependence of the looping probability on the diameter of subcomplexes, could explain the switch from intron definition to exon definition.
2.4 Size constraints on introns and exons
Following the idea that the choice of exon or intron definition is related to the looping probability,
it is expected that organisms which prevalently use intron definition present a strict constraint on their intron
length but not on their exon length, while the opposite is expected for organisms that prevalently use exon definition. As reported in many previously
published studies ([5, 8, 12, 13] and reference therein) lower Eukaryotes, that prevalently choose intron definition, present a genomic
architecture typified by small introns with flanking exons of variable length. Higher Eukaryotes have the intron length distribution shown in figure
2, with the vast majority of introns devoted to exon definition (see table 1), but a strictly conserved distribution
of exon length, with a single peack around 100 nt. As shown in the upper right panel of figure 5, the position of the typical exon length
is approximately the same of the length of introns devoted to intron definition. These values, as discussed above, ensure an high probability of juxtapose
the two U1 and U2 subcomplexes.
In the case of lower Eukaryotes (three examples in figure 5) the intron length distribution presents a single narrow peak in a range compatible
with high probability of looping. At the same time no constraint on exons are necessary and indeed the distribution of exons’ length is quite broad with a long
tail towards large lengths.
If the dimensions of merely the U1 and U2 subcomplexes are not enough to ensure an high looping probability across the intron, the exon length is constrained to
values that give a sufficient looping probability across the exon, allowing the construction of a larger subcomplex that can then lead to the looping of long
introns, as discussed in the previous section.
2.5 Cooperative effects
So far we completely neglected the cooperative effects that could arise from the presence of more than two beads on the mRNA string. As discussed in [31], the pairing of more than two beads moves the energetic balance towards the free energy gain. For example, clustering three beads implies three excluded volumes that overlap, but only two loops that have to be closed; four beads give a sixfold free energy gain at the cost of closing only three loops, and so forth. However self avoidance cannot be neglected in this case, as the increasing number of intron chains progressively makes the looping more energetically expensive. As observed in [31] (and reference therein) in three dimensions the entanglement constraints become important when more than eight beads cluster together. Above this threshold the free energy gain/loss ratio starts to decrease, setting the optimal number of beads around eight. In the framework of exon-defined splicing, each bead corresponds to a complex constructed across an exon. Remarkably enough the median value of the number of exons per gene is strongly conserved in higher Eukaryotes (which make an extensive use of exon-defined splicing) and almost coincides with the optimal number of beads in the depletion attraction model (see table 1 and figure 6). The same is not true for lower Eukaryotes that prevalently use intron definition as shown in table 2 for three model organisms.
| Species | Median | Mean of the gaussian fit | Percentage of exon-def introns |
|---|---|---|---|
| Homo sapiens | 8 | 7.7 | 84 |
| Canis familiaris | 8 | 7.2 | 78 |
| Pan troglodytes | 8 | 7.8 | 83 |
| Danio rerio | 8 | 6.7 | 66 |
| Macaca mulatta | 8 | 6.5 | 79 |
| Mus musculus | 7 | 6.8 | 84 |
| Rattus norvegicus | 7 | 6.6 | 78 |
| Gallus gallus | 8 | 6.7 | 83 |
| Bos taurus | 8 | 6.8 | 81 |
| Species | Median | Percentage of exon-def introns |
|---|---|---|
| Anophele Gambiae | 3 | 34 |
| Drosophila melanogaster | 3 | 37 |
| Caenorhabditis elegans | 6 | 40 |
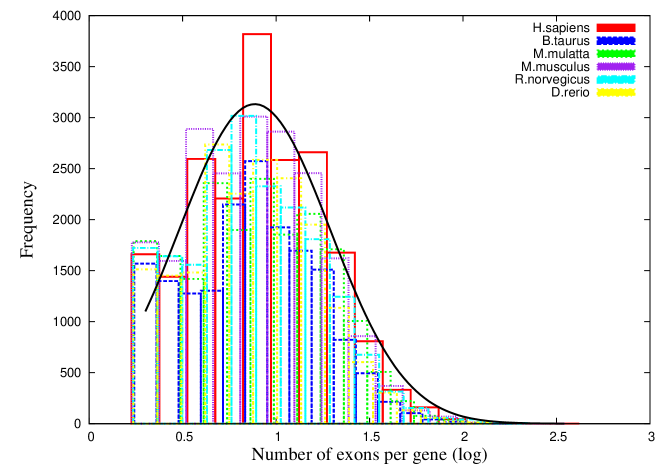
Many more refined and energetically costing mechanisms of splicing are surely present in the cell, and many genes present a huge number of exons (up to about 490 in human), but the fact that the typical value is mantained in different organism around, or just below, eight, as predicted by the model, seems to suggests an evolutionary attempt to mantain the number of beads that maximise the depletion attraction effect in exon juxtaposition. Our simple modelization does not ensure the joining of exons in the specific order given by the pre-mRNA transcript, allowing the possibility of scrumbled exons in the mature mRNA. Despite the fact that there are several cases reported in literature of this scrumbling of exons [36, 37, 38], the spliced mRNA usually reproduce the original sequence of exons in the DNA gene, eventually with exon skipping or other splicing variations which however do not affect the exons’ order. This is probabily due to the coupling of splicing to transcription by RNA polymerase [39], which naturally introduces a polarity in the transcript and makes the exons available to the splicing machinery in a sequential manner.
3 Conclusions and discussion
We presented a model that highlights the possible role of depletion attraction in the splicing process and we showed that this entropic
contribution can explain also quantitatively some empirical and bioinformatical observations.
Spliceosomal introns can perform various functions [40, 41, 42, 43, 44] and the resulting selective forces to mantain
or introduce introns during evolution can explain the genome architecture of higher Eukaryotes, characterized by many introns with a typical
large size. The necessity to attain a high regulatory capacity within introns can for example explain the average increase of intron size in
the mammal branch of the tree of life [45]. At the same time another splice-site recognition modality has been introduced in higher
Eukaryotes: the exon definition. In the perspective of our model the exon definition pathway was selected by evolution as the simplest way to
mantain a balance between the free energy gain due to depletion attraction and the free energy loss caused by looping longer introns. As shown
in section 2.3 the relation between the dimensions of spliceosome subcomplexes and typical intron lengths is in good agreement
with our model predictions. With similar arguments we are able to explain the constraints on exons’ length: if the length of introns increases,
decreasing their looping probability, the system is compelled to mantain an exons’ length suitable for the looping, which is essential to pass to
exon definition and obtain diameters of subcomplexes sufficiently large to accomplish the exon juxtaposition.
On the other hand several selective forces can also favour short introns, for example the high fitness of short introns can be due to a reduction
of the time and energy cost of transcription and splicing [46], if the conditions favour economy over complexity as in the case of highly
expressed genes. Despite the possible selective forces behind - extensively discussed in the case of Drosophila melanogaster in [47, 48, 49]-
usually the introns of lower Eukaryotes have been maintained short by evolution. At the same time, there are no evidences of constraints on exon length, a
behaviour again perfectly compatible with our model: the complexes on intron boundaries have a dimension which is sufficient to loop the short introns and
proceed with the splicing, so no constraint on exons’ length is required.
Moreover evolution led to a proliferation of the number of introns in higher Eukaryotes, leading to the genomes with the highest density of introns per
gene [50]. This contributes significantly to their proteome complexity [6, 51]: a gene with many exons can be spliced in many alternative
ways to produce different protein products from a single gene. Notwithstanding this, the typical number of exons per gene seems constrained around eight in
those species that make an extensive use of exon definition. This coincides precisely with the number that allows an optimal exploitation of the depletion
attraction in exon juxtaposition. This result may suggest a trade off between the advantages of a high number of exons - in terms of complexity - and the
usage of the uncosting entropic effect of depletion in the splicing process.
References
References
- [1] M.J.Schellenberg et al., Trends Bioch Sci 33,(2008) 243.
- [2] M.C. Wahl, C.L. Will and R. Lührmann, Cell 136, (2009) 701-718.
- [3] L.D. Black, Annu Rev Biochem 72 (2003) 291-336.
- [4] L. Collins. D. Penny, Mol Biol Evol 22 (2005) 1053-1066.
- [5] S.M. Berget, J Biol Chem 270,(1995) 2411-2414.
- [6] G. Ast, Nat Rev Genet 5, (2004) 773-782.
- [7] Ram O, G. Ast, Trends Genet 23, (2007) 5-7.
- [8] K.J.Hertel, J Biol Chem 283,(2008) 1211-1215.
- [9] P.Flicek et al., Nucl Acids Res 36:,(2008) D707-D714.
- [10] K.L.Fox-Walsh, Y. Dou, B.J. Lam, S.Hung, P.F. Baldi, K.J. Hertel, Proc Natl Acad Sci USA 102,(2005) 16176-16181.
- [11] L. Collins, D. Penny, Mol Biol Evol 23, (2006) 901-910.
- [12] A.M. McGuire, M.D. Pearson, D.E. Neafsey, J.E. Galagan, Genome Biol 9, (2008) R50.
- [13] L.P. Lim, C.B. Burge, Proc Natl Acad Sci USA 98, (2001) 11193-11198.
- [14] N.J. Sakabe, S.J. Souza, BMC Genomics 8, (2007) 59.
- [15] D.Marenduzzo, K. Finan, P.R. Cook, J.Cell Biol. 175,(2006) 681-686.
- [16] S.Asakura and F.Oosawa, J Chem Phys 22,(1954) 1255.
- [17] S. Asakura, F. Oosawa, J Polym Sci 33, (1958) 183-192.
- [18] P.Attard, G.N.Patey, J Chem Phys 92, (1990) 4970.
- [19] B.Gotzelmann, R.Evans,S.Dietrich, Phys Rev E 57, (1998) 6785-6800.
- [20] R.Dickman,P.Attard,V.Simonian, J.Chem.Physics 107,(1997) 205-213.
- [21] R.J.Ellis, Trends Biochem Sci 26, (2001) 597-604.
- [22] A.P.Minton, J Biol Chem 256, (2001) 10577-10580.
- [23] Cantor and Schimmel, Biophysical Chemistry PartIII (W.H. Freeman and Company, 1980) .
- [24] P.J. Flory, Statistical mechanics of chain molecules (Wiley, 1969).
- [25] K.Rippe, Trends Bioch Sci 26,733-740,(2001).
- [26] J.Liphardt, B.Onoa, S.B. Smith,I. Tinoco Jr,C. Bustamante, Science 292,(2001) 733-737.
- [27] J. B. Mills, E. Vacano, P. J. Hagerman, J Mol Biol 285,(1999) 245-257.
- [28] K. Rippe, P.H. von Hippel, J. Langowski, Trends Biochem Sci 20, (1995) 500-506.
- [29] J.Sperling, M. Azubel,R. Sperling, Structure 16,(2008)1605-1615.
- [30] B.Kastner, M.Bach, R. Lührmann, Proc Natl Acad Sci USA 87,(1990) 1710-1714.
- [31] D.Marenduzzo, C. Micheletti, P.R. Cook, Biophys J 90,(2006) 3712-3721.
- [32] I.W.Mattaj, W.J.Habets, W.J.van Venrooij, EMBO J 5,(1986) 997-1002.
- [33] M.Daugeron, J.Tazi, P. Jeanteur, C. Brunel, G.Cathala, Nucl Acids Res 20,(1992) 3625-3630.
- [34] Y.Xu, C.M.Newnham, S.Kameoka, T. Huang, M.M.Konarska, C.C. Query, EMBO J 23, (2004) 376-385.
- [35] G.Dönmez, K.Hartmuth, B.Kastner, C.L.Will, R.Lührmann, Molecular Cell 25, (2007) 399-411.
- [36] Nigro J.M., Cho K.R., Fearon E.R., Kern S.E., Ruppert J.M., Oliner J.D., Kinzler K.W., Vogelstein B., Cell 64, (1991) 607–613
- [37] Cocquerelle C., Daubersies P., Majerus M., Kerckaert J.P., Bailleul B., EMBO J 11, (1992) 1095–1098
- [38] X. Shao, V. Shepelev,A. Fedorov, Bioinformatics 22, (2006) 6:692-698
- [39] A.R. Kornblihtt, M. de la Mta, J.P. Fededa, M.J. Munoz, G. Nogues, RNA 10, (2004) 1489-1498
- [40] S.W. Roy, W. Gilbert, Nat Rev Genet 7, (2006) 211-221.
- [41] L. Federova, A. Federov, Curr Genomics 6, (2005) 589-595.
- [42] C. Zhao, T. Hamilton, J Biol Chem 282, (2007) 20230-20237.
- [43] M. Lynch, A. Kewalramani, Mol Biol Evol 20, (2003) 563-571.
- [44] M. Lynch, Mol Biol Evol 23, (2006) 450-468.
- [45] U.Pozzoli, G.Menozzi, G.P. Comi, R. Cagliani,N. Bresolin,M. Sironi, Trends Genet 23,(2006) 1:20-24.
- [46] C.I. Castillo-Davis, Mekhedov S.L.,D.L. Hartl, E.V. Koonin, F.A. Kondrashov, Nat Genet 31, (2002) 415-418.
- [47] G. Marais, P. Nouvellet, P.D. Keightley, B. Charlesworth, Genetics 170, (2005) 481-485.
- [48] J. Parsch, Genetics, 165, (2003) 1843-1851.
- [49] D.L. Halligan, P.D. Keightley, Genome Res 16, (2006) 7:875–884.
- [50] Koonin, Int J Biochem Cell Biol 41,(2009) 2:298-306
- [51] B. Modrek, C. Lee, Nat Genet 30,(2002) 13-19.