Search for clustering of ultra high energy cosmic rays from the Pierre Auger Observatory
Abstract
We present the results of a search for clustering among the highest energy events detected by the surface detector of the Pierre Auger Observatory between 1 January 2004 and 31 August 2007. We analyse the autocorrelation function, in which the number of pairs with angular separation within an angle is compared with the expectation from an isotropic distribution. Performing a scan in energy above 30 EeV and in angles , the most significant excess of pairs appears for EeV and for a wide range of separation angles, . An excess like this has a chance probability of % to arise from an isotropic distribution and appears at the same energy threshold at which the Pierre Auger Observatory has reported a correlation of the arrival directions of cosmic rays with nearby astrophysical objects.
1 Introduction
The identification of the sources of the ultra high energy cosmic rays has been one of the main open problems in astrophysics since their discovery. The study of their arrival directions is likely to provide significant insight into this question.
If cosmic rays are charged particles, protons or heavier nuclei, their trajectories are expected to be bent by the intervening galactic and extragalactic magnetic fields, and their arrival directions will not point back to their sources. The intensity and orientation of these fields are not well known, but as the deflections are inversely proportional to the energy, the effect is smaller at the largest energies. Thus, it is at the highest energies that cosmic ray arrival directions are most likely to trace their sources.
On the other hand, the distance from which ultra high energy protons can arrive to the Earth is expected to be limited by the energy losses caused by the photo-pion production processes in the interaction with the cosmic microwave background (Greisen Zatsepin Kuzmin, GZK effect [1]), and similarly nuclei can undergo photo-disintegration processes. Hence, at energies above EeV, cosmic rays should mostly come from nearby sources (closer than Mpc).
These ideas have motivated an extensive search for clustering signals at high energies looking for excesses in the number of pairs at different angular scales. Small angular scale searches essentially look for cosmic rays coming from the same source which would be the expected signal from the strongest nearby sources. At intermediate angular scales, a clustering signal would be an evidence of the pattern characterising the distribution of the nearby sources, with pairs of events resulting from cosmic rays coming from different sources. The angular scale up to which we can expect that pairs of events come from the same source depends on the energy of the events, on the (unknown) magnitude of intervening magnetic fields, and on the cosmic ray composition.
Although the data from a number of experiments have shown a remarkably isotropic distribution of arrival directions, there has been a claim of small scale clustering at energies larger than EeV by the AGASA experiment [2]. The most recent published analysis [3] reports 8 pairs (five doublets and a triplet) with separation smaller than among the 59 events with energy above 40 EeV, while 1.7 were expected from an isotropic flux. The probability for this excess to happen by chance was estimated to be less than . The significance of the AGASA clustering result was, however, subject of debate based on the concern that the energy threshold and angular separation were not fixed a priori. Tinyakov and Tkachev [4] computed the penalisation arising from making a scan in the energy threshold and obtained a probability of . Finley and Westerhoff [5] took also into account the penalisation for a scan in the angular scale and obtained a probability of . The HiRes observatory has found no significant clustering signal at any angular scale up to for any energy threshold above EeV [6]. A hint of correlation at scales around and energies above EeV, combining data from HiRes stereo, AGASA, Yakutsk and SUGAR experiments has been pointed out in Refs. [7, 8].
The Pierre Auger Observatory, whose construction has recently been completed in Argentina, has been taking data since January 2004. Its integrated exposure, up to the end of August 2007, is 9000 km2 yr sr, representing the largest one ever attained by an extensive air shower array at ultra high energies. Thanks also to its angular and energy resolutions it offers an excellent data set for studies of anisotropies in the arrival directions.
We apply here the autocorrelation technique to the events with energy above 30 EeV, scanning over energy threshold and angular separation (up to ), with the aim of searching for possible clustering in the arrival directions. A preliminary analysis has been presented in Ref. [9].
The most clear anisotropy signal of the arrival directions of high energy events (with EeV) has been reported by the Auger collaboration [10, 11] through a completely independent method by studying their correlation with the nearby extragalactic matter distribution. The observed correlation with nearby AGNs from the Véron-Cetty and Véron catalog [12] was shown to be incompatible with an isotropic distribution at more than CL. The autocorrelation analysis discussed here does not depend on an a priori selection of the possible sources location and, therefore, gives complementary information with respect to that analysis.
2 The observatory and the data set
The Pierre Auger Southern Observatory is located in the Province of Mendoza, Argentina, at 35.1∘–35.5∘ S, 69.0∘–69.6∘ W and 1300–1400 m a.s.l. The growing observatory has been in operation since 2004: the data presented here refer to the period between 1 January 2004 and 31 August 2007, during which the number of surface stations was increasing from 154 to 1388. The surface detector consists of 10 m 1.2 m water Cherenkov tanks spaced by 1500 m, covering an area that in the period of interest ranged from about 200 km2 to around 3000 km2. While the experiment has been described in detail elsewhere [13], the relevant features with respect to the present analysis will be outlined here.
The trigger requirement for the array is based on a 3-fold coincidence, that is satisfied when a triangle of neighbouring stations is triggered. The 50% contamination from accidental events is obviated by an appropriate event selection [14], whose power for selecting real showers is larger than 99%.
The arrival directions of the showers are obtained through the time of flight differences among the triggered stations. The angular resolution, defined as the angular radius around the true cosmic ray direction that would contain of the reconstructed shower directions, is calculated on an event by event basis and checked through the correlations with the fluorescence detector. It depends on the number of triggered stations and is better than 2∘ for 3-fold events ( 4 EeV), better than 1.2∘ for 4-folds and 5-folds events ( EeV) and better than 0.9∘ for higher multiplicity events ( 10 EeV) [15].
The estimator for the primary energy is the reconstructed signal at 1000 m from the shower core [16]. The conversion from this estimator to energy is derived experimentally through the use of a subset of showers detected by both the surface and the fluorescence detectors [16]. The energy resolution is 18% and the absolute energy scale has a systematic uncertainty of 22% [17].
In the present analysis, we apply the following cuts to the events:
-
•
zenith angle ;
-
•
core location within the array boundaries: reconstructed core within a triangle of active stations and station with the highest signal surrounded by at least 5 active tanks;
-
•
reconstructed energy EeV.
After these cuts there are 203 events above 30 EeV and 81 events above 40 EeV. For these events the surface detector trigger efficiency is 100%. The acceptance is fully saturated and is determined by purely geometrical considerations [18], thus allowing an accurate calculation of the exposure even with a changing array configuration. The exposure is flat as a function of , where is the zenith angle, and it is nearly uniform as a function of the azimuth angle . There is a small modulation of the flux in right ascension due to the dead times and the growth of the array during the data taking period, but this effect is small, below , and can be ignored in the present analysis.
3 The autocorrelation function analysis
3.1 The method
A standard tool for studying anisotropies is the two-point angular correlation function. In the following we will use the correlation function given by the number of pairs separated by less than an angle among the events with energy larger than a given threshold ,
| (1) |
where is the angular separation between events and and is the step function. The expected number of pairs and the CL error bars are obtained by generating a large number () of Monte Carlo simulations with the same number of events as in the real data set, isotropically distributed and modulated by the exposure of the detector. The chance probability for any excess of pairs at a fixed angle and energy threshold is found from the fraction of simulations with a larger or equal number of pairs than what is found in the data at the angular scale of interest.
The result of the autocorrelation function analysis depends on the chosen values of and . The fact that the deflections expected from galactic and extragalactic magnetic fields and the distribution of the sources are largely unknown prevents us from fixing these values a priori. The significance of an autocorrelation signal at a given angle and energy, when these values have not been fixed a priori, is a delicate issue that has made, for example, the significance of the AGASA small scale clustering claim very controversial. We adopt here the method proposed by Finley and Westerhoff [5], in which a scan over the energy threshold and the angular separation is performed. For each value of and , we compute the fraction of simulations having an equal or larger number of pairs than the data by generating simulated isotropic data sets modulated by the exposure. The fraction takes here the role of the distance between the experimental and expected distributions as used in the Kolmogorov-Smirnov test. The most relevant clustering signal corresponds to the values of and that have the smallest value of , referred here to as . To establish the statistical significance of this deviation, it is necessary to account for the fact that the angular bins, as well as the energy ones, are not independent. To do that, we perform 105 isotropic simulations with the same number of events as the data and calculate for each realisation the most significant deviation . The statistical significance of the deviation from isotropy is the integral of the normalised distribution above . We can then estimate the probability that such clustering arises by chance from an isotropic distribution just from the fraction of simulations having .
3.2 Results
To study the autocorrelation function using the scan technique we have to fix the range of the parameter space that we explore. We scan up to in the angular scale, what includes the range where small scale signals from point sources and intermediate angular scale signals from clustering of the sources are expected to appear. We scan on energies above 30 EeV: this range probes the high energy region where anisotropies are expected in the astrophysical sources scenario, and goes down enough to cover the energy range where past anisotropy claims with data from previous experiments using a similar technique were made, allowing for a possible energy calibration difference of up to 30% between the experiments. We therefore compute the number of pairs as a function of the separation angle from to in steps of , and as a function of the number of events starting from the 10 highest energy events and adding events one by one in decreasing energy order up to 100 events, and in groups of ten up to 200 events, corresponding to a threshold energy of 30 EeV, and then compare them with isotropic distributed simulations.
—
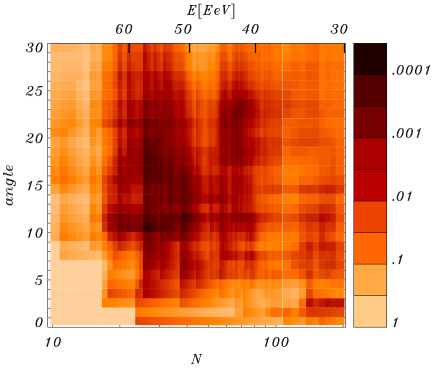
In figure 1 we present the fraction of simulations with more pairs than the data as a function of the angular scale and the number of events (or equivalently the energy threshold).
A broad region with an excess of pairs appears for energies above around 50 EeV, at angular scales between about to . In particular, the minimum value of () is found for the 27 highest energy events (corresponding to EeV), for (18 observed pairs against 5.2 expected).


In Figure 2 the autocorrelation function (upper panel) and the fraction of isotropic simulations with equal or larger number of pairs than the data (lower panel) is shown for these 27 events as a function of the angular scale. The broad region of low values of () is visible between 9∘ and 22∘, with the minimum at 11∘.
The chance probability of a to arise from an isotropic distribution was estimated by performing the same scan to simulations, and it is .
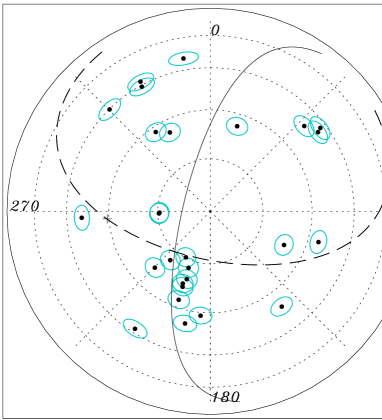
Figure 3 shows the arrival directions of the 27 events with 57 EeV in equatorial coordinates centered in the south pole. The galactic and supergalactic planes are displayed by the dashed and solid lines respectively. Circles of around each event guide the eye to identify pairs separated by less than . The arrival directions and energies of the 27 events are listed in the Appendix of [11].
The analysis of the autocorrelation function shows in particular no significant clustering signal at the small angular scales corresponding to the AGASA claim. At energies above 40 EeV, with 81 detected events, we observe 4 pairs within , while 2.5 were expected from an isotropic flux (with a fraction of isotropic simulations showing a larger or equal number of pairs). Due to a possible difference in the energy calibration between AGASA and Auger, the clustering signal reported by AGASA could appear in Auger data at a lower energy scale. For energies above 30 EeV the observed number of pairs is 23, while the isotropic expectation is 16 (). This excess is much smaller than the one reported by AGASA.
4 Conclusions
Using the events recorded by the surface detector of the Pierre Auger Observatory between January 2004 and Augist 2007 we have performed a scan to search for possible clustering using the autocorrelation technique. The scan has been performed in energy (above 30 EeV, 203 events detected) and angular separation (between 1∘ and 30∘). The most significant excess of pairs is found for EeV (corresponding to 27 events) and , with a chance probability of to arise from an isotropic distribution. Above this energy we observe, in fact, a broad region of low probabilities, for angular scales between and . At higher energy thresholds the chance probabilities become larger, however the number of events becomes rather limited. At lower energies the autocorrelation function becomes progressively closer to that expected from an isotropic flux.
It should be noted that the energy threshold that maximises the significance is the same one as the energy at which the Pierre Auger collaboration has observed a departure from isotropy using the correlation of the arrival directions of events with nearby AGNs. It is also the energy at which the cosmic ray flux at ultra high energies reported by the Pierre Auger collaboration [16] is suppressed by 50% compared to a power law extrapolation of the flux measured at lower energies. This suppression, if interpreted as due to the GZK horizon [1], would imply that nearby sources dominate the flux at these energies. As the matter distribution in the nearby Universe becomes increasingly anisotropic for smaller distances, it is to be expected that the ultra high energy cosmic ray sky should become anisotropic at these energies, reflecting the pattern of the distribution of the sources.
References
- [1] K. Greisen, Phys. Rev. Lett. 16 (1966) 748; G. T. Zatsepin and V. A. Kuzmin, JETP Lett. 4 (1966) 78.
- [2] N. Hayashida et al. [AGASA Collaboration], Phys. Rev. Lett. 77 (1996) 1000.
- [3] M. Teshima et al. [AGASA Collaboration], Proc 28th ICRC, Tsukuba, Japan (2003), 437.
- [4] P. G. Tinyakov and I. I. Tkachev, JETP Lett. 74 (2001) 1 [Pisma Zh. Eksp. Teor. Fiz. 74 (2001) 3], arXiv:astro-ph/0102101.
- [5] C. B. Finley and S. Westerhoff, Astropart. Phys. 21 (2004) 359.
- [6] R. U. Abbasi et al. [The High Resolution Fly’s Eye Collaboration (HIRES)], Astrophys. J. 610, L73 (2004).
- [7] M. Kachelriess and D. V. Semikoz, Astropart. Phys. 26, 10 (2006).
- [8] A. Cuoco, G. Miele and P. D. Serpico, Phys. Rev. D 74 (2006) 123008; A. Cuoco, G. Miele and P. D. Serpico, Phys. Lett. B 660 (2008) 307.
- [9] S. Mollerach et al. [Pierre Auger Collaboration], Proc. 30th ICRC, Mérida, Mexico (2007), arXiv:0706.1749.
- [10] Pierre Auger Collaboration, Science 318 (2007) 938.
- [11] Pierre Auger Collaboration, Astropart. Phys. 29, 188 (2008).
- [12] M.-P. Véron-Cetty and P. Véron, Astron. and Astrophys. 455 (2006) 773.
- [13] J. Abraham et al. [Pierre Auger Collaboration], Nucl. Inst. and Meth. A523 (2004) 50.
- [14] D. Allard et al. [Pierre Auger Collaboration], Proc. 29th ICRC, Pune, India, 7 (2005) 287.
- [15] C. Bonifazi et al. [Pierre Auger Collaboration], these proceedings.
- [16] J. Abraham et al. [Pierre Auger Collaboration], Phys. Rev. Lett. 100, 061101 (2008).
- [17] B. Dawson et al. [Pierre Auger Collaboration], Proc. 30th ICRC, Mérida, Mexico (2007), arXiv:0706.1105.
- [18] D. Allard et al. [Pierre Auger Collaboration], Proc. 29th ICRC, Pune, India, 7 (2005) 71.