Spitzer Spectroscopy of Circumstellar Disks in the 5 Myr Old Upper Scorpius OB Association
Abstract
We present mid-infrared spectra between 5.2 and 38 m for 26 disk-bearing members of the 5 Myr old Upper Scorpius OB association obtained with the Infrared Spectrograph (IRS) onboard the Spitzer Space Telescope. We find clear evidence for changes in the spectral characteristics of dust emission between the early (B+A) and late-type (K+M) infrared excess stars. The early-type members exhibit featureless continuum excesses that become apparent redward of 8 m. In contrast, 10 and 20 m silicate features or PAH emission are present in all but one of the late-type excess members of Upper Scorpius. The strength of silicate emission among late-type Upper Scorpius members is spectral type dependent, with the most prominent features being associated with K5–M2 type stars. By fitting the spectral energy distributions (SED) of a representative sample of low-mass stars with accretion disk models, we find that the SEDs are consistent with models having inner disk radii ranging from 0.2 to 1.2 AU. Complementary high resolution () optical (4800–9200) spectra for the Upper Scorpius excess stars were examined for signatures of gaseous accretion. Of the 35 infrared excess stars identified in Upper Scorpius, only 7 (all late-type) exhibit definitive signatures of accretion. Mass accretion rates () for these stars were estimated to range from to M⊙ yr-1. Compared to Class II sources in Taurus-Auriga, the disk population in Upper Scorpius exhibits reduced levels of near and mid-infrared excess emission and an order of magnitude lower mass accretion rates. These results suggest that the disk structure has changed significantly over the 2–4 Myr in age separating these two stellar populations. The ubiquity of depleted inner disks in the Upper Scorpius excess sample implies that such disks are a common evolutionary pathway that persists for some time.
1 Introduction
Following initial gravitational collapse, most protostars from 10 M⊙ to the hydrogen burning limit are surrounded by optically thick disks of gas and dust, the progenitors of planetary systems. Early ground-based infrared (band) observations established that the inner disks ( 1.0 AU) around most stars have dispersed by an age of 10 Myr (Haisch et al. 2001; Mamajek et al. 2004). Observations with the Spitzer Space Telescope (Werner et al. 2004) have also demonstrated that just a few percent of near solar-mass stars older than 10 Myr exhibit dust emission from the inner 3 AU of the disk (Uchida et al. 2004; Silverstone et al. 2006; Hernandez et al. 2007). Over similar timescales, mass accretion rates decline by at least an order of magnitude or are halted altogether (Muzerolle et al. 2000; Hartmann 2005). Growing evidence from Spitzer suggests that disk evolution is also strongly mass dependent (Lada et al. 2006; Carpenter et al. 2006; Dahm & Hillenbrand 2007), such that low-mass stars (i.e. solar-mass and less massive) are capable of retaining optically thick circumstellar disks for prolonged periods relative to their more massive counterparts.
The Upper Scorpius OB association possesses several critical attributes that make it an important region for studies of disk evolution. Located 145 pc distant in the local spiral arm, Upper Scorpius is among the nearest OB associations to the Sun (Blauuw 1991; de Zeeuw et al. 1999; Preibisch & Zinnecker 1999; Preibisch et al. 2002). With an age of 5 Myr, it is the youngest of 3 sub-groups comprising the greater Scorpius OB2 or Scorpius-Centaurus OB association (de Zeeuw et al. 1999; Preibisch et al. 2002). Upper Centaurus-Lupus and Lower Centaurus-Crux, the other components of Scorpius OB2, have median ages of 17 Myr (Mamajek et al. 2002). Early-type members (B–G spectral types) of Upper Scorpius were identified by de Zeeuw et al. (1999) in their Hipparcos proper motion survey of the association. A total of 120 stars (49 B, 34 A, 22 F, 9 G, 4 K, and 2 M-type) were confirmed as members based upon their measured proper motions. Walter et al. (1994) conducted the first survey for low-mass (G–M spectral types) members of Upper Scorpius by obtaining follow-up, high resolution spectroscopy and near-infrared imaging of 69 Einstein X-ray sources spread over 7 square degrees. Of these, 28 were confirmed as pre-main sequence stars. Preibisch & Zinnecker (1999) identified 100 low-mass members of Upper Scorpius from a wide-field (160 square degrees) ROSAT X-ray survey of the association. The pre-main sequence stars were found to have a median age of 5 Myr and exhibit no evidence for a significant age dispersion. An additional 68 pre-main sequence members including many M-dwarfs were identified by Preibisch et al. (2002) using the 2dF multiobject spectrograph. Their findings suggest that the mass function of Upper Scorpius is consistent with that of the Galactic disk population. In a 150 square degree photometric and spectroscopic survey of Upper Scorpius, Slesnick et al. (2008) identified 145 new low-mass members and placed an upper limit of 3 Myr on the age dispersion of the association (see also Preibisch & Zinnecker 1999).
In a 4–16 m Spitzer survey of 204 members of the Upper Scorpius OB association with masses ranging from 0.1 to 20 M⊙, Carpenter et al. (2006) find only 35 stars with emission in excess of photospheric values at 8 or 16 m. The low-mass (0.1–1.2 M⊙) stars are associated with excess emission that is characteristic of optically thick disks found around classical T Tauri stars. Stars more massive than 1.8 M⊙ are found with weak excesses at short wavelengths indicating that the inner 10 AU are cleared of primordial dust. Such excesses are more analogous to second generation, optically-thin debris disks produced by the collision of planetesimals. Of particular interest, none of the 30 F or G-type stars (1.2–1.8 M⊙) included in the Spitzer survey exhibit infrared excess emission at wavelengths 16 m. These results imply that the mechanisms responsible for disk dispersal operate more efficiently for high mass stars than for their low-mass counterparts. Consequently, longer timescales may be available for the buildup of planetesimals and planetary systems within the terrestrial zone for stars less massive than the Sun. The stars in Upper Scorpius also lack the short-wavelength (band) excess emission characteristic of younger T Tauri stars, implying that the inner disk regions close to the star are evacuated of dust grains. Prior to the launch of Spitzer, examples of sources with cleared inner disks (so called “transition disks”) were relatively rare, but are now becoming increasingly common (e.g. CoKu Tau 4, GM Aur, DM Tau, TW Hya; see also Muzerolle et al. 2006).
Whether transition disks are a common, but short-lived evolutionary pathway or just one of many possible intermediate stages of disk evolution and planet formation is unknown. Physical processes that have been proposed as disk clearing mechanisms include: a) dust grain growth and mid-plane settling which deplete the terrestrial region of micron-sized grains; b) binarity or the formation of a giant planet that dynamically clears the inner disk of gas and dust; and c) photoevaporation of the inner disk by photospheric and accretion-generated UV and FUV flux (Najita et al. 2007). A critical step toward understanding these transition disks is evaluating the spatial distribution of remnant gas. If grain growth is responsible for the depletion of small dust grains, a gaseous inner disk should remain and accretion is expected to continue unabated. If a massive planet has formed in the terrestrial region, gaseous accretion onto the stellar photosphere would either be significantly reduced or altogether terminated by the gravitational influence of the planet, which prevents replenishment of inner disk gas. A photoevaporated disk will have similar traits, but can be distinguished from dynamical clearing by overall disk mass (Alexander et al. 2006).
In order to probe dust disk structure and gaseous accretion, we have obtained Spitzer low resolution mid-infrared spectra and Keck high resolution optical spectra for infrared excess sources in Upper Scorpius. This 5 Myr old disk-bearing population provides a sample that can be compared directly with the presumably younger Class II and III sources in the Taurus-Auriga star forming region. Identical data sets (photometry and IRS spectra) are available for both stellar populations, permitting a detailed examination of the effects of evolution upon disk structure. In §2 we describe the Upper Scorpius membership sample and provide details of the Spitzer IRS and the Keck High Resolution Echelle Spectrometer (HIRES) observations. We then discuss (§3) the observed spectral energy distributions (SED) for the members observed with IRS. Next (§4) we review accretion diagnostics and estimate for the Upper Scorpius sources observed with HIRES. We then compare (§5) the infrared excess properties of the Upper Scorpius disk sample directly with the Taurus-Auriga Class II and Class III populations from Furlan et al. (2006). Finally, we examine (§6) the dust properties of early-type Upper Scorpius excess members inferred from the photosphere-subtracted SEDs.
2 Observations and Analysis
2.1 Upper Scorpius Membership Sample
The membership sample of Carpenter et al. (2006) was compiled from Hipparcos astrometry for the early-type stars (de Zeeuw et al. 1999), color-magnitude diagrams with follow-up Li I 6708 observations for G–M type stars (Preibisch & Zinnecker 1999; Preibisch et al. 2002), and X-ray detected G–M type stars with Li I 6708 confirmation (Walter et al. 1994; Martín 1998; Preibisch et al. 1998; Kunkel 1999; Köhler et al. 2000). Given that the membership selection criteria are based upon stellar properties (proper motions, X-ray activity, Li I 6708 absorption) unrelated to circumstellar disks, it is believed that the sample is unbiased toward the presence or absence of disks. Carpenter et al. (2006) empirically established thresholds to identify infrared excess sources, which were defined as exhibiting 8–4.5 m and 16–4.5 m flux ratios that exceeded a fitted relation by 4 times the rms of the fit residuals and 4 times the internal uncertainty in the specified flux ratio. Infrared excesses were detected for 35 sources; 29 at 8 m and 33 at 16 m. Their analysis finds that 24 of 127 (19%) K and M-type stars exhibit 8 m excesses, 5 of 61 (8%) B and A-type exhibit similar excesses, while 0 of 30 F and G-type stars exhibit such excesses. At 16 m, the excess fraction is 23 of 121 (19%) K and M-type stars, 10 of 52 (19%) B and A-type stars, and 0 of 22 F and G-type stars. When the IRS proposal was submitted, only 26 of the 35 excess sources were known, given that not all IRAC and IRS 16 m peak-up photometry were available.
2.2 Spitzer Infrared Spectrograph Observations
Spitzer IRS low resolution spectra were obtained for 26 stars in Upper Scorpius that have an infrared excess: 25 sources were observed for this study during campaign 1067 from 2006 September 14–19 and campaign 1085 from 2007 March 16–21, and one source ([PZ99]J161411.0-230536) was obtained from the FEPS Spitzer Legacy program as described by Carpenter et al. (2008). The following discussion describes the data reduction procedures for the 25 spectra obtained for this study.
The full 5.2–38 m spectra were obtained using the two low-resolution (/60–120) IRS modules: Short-Low (SL) 5.2–14.5 m and Long-Low (LL) 14.0–38.0 m. All targets were observed in IRS staring mode with ramp durations of 6 or 14 seconds. Multiple cycles were performed to ensure detection of the stellar photosphere and for bad pixel rejection. The faintest mid-infrared source required 30 cycles in the SL module while the brightest only 2 cycles. All images were initially processed by the IRS data pipeline software, version S15.3.0. Rogue pixel were removed from the resulting basic calibrated data (bcd) images using the irsclean software package and the campaign based rogue pixel masks. The individual spectra were then extracted and calibrated using the Spectroscopic Modeling, Analysis and Reduction Tool (SMART; Higdon et al. 2004). Background sky subtraction was accomplished using observations made at the same nod position for each IRS module and order. The object spectra on the resulting sky-subtracted frames were then automatically identified, traced, and extracted using the tapered column point source extraction option that is recommended for low-resolution observations. In this extraction mode, the region of extracted pixels is tapered along each spectral order, and its width in the cross-dispersion direction is scaled with the instrumental point spread function. Given the single point source nature of the observed stars and the standard extraction aperture used, the SMART pipeline-produced flux calibration was adopted. Repeatability of the IRS flux calibration observation is stated to be at the 5% level while absolute photometric accuracy is 10%. Once extracted, the individual spectra were then cleaned of remaining aberrant pixels and coadded using tools available within the SMART IDEA main window. The coadded spectra were then imported into IDL and median combined to produce the final flux calibrated, merged spectra presented here.
2.3 High Resolution Echelle Spectrometer
The High Resolution Echelle Spectrometer (HIRES: Vogt et al. 1994) on Keck I was used on 2006 June 16 and 2007 May 24–25 to obtain spectra of the 35 Upper Scorpius stars identified by Carpenter et al. (2006) that have an 8 and/or 16 m excess. Conditions were photometric for all 3 nights with seeing conditions varying from 0.6–0.9″. HIRES was used with the red cross-disperser and the C5 decker (1.148″7.0″), which has a projected slit width of 4 pixels and a spectral resolution of 33,000 (8.8 km s-1). The cross-disperser and echelle angles were set to approximately 0.884∘ and 0.0∘, respectively, providing nearly complete spectral coverage from 4800–9200 Å. The selected wavelength range includes several gravity and temperature-sensitive photospheric features as well as permitted and forbidden transitions generally associated with accretion processes or chromospheric activity: H, He I 5876, [O I] 6300, H, [S II] 6717, 6731, and Ca II 8498, 8542, and 8662. The red, green, and blue detectors were used in low gain mode, resulting in readout noise levels of 2.8, 3.1, and 3.1 e-1, respectively. Internal quartz lamps were used for flat fielding and ThAr lamp spectra were used for wavelength calibration. The HIRES data were reduced using the MAuna Kea Echelle Extraction, makee, reduction script written by Tom Barlow. The spectra were not flux calibrated. Given the range of apparent magnitudes for the observed sample, integration times varied from 15 to 45 minutes with typical signal-to-noise ratios of 30, 50, and 100 being achieved on the blue, green, and red chips, respectively. In Table 1, we list the measured spectroscopic properties of the Upper Scorpius membership sample observed with HIRES. The columns tabulate the source name from Carpenter et al. (2006), assumed spectral type, adopted extinction value from Preibisch & Zinnecker (1999) or Preibisch et al. (2002), measured radial velocities with 1 uncertainties, and measured equivalent widths for H, He I 5876, H, Li I 6708, and Ca II 8542. Measurement uncertainties for equivalent widths are 0.05Å. Other emission lines (e.g. [O I] 6300) found within the observed spectra are also tabulated.
3 Spitzer Mid-Infrared Spectra of Upper Scorpius Members
3.1 Spectral Energy Distributions
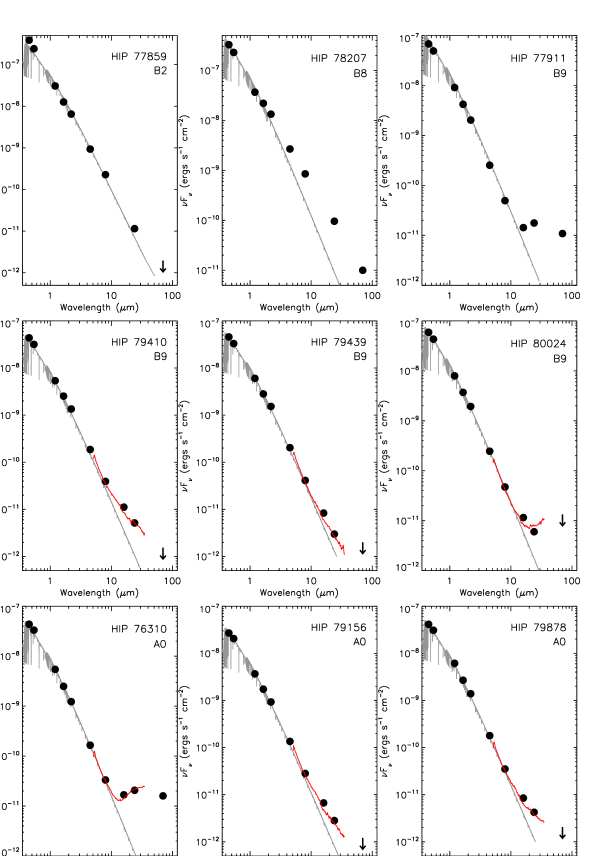
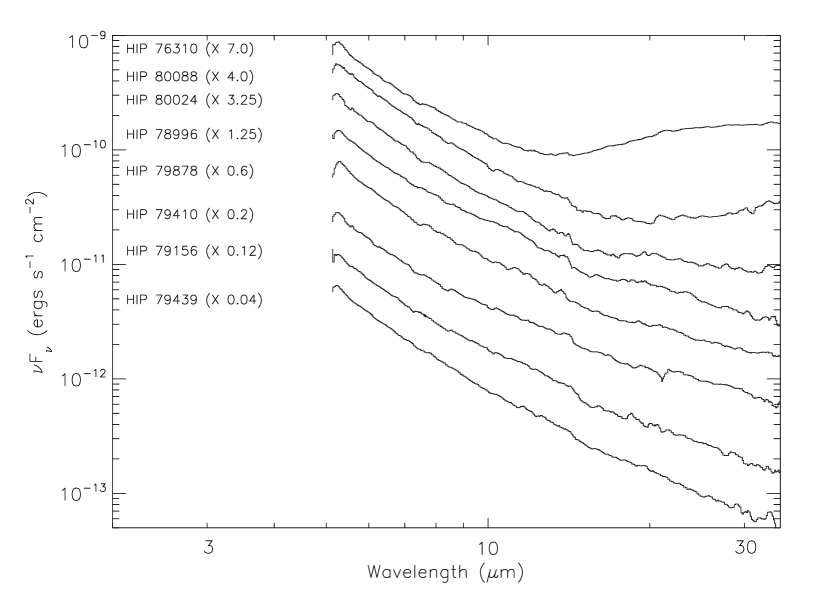
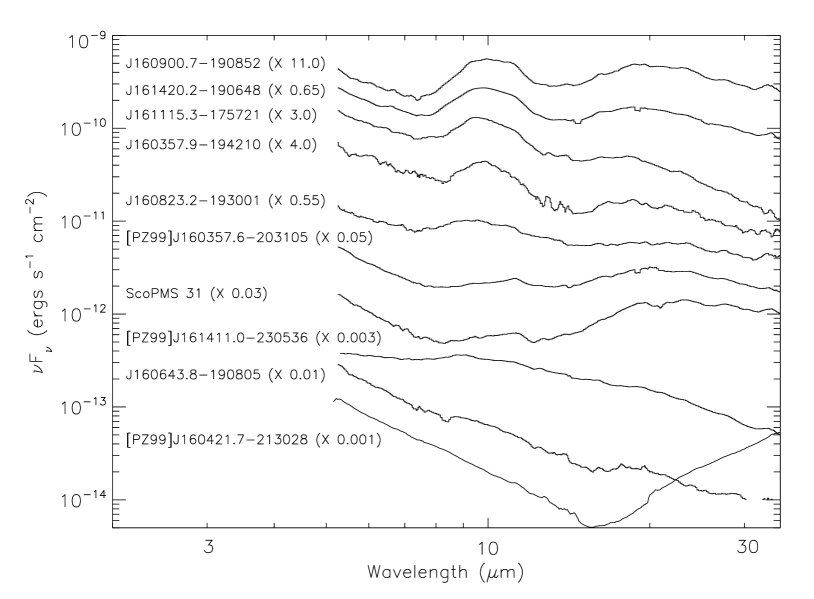
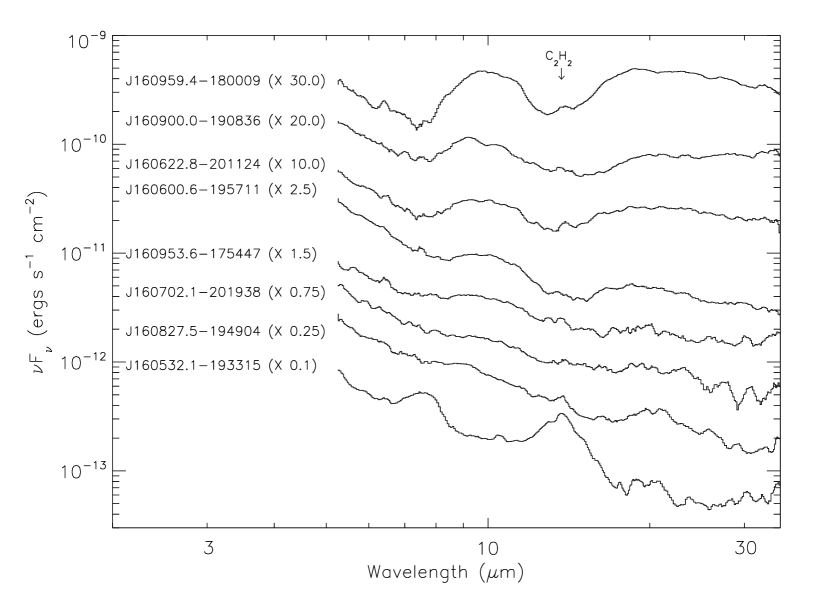
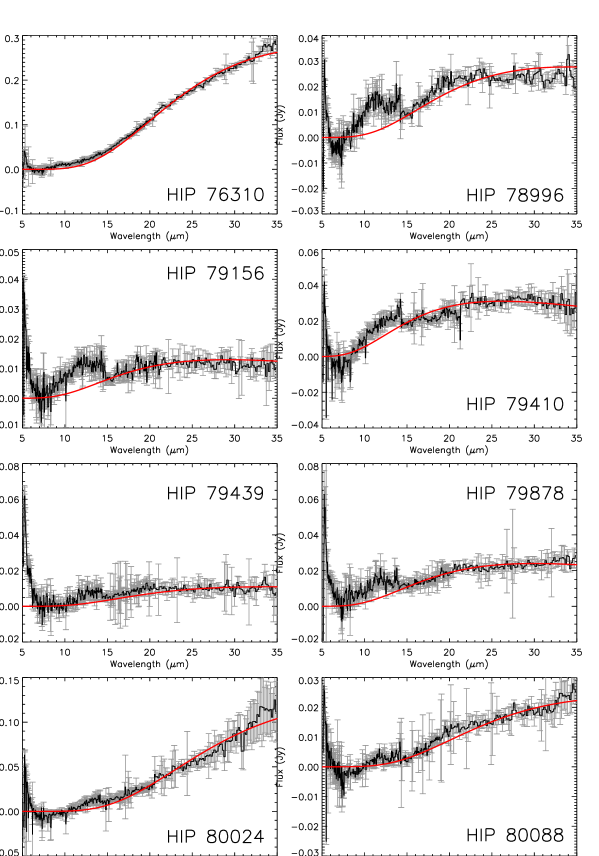
In Figures 1a–1d, we present the SEDs of the 35 Upper Scorpius sources with an infrared excess. The mid-infrared spectra extending from 5.2 to 38 m for the 26 stars observed with IRS are plotted in red and boxcar smoothed to reduce noise. Superimposed on the SEDs are extinction-corrected optical () and near-infrared () photometry from the literature and 2MASS, and Spitzer IRAC 4.5 and 8.0 m fluxes and IRS peak-up photometry from Carpenter et al. (2006). Also shown are the MIPS 24 and 70 m fluxes or 3 upper limits from Carpenter et al. (2009, in preparation), which place strong constraints upon the shape of the SED beyond the IRS wavelength range. Given the minimal interstellar reddening suffered by the Upper Scorpius members ( 0.94 mag), only the optical and near-infrared photometry are corrected for extinction in the SEDs. Also shown in Figures 1a–1d are the NextGen stellar atmospheric models of Hauschildt et al. (1999) for solar metallicities and sub-giant surface gravities (log g ). The main sequence effective temperatures () from Kenyon & Hartmann (1995) are adopted for the assigned spectral types of the Upper Scorpius members. The NextGen models are available over a range of values from 3,000 to 10,000 K at a resolution of 200 K, which is adequate coverage and granularity for the Upper Scorpius membership sample. The model stellar photospheres in Figures 1a–1d are normalized to the band flux for late-type stars (K+M) and to the band fluxes for the early-type (B+A) members, which is near the peak of the stellar photospheric emission. To facilitate comparison of the spectra and the strengths of the 10 and 20 m silicate emission features, we present only the IRS data in Figures 2–4, grouped by spectral type. The figures clearly demonstrate the diversity of observed infrared excess properties of the Upper Scorpius disk sample.
The mid-infrared spectra of all disk candidates show definitive excesses indicative of circumstellar dust emission. The early-type (B+A) Upper Scorpius members (Figs. 1a, 1b, & 2) exhibit near-photospheric SEDs out to 8 m, beyond which a weak excess becomes discernable. The polycyclic aromatic hydrocarbon (PAH) emission and the 10 and 20 m silicate emission features that often dominate the mid-infrared spectra of Herbig AeBe stars (Keller et al. 2008; Sloan et al. 2005) are absent in these early-type members. While most early-type Upper Scorpius excess stars exhibit declining flux levels from 5.2 to 38 m, HIP 76310 and HIP 80088 show flattened or slightly rising mid-infrared SEDs beyond 10 m. These two stars were the only early-type excess members observed with IRS that were detected by the MIPS 70 m survey of Carpenter et al. (2009, in preparation). HIP 80024, which also appears to exhibit a slightly rising mid-infrared SED, was not detected at 70 m by MIPS.
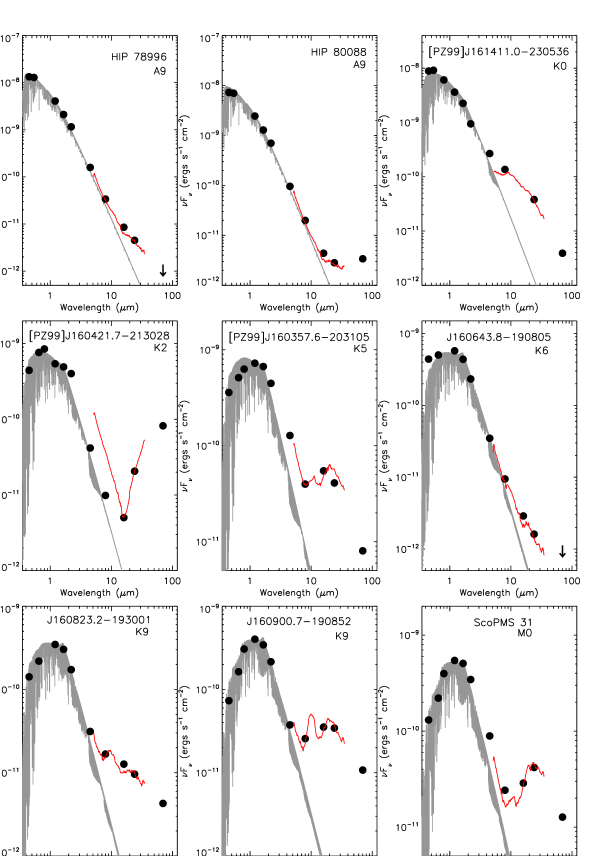
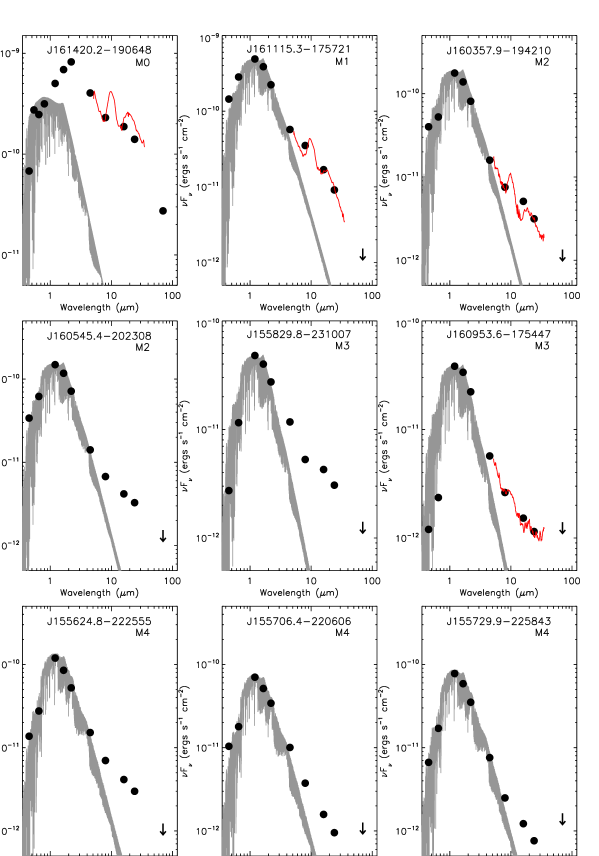
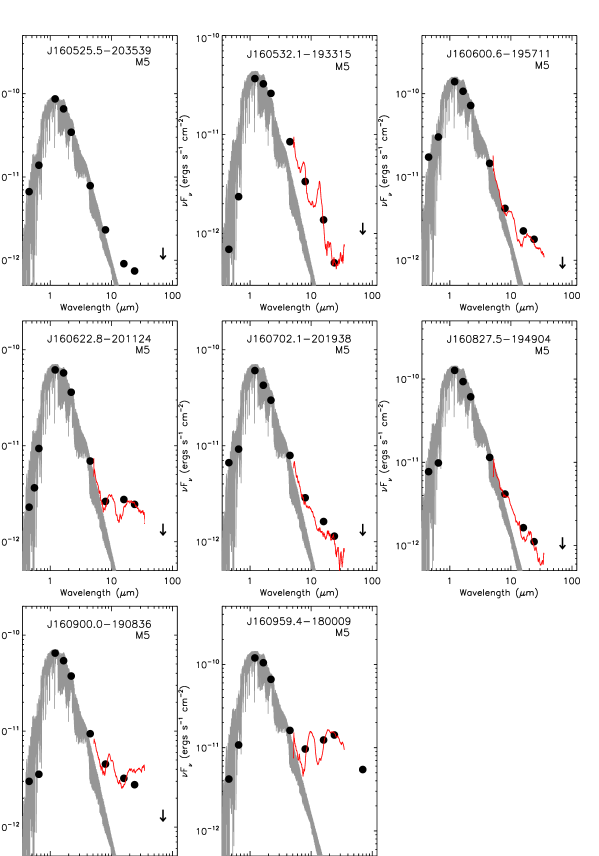
The late-type (K+M) excess members of Upper Scorpius present strikingly different SEDs in Figures 1b, 1c, and 1d than their more massive counterparts. Nearly all exhibit 10 and 20 m silicate emission features with varying degrees of prominence. Two notable exceptions are the K0-type star [PZ99]J161411.0-230536 and the K2-type star [PZ99]J160421.7-213028, which shows a steep decline in mid-infrared flux from 2.2–16 m where a turnover occurs in the SED. Aside from this inflection point, the mid-infrared SED of [PZ99]J160421.7-213028 is near featureless. Other than [PZ99]J160421.7-213028, the MIPS 70 m fluxes of the late-type Upper Scorpius members are in decline. In later spectral types (M3–M5), there is a tentative detection of the vibration-rotation band of C2H2 (acetylene) at 13.7 m. The feature appears most prominently in the M5-type star, J160532.1-193315, but is weakly present in all of the other spectra. The 14.0 m band of HCN (hydrogen cyanide) may be blended with the C2H2 feature as both have been identified in low-resolution IRS spectra of young, low-mass stars (Pascucci et al. 2009).
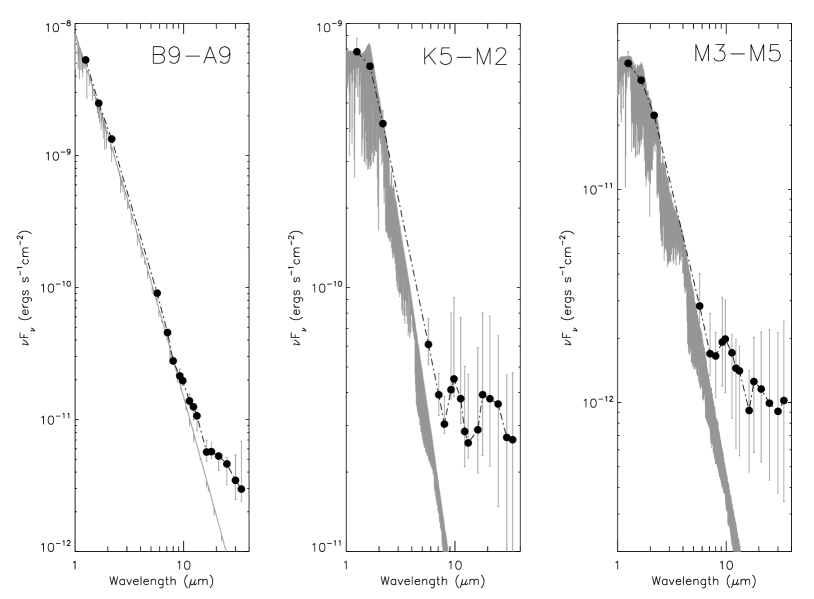
The differences in the SEDs of the Upper Scorpius sample as a function of spectral type are evident in Figure 5, which shows the median SED for the early (B9–A9), near solar-mass (K5–M2), and late-type (M3–M5) excess members. The median SEDs from 1.25 to 34.0 m were determined using extinction-corrected 2MASS photometry and the IRS spectra, which were integrated over identical narrow passbands and divided by the width of each band in microns. These photometric measurements were centered at: 5.7, 7.1, 8.0, 9.2, 9.8, 11.3, 12.3, 13.25, 16.25, 18.0, 21.0, 25.0, 30.0, and 34.0 m. The adopted bandwidths were 0.6 m for wavelengths m, 2.0 m for the bands centered near the silicate emission features (9.8 and 18.0 m), and 3.0 m for the longer wavelengths. For consistency with the Furlan et al. (2006) analysis of young stars in Taurus-Auriga, all fluxes were normalized at band prior to computing the median SED. Upper and lower quartiles were also computed for the median SEDs, which define the range of flux levels for 50% of the stars in each spectral type bin. Superposed in Figure 5 are the NextGen stellar atmospheric models of Hauschildt et al. (1999), fitted near band, for of 9600 K (A0), 3800 K (M0), and 3200 K (M5), respectively. Emission in excess of the stellar photosphere first becomes apparent near 8 m for the early-type stars, between 2.2 and 4.5 m for the near solar-mass stars, and near 4.5 m for the low-mass excess members. The 10 m solid state emission feature appears strongest in the solar analog (K5–M2) population, significantly less prominent in the low-mass (M3–M5) stars, and very weak or absent altogether in the early-type (B9–A9) SED. The median SEDs for each range of spectral type and their upper and lower quartiles are presented in Table 2.
3.2 Notes on Individual Sources
[PZ99]J160421.7-213028: The SED of this K2-type star exhibits a steep decline from 2.2 to 16 m where a sharp turnover occurs. There is, however, significant disparity (factor of 4) between the measured IRAC 4.5 and 8.0 m fluxes and the flux level of the IRS spectrum. The IRS 16 m photometric point (obtained 10 days before the IRAC photometry) agrees well with the much later IRS spectrum and MIPS photometry. Comparing the 2MASS and DENIS photometry, we find that the and band magnitudes vary by 0.47 and 0.24 mag, respectively. A fainter field star 16″ distant from [PZ99]J160421.7-213028 exhibits and band magnitude differences of 0.01 and 0.02 mag, respectively. The implication is that [PZ99]J160421.7-213028 is a variable star, but the origin of its variability is unknown. The SED of [PZ99]J160421.7-213028 is similar to that of the K2-type weak-line T Tauri star, UX Tau A in the Taurus-Auriga molecular cloud complex. Both lack significant silicate emission features, but whereas the SED of UX Tau A plateaus from 20 to 100 m, that of [PZ99]J160421.7-213028 continues to sharply rise to at least 70 m. UX Tau A is also weakly accreting with M⊙ yr-1. Espaillat et al. (2007) model the SED of UX Tau A as a 2-component disk system: an optically thick inner disk of gas and large dust grains and an optically thick outer disk truncated near 56 AU. The inner disk of [PZ99]J160421.7-213028 is likely depleted of micron-sized dust grains and gas given the lack of solid state emission features and accretion indicators (see §4.2 and 4.3).
J160643.8-190805: This K6-type WTTS exhibits near photospheric emission to 8 m, where a slight excess first becomes apparent. The SED suggests that the inner AU of disk structure is devoid of significant quantities of dust. The 10 and 20 m silicate emission features are extremely weak and significantly broadened. The star was not detected in the MIPS 70 m survey implying that excess emission remains weak into the far infrared. J160643.8-190805 is not accreting based upon the low velocity width of H emission (§4.2 and 4.3).
J161420.2-190648: This M0-type star exhibits the largest infrared excess of all disk-bearing members in the Upper Scorpius sample. The SED shown in Figure 1c is normalized near band given the sharply rising near-infrared () flux levels. Excess emission is evident from band and extends redward to at least 70 m. The SED of the star is reminiscent of the Class II sources in Taurus-Auriga with prominent 10 and 20 m silicate emission peaks. The MIPS 70 m flux level suggests that the SED declines redward of the 20 m solid state feature. The mass accretion rate for this star is the highest of all suspected accretors in the Upper Scorpius sample, 10-8.9 M⊙ yr-1 (§4.2 and 4.3).
J161115.3-175721: The SED of this M1-type star exhibits near-photospheric emission in the near-infrared (). By 4.5 m, however, excess emission is readily apparent and continues to at least 38 m, the limit of the IRS spectral range. The 10 m solid state emission feature is very prominent, but redward of the 20 m silicate emission peak, the flux level rapidly declines, possibly the result of a truncated outer disk. The star was not detected in the MIPS 70 m survey, suggesting that the low level of excess emission evident at the limit of the IRS wavelength coverage continues beyond. This star is not suspected of accretion activity.
J160959.4-180009: This M4-type WTTS exhibits a near-photospheric SED out to 4.5 m where excess emission first becomes apparent. The 10 and 20 m solid state features are among the strongest found in the sample. J160959.4-180009 was the only late-type (M3–M5) excess member detected at 70 m. Although not suspected of accretion activity (§4.2 and 4.3), [O I] 6300 is detected in emission, possibly associated with a stellar wind.
J160532.1-193315: This accreting M5 star has a peculiar mid-infrared spectrum that exhibits broad emission peaks centered near 7.7 and 13.7 m. Polycyclic aromatic hydrocarbon (PAH) emission, possibly excited by the hot accretion flux, may be responsible for the broad 7.7 m feature, but the 13.7 m band is tentatively identified as the vibration-rotation band of C2H2 (Pascucci et al 2009). Other possible progenitors include amorphous water ice, PAH emission, or some combination of these sources. Alternatively, the SED of J160532.1-193315 may be interpreted as exhibiting shallow silicate absorption at 10 and 20 m, resulting in the observed “peaks” between the absorption features. Broad 10 m silicate absorption is commonly observed in embedded class I sources experiencing infall (e.g. Zasowski et al. 2008) or in edge-on disk systems where cold dust obscures the line of sight. At 20 m, however, the SEDs of young protostars are dominated by rising continuum emission, which effectively veils absorption from silicates. For J160532.1-193315 this interpretation is difficult given the substantial rise above the continuum level from 7.0–7.7 m before turning over. The depth of the proposed 10 m absorption feature also coincides with the expected continuum level if one extrapolates the SED through the enhancement using the slope from 5.2–7.0 m.
4 Accretion Diagnostics
In the magnetospheric accretion model, gas from the inner disk edge is channeled along lines of magnetic flux to the stellar surface where its impact upon the photosphere generates hot continuum excess emission with peak temperatures of 8,000–12,000 K (Valenti et al. 1993; Hartman et al. 1998; Muzerolle et al. 1998). The infalling gas is inferred from inverse P Cygni line profiles as well as broadened H I, He I, and Ca II emission lines with velocity widths often exceeding several 100 km s-1 (Hamann & Persson 1992; Batalha & Basri 1993). The mass accretion rate, , is most reliably determined using blue spectrophotometry to measure the hot continuum excess emission directly from the Balmer jump (Valenti et al. 1993; Gullbring et al. 1998; Herczeg & Hillenbrand 2008), or by using dereddened band photometry, which correlates strongly with accretion luminosity (Gullbring et al. 1998). In the absence of available blue spectrophotometry, reliable accretion diagnostics have been developed in the red for use in extincted regions. Continuum excess emission or optical veiling near 6500 allows a direct measurement of accretion luminosity, , to be made using high resolution optical spectra. The extinction-corrected Ca II 8542 line luminosity also has a well-established linear relationship with (Muzerolle et al. 1998; Herczeg & Hillenbrand 2008; Dahm 2008) that permits an independent estimate of . The derived values can then be transformed to from the relation:
(1)
where the stellar mass and radius estimates are obtained from the evolutionary models of Siess et al. (2000). The factor is assigned a value of 0.8, which assumes an inner disk radius of 5 (Gullbring et al. 1998). Given the possibility of larger inner disk radii for the excess members of Upper Scorpius, this value could be underestimated by a factor of 1.25.
4.1 H Emission
White & Basri (2003) use the velocity width of H at 10% peak flux to distinguish between optically veiled and non-veiled stars, i.e. between suspected accretors and non-accretors. Their velocity width criterion of 270 km s-1 is independent of spectral type and of uncertainties introduced when adopting photospheric template spectra for the veiling analysis. The White & Basri (2003) H velocity width criterion was applied to the 35 excess members of Upper Scorpius observed with HIRES, identifying only 7 suspected accretors. The M5 star J160827.5-194904 exhibits an H velocity width of 255 km s-1, however, strict adherence to the White & Basri (2003) accretion criterion is maintained. All other non-accretors have H velocity widths 225 km s-1 with a median value of 131 km s-1. The presence of [O I] 6300 and [S II] 6731 emission, indicators of accretion shocks and stellar or disk winds, were also used to support the accretion analysis. Shown in Figure 6 are the H emission profiles for the 7 suspected accretors in the Upper Scorpius disk sample. The strongest accretor (i.e. possessing the highest ) is the M0-type star, J161420.2-190648, which exhibits significant infrared excess emission from band redward. Among the low-mass excess members of Upper Scorpius, the earliest disk-bearing star is the K0-type [PZ99]J161411.0-230536, which exhibits infrared excess emission at 4.5, 8.0, and 16.0 m. An HIRES spectrum of this star obtained in 2008 June suggests that accretion may be occurring. H exhibits an inverse P Cygni line profile indicative of mass infall, but only weak emission is present. Integrated over the full line profile, the equivalent width of H is W(H)0.38 Å. No forbidden emission lines generally associated with protostellar jets or accretion shocks are evident. The earliest definitive accretor in the Upper Scorpius disk sample is the K5-type star [PZ99]J160357.6-203105, in which non-photospheric emission first becomes detectable between band and 4.5 m.
4.2 Continuum Excess Emission
Veiling or continuum excess emission, defined such that , was determined for the 7 suspected accretors by fitting the depths of several Ca I and Fe I photospheric absorption lines from 6000–6500Å with those of a rotationally broadened and artificially veiled standard star of similar spectral type (White & Hillenbrand 2004). Veiling errors are dominated by the uncertainty in spectral type and are estimated to be 0.05–0.1 for lightly veiled stars and up to 0.3 for the most heavily veiled object. To estimate the continuum excess luminosity, the stellar photospheric flux was determined using the extinction-corrected band mag. To transform the excess fluxes to total accretion luminosity, a multiplicative bolometric correction was applied to account for the accretion-generated flux outside of the filter bandpass. We adopt a bolometric correction of 11.1, following the reasoning of White & Hillenbrand (2004), which is the logarithmic average of the 2 values proposed by Gullbring et al. (1998), 3.5, and Hartigan & Kenyon (2003), 35. The mass accretion rate then follows using the stellar mass and radius estimates of the Siess et al. (2000) pre-main sequence models. The veiling estimates for the 7 accretors in Upper Scorpius range from near zero up to 1.5 for the M3-type star J155829.8-231007. The resulting values range from to M⊙ yr-1 and are listed in Table 3. Uncertainties for these estimates include errors in continuum excess emission (factor of 2), the adopted bolometric correction (factor of 3), and the estimate for the inner disk radius (factor of 1.25). We therefore assign uncertainties of 0.5–1.0 dex for the derived log values presented in Table 3.
4.3 Ca II 8542 Emission
In their examination of accreting CTTS in the Taurus-Auriga star forming region, Muzerolle et al. (1998) find that the Ca II 8542 emission line luminosity is a strong correlate of . The linear relation persists through at least 3 orders of magnitude from 10-6.0 to 10-9.0 M⊙ yr-1. Dahm (2008) used published and observed Ca II 8542 emission line luminosities for a dozen accreting CTTS in Taurus and their values obtained from the blue continuum excess measurements of Valenti et al. (1993) and Gullbring et al. (1998) to derive a linear regression fit given by:
loglog (2)
Some scatter in the relationship exists, likely resulting from the non-simultaneous nature of the Ca II and blue continuum spectrophotometric observations. Herczeg & Hillenbrand (2008) find a similar linear fit for accreting low mass stars and substellar objects in their simultaneous blue continuum excess measurements and Ca II 8542 emission line luminosity determinations:
loglog (3)
To measure , the Ca II 8542 absorption line profile from the normalized spectrum of a standard star of similar spectral type was subtracted from the profile of each suspected accretor. The emission line luminosity was then estimated using the measured equivalent width, the extinction-corrected band mag, the spectral type dependent flux ratio between 8542 and the effective wavelength of the band filter (obtained from the spectrophotometry of O’Connell 1973), and by assuming a distance of 145 pc for the Upper Scorpius OB associtation. estimates were then determined using the above relationships from Dahm (2008) and Herczeg & Hillenbrand (2008). In general, the linear relation of Dahm (2008) tends to overestimate and therefore relative to the continuum excess values (by up to an order of magnitude). We adopt the relationship of Herczeg & Hillenbrand (2008) given their simultaneous and independent determinations of and and the lower stellar masses sampled by their investigation. The values agree well (factor of 2–3) with those from the continuum excess analysis and are provided in Table 3.
5 Comparison of the Upper Scorpius and Taurus-Auriga Disk Samples
The inner disk dissipates in 50% of low mass stars by an age of 3 Myr (Haisch et al. 2001). Consistent with this trend, 50% of stars in Taurus-Auriga (age 1-3 Myr) have inner circumstellar disks (Kenyon & Hartman 1995), while only 20% of stars in Upper Scorpius (age 5 Myr) have inner disks (Carpenter et al. 2006). We now examine the SEDs of these two populations to establish if the presumed evolutionary changes in the percentage of stars with an infrared excess is also accompanied by changes in the disk structure, as traced by variations in the SED shape and accretion diagnostics. Since Taurus-Auriga is a low-mass star forming region, we focus the analysis on the K and M-type members of each region. We compare in turn the infrared excesses between 2.2 and 8 m, various mid-infrared spectral indices derived from the IRS spectra, and mass accretion rates.
5.1 The Taurus-Auriga Class II and Class III Samples
Furlan et al. (2006) present Spitzer mid-infrared spectra for 85 Class II and 26 Class III objects in the Taurus-Auriga star forming region. Early classification of Taurus sources (e.g. Kenyon & Hartmann 1995) was based upon the slope () of the SED from 2.2–25 m, defined such that log()/log(). Sources having SED slopes of were defined as Class II objects which exhibit infrared excesses characteristic of circumstellar disk emission. Sources with were defined as Class III objects which exhibit no detectable infrared excess and have SEDs characteristic of pure stellar photospheres. This classification scheme is critically dependent upon IRAS photometry and does not account for the detailed shape of the mid-infrared SED. Consequently, Furlan et al. (2006) re-classified the Taurus-Auriga sources based upon the detection of excess emission in the IRS spectral range (5.2–38 m). Given the significantly greater sensitivity of Spitzer, several objects previously identified as Class III sources using the IRAS 25 m measurements, were reclassified as Class II by Furlan et al. (2006). The stars were also divided into classical and weak-line T Tauri stars (CTTS/WTTS) using the modified, spectral-type dependent accretion criterion of White & Basri (2003). Among the sample of Class II sources in Taurus, Furlan et al. (2006) find that most are CTTS and suggest that inner disk gas and dust are responsible for a substantial fraction of the infrared excess. The Upper Scorpius disk-bearing sample is similar in many respects to the redefined Class II population of Taurus-Auriga. Both samples were classified on the basis of emission excesses within the IRS spectral range and cover similar spectral types (B8–M5). All of the Upper Scorpius excess members would be classified as Class II sources by the Furlan et al. (2006) definition. Although neither sample is complete, both can be regarded as representative of the larger disk-bearing populations of each region.
5.2 Comparison of Near and Mid-Infrared Photometry
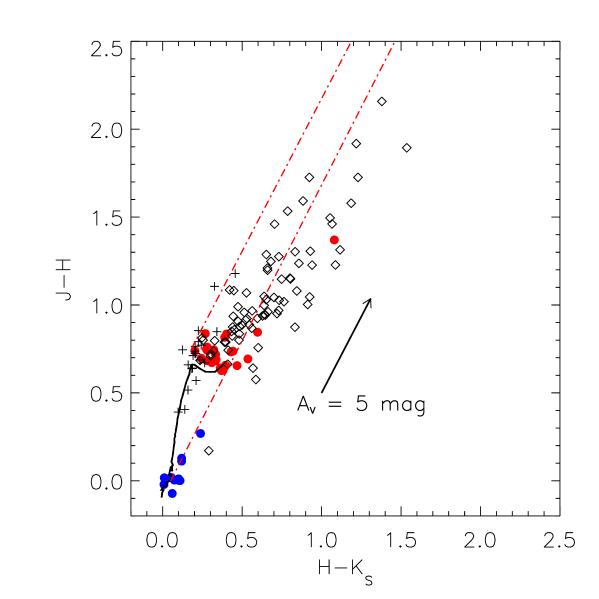
In Figure 7, we present the 2MASS , color-color diagram for the Upper Scorpius and Taurus-Auriga disk-bearing samples. The 35 Upper Scorpius members appear clustered around the locus of main sequence stars, with the early-type members lying near the base of the trunk and the late-type stars just above the M-dwarf branch. There is an obvious lack of significant reddening toward Upper Scorpius as the largest extinction is 3 mag. In contrast to the Upper Scorpius disk-bearing population, the 71 Taurus-Auriga Class II sources from Furlan et al. (2006) with 2MASS photometry available suffer significant reddening (either interstellar in origin or local extinction effects), and over half exhibit colors that place them outside of the reddening boundaries for normal stars. The Class III sources of Taurus-Auriga lie clustered around the dwarf locus or along its reddening vector, demonstrating a lack of infrared excess emission.
To quantify the near-infrared excesses for these two populations, we show in Figure 8 the histogram for Upper Scorpius disk-bearing stars (shaded region) and the Taurus-Auriga Class II sources (open region). Given that the early-type members of Upper Scorpius have no direct counterparts in Taurus-Auriga, they are not included in the histogram sample. Extinction corrections are made using the values from Furlan et al. (2006) for members of Taurus-Auriga and those of Preibisch & Zinnecker (1999) or Preibisch et al. (2002) for members of Upper Scorpius. To determine color excesses, intrinsic 2MASS colors were obtained from a tabulation of B2–K5 main sequence colors adopted by the FEPS survey (Carpenter et al. 2008). Intrinsic 2MASS colors for later spectral types (K5–M5) were derived using 1100 classified stars from the Palomar/MSU Nearby Star Spectroscopic Survey of Reid et al. (1995) and Hawley et al. (1996). Given their proximity to the Sun, the stars suffer little extinction. Sample sizes for each half-spectral class bin range from 20 to 160, thereby ensuring statistical robustness. The median color for each bin is adopted as the intrinsic color.
The distributions of color-excesses are clearly different, with median values of 0.03 and 0.35 for the Upper Scorpius and Taurus-Auriga samples, respectively. The small excess observed in Upper Scorpius could result if the intrinsic colors are dependent on surface gravity; the Upper Scorpius members are systematically younger than the K- and M-type stars used to derive the intrinsic colors, and as a result have lower surface gravities. Thus only two of the Upper Scorpius sources (J161420.2-190648 and [PZ99]J160421.7-213028) have clear excesses (see Fig. 8). We find that hot dust grains within the inner disk region (1 AU) are more prevalent among the presumably younger Taurus-Auriga Class II sources. Such near-infrared excess originates from reprocessed stellar radiation emitted by the thermally flared inner disk rim at or near the evaporation temperature of dust, 1500 K. One consequence of the flared inner disk rim is that the interior region is shadowed, causing a decrease in scale height and a reduction of infrared emission (Dullemond et al. 2001). Beyond the shadowed region, the scale height of the disk increases due to the reduced gravitational potential. Consequently, the surface layer of the disk is again exposed to stellar radiation. The models of Dullemond et al. (2001) predict that emission from this surface layer and the disk interior peak at wavelengths in the near and mid-infrared, respectively.
Hartmann et al. (2005), Luhman et al. (2006), and Padgett et al. (2008) present Spitzer IRAC 3.6, 4.5, 5.8, and 8.0 m photometry for 56 Class II and III sources in the Furlan et al. (2006) Taurus-Auriga sample. Complementing these data are the IRAC 4.5 and 8.0 m fluxes from Carpenter et al. (2006) for all infrared excess members of Upper Scorpius. The IRAC fluxes were converted to magnitudes using the zero magnitude flux densities of 179.7 Jy for channel 2 and 64.13 Jy for channel 4 (Reach et al. 2005). Shown in Figures 9 and 10 are the histograms of the and color excess for the 24 low-mass disk-bearing members of Upper Scorpius and the 45 Taurus-Auriga Class II sources of Furlan et al. (2006) with IRAC photometry available. To obtain intrinsic and colors for the Taurus-Auriga and Upper Scorpius samples, stellar photospheric 4.5 and 8.0 m fluxes were estimated using the Spitzer Stellar Performance Estimation Tool (STAR-PET), which adopts the Kurucz-Lejeune stellar atmospheric models. The observed magnitudes (from 2MASS) are then corrected for extinction using the values provided by Furlan et al. (2006) for Taurus-Auriga and by Preibisch & Zinnecker (1999) or Preibisch et al. (2002) for members of Upper Scorpius. The distributions are markedly different with median color excesses of 1.37 and 0.77 mag for the Taurus-Auriga and Upper Scorpius samples, respectively. The distributions for these samples have median values of 2.23 and 1.43 mag for Taurus-Auriga and Upper Scorpius, respectively. The differences in color excesses unambiguously demonstrate the reduced levels of 2.2–8.0 m excess emission in the Upper Scorpius sample relative to the Taurus-Auriga Class II sources.
5.3 Comparison of Mid-Infrared Spectral Indices
The 2MASS and IRAC photometry reveal clear differences in the amount of warm dust in the inner disk between the Upper Scorpius and Taurus-Auriga samples. We now use the IRS spectra to investigate the differences in the excess characteristics between 8.0 and 38 m, which probes dust emission at larger orbital radii. To characterize the SEDs for the disk-bearing members of Upper Scorpius we determine spectral indices that sample mid-infrared continuum emission. Following the example of Furlan et al. (2006), we integrate the observed flux in three passbands defined from 5.4–6.0 m, 12.5–14.0 m, and 23.5–26.5 m and then divide the resulting fluxes by the width of the passband in microns. The spectral indices are then determined from:
(4)
In this manner, 3 mid-infrared spectral indices are determined, from 5.7 to 13.25 m (), from 13.25 to 25 m (), and from 5.7 to 25 m (). An additional index measuring the strength of the 10 m silicate emission feature is also determined by interpolating the continuum from 5.2–7.0 m and from 13.0–16.0 m with a fifth or sixth order polynomial. The resulting fitted continuum was then subtracted from the silicate emission peak defined between 8.0 and 12.5 m. The integrated flux of the continuum-subtracted silicate feature is then normalized to the fitted continuum level between 8.0 and 12.5 m. Table 4 tabulates the spectral indices and the 10 m silicate emission strengths for the Upper Scorpius members.
In Figure 11 we present histograms of the index for the low-mass (K0–M5) members of Upper Scorpius and the Class II population in Taurus-Auriga. The median value of the index is for the low-mass stars in Upper Scorpius, and for the Class II population of Taurus-Auriga. The Taurus-Auriga sample tends to have more outliers with positive indices, while the Upper Scorpius sample has more sources with negative indices. Nonetheless, the Kolomogorov-Smirnov statistic () for these samples is with a significance level of 0.95, suggesting that the two samples are consistent with having been drawn from the same parent population. Similarly, in Figure 12 we present histograms of the indices. The median values of the distributions are and for Upper Scorpius and Taurus-Auruga, respectively. However, the Kolomogorov-Smirnov statistic for these two samples is with a significance level of 0.78 and suggests that the distributions of indices are indistinguishable.
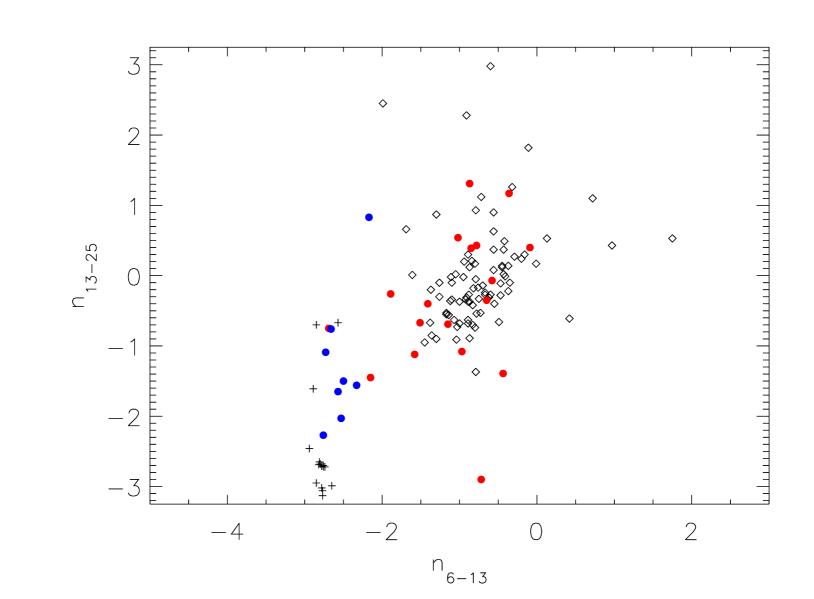
Shown in Figure 13 is the mid-infrared spectral index plotted against the index for the 26 excess members of Upper Scorpius observed with IRS and the 85 Class II and 26 Class III sources in Taurus-Auriga from Furlan et al. (2006). The early-type excess members of Upper Scorpius appear well displaced from the low-mass stars and lie between the Class II and III populations of Taurus-Auriga. The oddly placed low-mass Upper Scorpius member near 0.75, 2.8 is the M5-type star J160532.1-193315, which exhibits possible PAH and acetylene emission features near 7.7 and 13.7 m (§3.2). Overall, the two dimensional distributions of the and indices are similar for the low-mass disk-bearing stars in the Upper Scorpius and Taurus-Auriga samples.
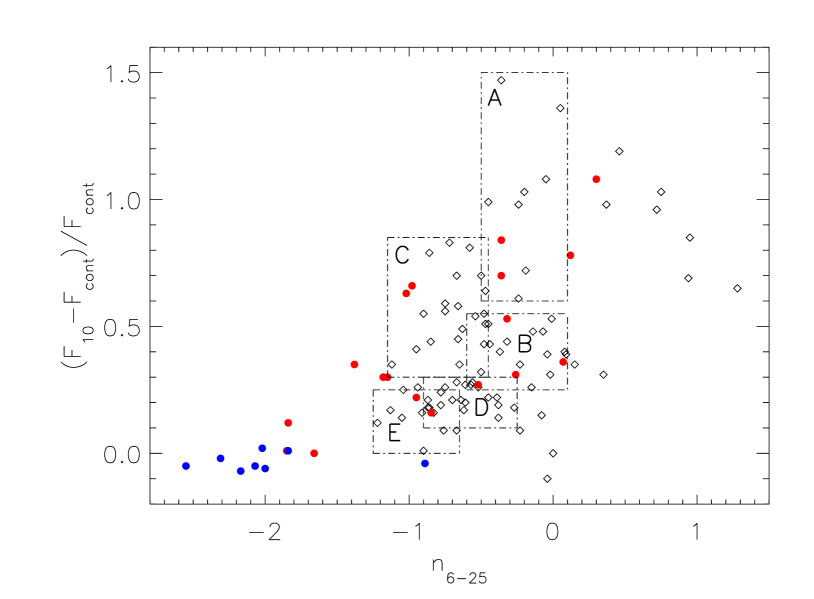
Furlan et al. (2006) define a morphological sequence (labeled A–E) of mid-infrared spectra using silicate emission strengths and the slope of the mid-infrared SED as classification criteria. This classification scheme may be representative of a simple disk evolutionary sequence such that as micron-sized dust grains are depleted, 10 m silicate emission broadens and weakens resulting in a more negative SED slope. Shown in Figure 14 is the continuum-subtracted, integrated flux of the 10 m silicate emission feature, normalized to the continuum and plotted as a function of the spectral index for the Upper Scorpius excess members observed with IRS. Also shown in the figure are the 85 Class II sources in Taurus-Auriga and the approximate boundaries of the various classes (A–E) in the morphological sequence defined by Furlan et al. (2006). Taurus-Auriga sources lying outside of these boundaries were identified as outliers of the sequence. In general, for both populations, stars with exhibit weak 10 m silicate emission. Considering just the low-mass Upper Scorpius excess members, we find the peak-to-peak range of the 10 m silicate emission index to be somewhat higher for the Taurus-Auriga sample, but given its larger size there is a greater probability for the presence of outliers. The ranges of indices are comparable for both samples, however, the distribution is shifted toward more negative values for the Upper Scorpius sample. None of the Taurus-Auriga Class II sources are found with indices , whereas 4 (24%) low-mass Upper Scorpius members occupy this region of the diagram.
5.4 The Median Spectral Energy Distribution for Near Solar Mass Stars
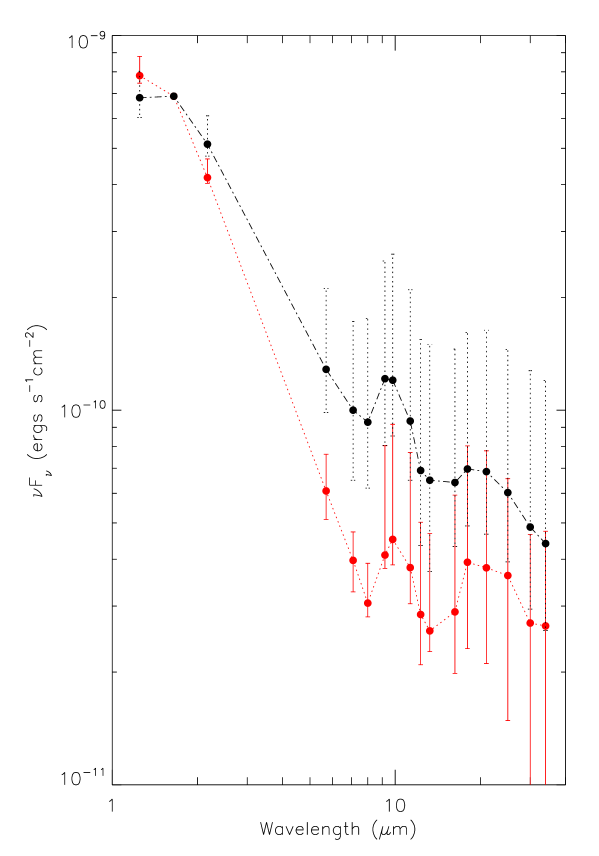
In previous sections, we compared the Upper Scorpius and Taurus-Auriga low-mass disk-bearing samples using selected photometric bands and indices. We now compare the disk properties based on the global shape of the IRS spectra. The median SED from 1.25 to 34.0 m of the 8 Upper Scorpius near solar-mass (K5–M2) excess stars is shown in Figure 15 with its upper and lower quartiles superposed. Also shown is the median SED of the 55 Taurus-Auriga Class II sources within the same range of spectral types from Furlan et al. (2006). The 10 m silicate emission feature is of similar strength in both median SEDs, however, the 20 m peak is significantly more pronounced in the Upper Scorpius sample. This may result from enhanced optically thin 20 m emission from the disk surface layer. The slope of the median SED from 1.6 to 8.0 m is significantly steeper for the K5–M2 stars in Upper Scorpius relative to the Taurus-Auriga Class II sample. This provides additional supporting evidence for the reduced levels of inner disk emission inferred from the near (, 4.5 m) and mid-infrared (8.0 m) color excess distributions.
5.5 Synthesis
We now combine the results in §5.2-5.4 to summarize the differences and similarities between disks around low mass stars in the Upper Scorpius and Taurus-Auriga samples. Not only do a greater fraction of stars in Taurus-Auriga possess circumstellar disks than low-mass stars in Upper Scorpius, the disk properties are clearly different as well. The most obvious difference is that disks in Upper Scorpius lack the hot dust grains prevalent around Class II sources in Taurus-Auriga, as evidenced by the reduced levels of excess emission at 2.2 m (see Figs. 7 and 8), 4.5 m (Figs. 9), and 8 m (Fig. 10), and further exemplified by the sharply declining median SED (Fig. 15). Qualitatively, these properties are similar to the “anemic” disks found in IC 348 (Lada et al. 2006), although unlike IC 348, the reduced level of excesses at 8 m is found in nearly all late-type stars in Upper Scorpius. The ubiquity of depleted inner disks in Upper Scorpius suggests this is a common evolutionary pathway that persists for an appreciable fraction of the disk lifetime. Differences in the inner disk properties also extend to the gaseous component; the mean (10-9.0 M⊙ yr-1) for the 6 Upper Scorpius accretors with masses between 0.27 and 1.07 M⊙ is an order of magnitude lower than that of 17 accreting CTTS in Taurus-Auriga (10-7.97 M⊙ yr-1) within a similar mass range (Gullbring et al. 1998). The lower mean value and the clearly different infrared excess properties of the Upper Scorpius sample relative to the Class II population of Taurus-Auriga imply significant differences in inner disk structure and composition.
The disk properties can be constrained using the grid of radiative transfer models from Robitaille et al. (2006, 2007). These models assume that an optically thick accretion disk surrounds a pre-main-sequence star, and the resultant SED is computed for various combinations of parameters, including inclination, stellar mass and radius, mass accretion rate, inner and outer disk radius, disk mass, distance, and extinction. The grid of model spectra were fitted to the SEDs of a representative sample of near solar-mass (K5–M2) and low-mass (M3–M5) Upper Scorpius members to determine the range of inner disk radii that are consistent with the observations. To better constrain inner disk emission, only the 2MASS photometry, IRAC 4.5 and 8.0 m fluxes from Carpenter et al. (2006), three narrow photometric bands of the IRS spectra centered at 5.7, 7.1, and 9.2 m, and the MIPS 24 m fluxes from Carpenter et al. (2009, in preparation) were used in the model fitting. Distance and extinction were allowed to vary from 100 to 200 pc and from 0.0 and 3.0 mag, respectively. The inner disk radii for the models most consistent with the SEDs of the near solar-mass and low-mass stars ranged from 0.2–0.8 AU and from 0.4–1.2 AU, respectively. The model comparisons support the conclusion that the inner disk regions of the Upper Scorpius disk-bearing population are evacuated of dust and gas.
The shape of the IRS spectra at longer wavelengths probes the disk structure at larger orbital radii. While we do not find any significant differences in the continuum slope between the disks around stars in the Upper Scorpius and Taurus-Auriga samples (Figs. 11 and 12), the amount of infrared emission is lower by a factor of 2 in Upper Scorpius for stars with spectral types between K5–M2 (Fig. 15). The reduced levels of excess emission are apparent from 2.2–34.0 m, with a peak factor of 3 difference occurring near 8.0 m. Assuming a disk temperature distribution given by D’Alessio et al. (1999) for accretion disks around low-mass stars:
(5)
where is a parameter dependent upon stellar mass, radius, and , we find that the IRS spectral range samples the disk from 1 AU to beyond 20 AU for a typical 0.5 M⊙ pre-main sequence star. If the changes in the excess properties of the Upper Scorpius disk sample relative to the Class II population of Taurus-Auriga are interpreted as evidence for disk evolution, then the disk between 1 and 20 AU is evolving on 2–4 Myr timescales.
Examination of the 10 and 20 m solid state emission features may also provide evidence for inner disk evolution. As micron-size dust grains in the optically thin disk surface layer coalesce, silicate emission is expected to broaden and flatten while mid-plane settling decreases the mid-infrared continuum excess emission (Furlan et al. 2006; D’Alessio et al. 2006). As shown in Figure 5, the strength of silicate emission among Upper Scorpius excess members is strongly spectral type or mass dependent, with the most prominent features being associated with the near solar-mass stars. Sicilia-Aguilar et al. (2007) also find a spectral type dependence of silicate emission strength, such that weak silicate features are 3–5 times more common in M-type stars than in K-type stars in Trumpler 37 and NGC 7160. They suggest that solid state emission probes different regions of the disk for K and M-type stars given that it is produced in closer proximity to the stellar photosphere and within a smaller disk region for the later spectral types. The Upper Scorpius IRS observations support this conclusion, providing additional evidence of the stellar mass dependent nature of solid state emission strengths. If differential disk evolution were occurring (e.g. inside-out dissipation), silicate emission would appear weaker among late M-type stars whose disks may have been cleared beyond the region probed by such emission. These effects, however, would be subtle and cannot be adequately assessed by the IRS observations presented here. Relative to the sample of Taurus-Auriga Class II sources, we find that the 10 m silicate emission features among the low-mass members of Upper Scorpius are of comparable strength.
6 Circumstellar Disks Associated with Early-Type Upper Scorpius Members
The early-type excess members of Upper Scorpius exhibit near-photospheric fluxes out to 8 m and weak, featureless continuum excesses redward that extend to the wavelength limit of IRS, suggesting that the dust grains responsible for the observed excesses are at least several microns in diameter. This is supported circumstantially by the estimated blowout radius () for dust grains around these early-type stars due to radiation pressure (Artymowicz 1988):
(6)
where is the grain mass density, assumed to be 2.5 g cm-3, and is the radiation pressure coupling coefficient, assumed to be unity (i.e. the effective cross-section of the grain is approximately equal to the geometric cross-section, Chen et al. 2006). The blowout radii are found to range from 40.5 m for the B2 V star HIP 77859, to 1.0 m for the A9 V excess member HIP 80088. Grains with smaller radii are gravitationally unbound and move hyperbolically out of the system over migration timescales that are 3 orders of magnitude less than the age of the Upper Scorpius OB association assuming the disk is optically thin and gas-poor. For these early-type stars, stellar winds may also play a crucial role in disk dispersal. Using the relationship for the stellar wind dust blowout radius from Plavchan et al. (2005) and the wind mass loss rate upper limit ( M⊙ yr-1) for main sequence A-type stars from Lanz & Catala (1992), we estimate the wind dust blowout radii to be an order of magnitude less than those from radiation pressure alone. While the mass-loss rates for young stars may be higher, we adopt the latter values to constrain the minimum dust grain sizes around these early-type mid-infrared excess stars.
To examine the dust properties of the 8 early-type Upper Scorpius members observed with IRS, we show the photosphere-subtracted 5–35 m spectra in Figure 16. In several of the photosphere-subtracted spectra, a slight rise between 10 and 15 m is apparent that may result from a low-level discontinuity between the SL and LL modules. The NextGen atmospheric models of Hauschildt et al. (1999) were used to estimate the photospheric flux. The error bars represent the 1- uncertainties determined when combining the individual IRS spectra. Superposed in Figure 16 are the best fits of single-temperature spherical blackbodies (plotted in red) to the observed excess emission. Presented in Table 5 are these blackbody temperatures, the dust grain blowout radii (), the minimum orbital radii of the dust grains (), the fractional infrared luminosities () for the stars, and an estimate of the minimum dust masses () responsible for the observed excess emission for the early-type Upper Scorpius debris disks. The minimum orbital radii are estimated using:
(7)
where the grain temperature, , is assumed to be the blackbody temperature derived from the photosphere-subtracted SED. The stellar radius () and values are taken from the models of Siess et al. (2000). This simple relation for the minimum orbital radii assumes that the dust grains act as blackbodies in radiative equilibrium with the host star. The derived minimum radii range from 11 AU to more than 50 AU. The infrared luminosities () of the early-type Upper Scorpius members are derived from:
(8)
where is the solid angle subtended by the grains (derived from the single-temperature blackbody radius used to model the excess emission), and is the distance to the star assumed to be 145 pc. The resulting fractional infrared luminosities (/) are tabulated in Table 5 and vary from 10-4 to 10-6, a typical range for debris disk systems (Chen et al. 2006). To estimate the minimum mass of the dust responsible for the observed excess emission, we assume the dust grains have sizes equal to the blowout radii derived above. Following the assumptions outlined by Chen et al. (2006) and Jura et al. (1998) for the grain shapes, absorption cross-sections, and the distribution of dust around the star, the minimum dust masses are given by:
(9)
The derived dust masses vary considerably, from 1.010-4 M⊕ for the B9V-type HIP 80024 to 1.110-6 M⊕ for the A0-type star HIP 79156. These values, however, are comparable to dust masses estimated around more evolved debris disk systems (Chen et al. 2006).
The lack of short wavelength ( 8 m) excesses, the low fractional infrared luminosities, the absence of prominent silicate features, and a lack of accretion activity (see §4) for the A and B-type stars in Upper Scorpius suggests that the dust emission originates from a debris disk for most sources. Note, however, that two of the early-type members (Table 1) are possibly Be-stars and the infrared excess likely originates from free-free or free-bound emission from a thin equatorial disk of gas. The detected 8–10 m excesses for all early-type members of Upper Scorpius is somewhat unusual given that Chen et al. (2006) find such short wavelength disk emission only among some of their IRAS-selected main sequence debris disk sample. Sicilia-Aguilar et al. (2007), however, find similar 8 m excesses associated with several intermediate mass (A0–F5.5) stars in the 4 Myr old cluster Trumpler 37 and the 10 Myr old cluster NGC 7160. If the Upper Scorpius early-type stars are debris disk systems, they are among the youngest known. A more detailed analysis of the early-type excess members is forthcoming (Carpenter et al. in preparation).
7 Conclusions
We have examined mid-infrared spectra and high resolution optical spectra of a substantial fraction (26/35) of the infrared excess members of the Upper Scorpius OB association identified by Carpenter et al. (2006). The IRS sample spans spectral types from B8 to M5. This coeval sample of stars, having a well-established age of 5 Myr, is directly compared with the Class II population of the 1–3 Myr old Taurus-Auriga star forming region. The principal results from the investigation are summarized below.
1. Few (7/35) members of the Upper Scorpius excess population, all late-type (K+M), are found to be accreting using the H velocity width accretion criterion of White & Basri (2003). The mean value for the 6 Upper Scorpius accretors with masses ranging between 0.27 and 1.07 M⊙ (10-9.0 M⊙ yr-1) is an order of magnitude lower than a similar sample of accreting CTTS in the Taurus-Auriga star forming region.
2. Among early-type (B+A) excess stars, the IRS spectra show a featureless continuum with an infrared excess present for m. The lack of 10 and 20 m silicate solid state features indicates that hot sub-micron grains are not present. None of the early-type stars examined with HIRES show signs of gas accretion. Outside of two likely Be-stars, these properties are qualitatively consistent with the properties of debris disk systems.
3. In contrast with the early-type excess stars, all but one late-type (K+M) disk-bearing member of Upper Scorpius exhibit the 10 and 20 m silicate emission features produced by sub-micron scale dust grains in the optically thin disk surface layer. A broad range of solid state emission strengths is present, comparable in many respects to those observed among the Class II population of Taurus-Auriga.
4. We find significant differences in the near-infrared and mid-infrared excess properties between Upper Scorpius low-mass stars and the Class II population in Taurus-Auriga. Approximately half of the Taurus-Auriga Class II sources exhibit band excesses, but only 2 late-type Upper Scorpius members exhibit similar excess emission. Moreover, the Upper Scorpius sample shows reduced levels of excess emission as measured by the , , and color excess distributions. Comparing the SEDs of a representative sample of near solar-mass (K5–M2 type) and low-mass (M3–M5 type) Upper Scorpius members with radiative transfer models of young stellar objects, we find that the observed SEDs are consistent with models having inner disk radii ranging from 0.2 to 1.2 AU. Between 8 and 35 m, the excess flux around K5–M2 stars in Upper Scorpius is a factor of 2 lower than corresponding stars in Taurus-Auriga. While low-mass stars in Upper Scorpius show reduced levels of excess emission relative to Taurus-Auriga, the SED slope between 6 and 25 m is similar as measured by the and spectral indices. These results suggest that disk evolution is discernable over the 2–4 Myr in age separating these disk-bearing populations. The ubiquity of depleted inner disks in the Upper Scorpius excess sample suggests that such disks are a common evolutionary pathway that persists for some time.
References
- (1) Alexander, R. D., Clarke, C. J., & Pringle, J. E. 2006, MNRAS, 369, 229
- (2) Artymowicz, P. 1988, ApJ, 335, L79
- (3) Batalha, C. C. & Basri, G. 1993, ApJ, 412, 363
- (4) Blaauw, A. 1991, in The Physics of Star Formation and Early Stellar Evolution, ed. C. J. Lada & N. D. Kylafis (Dordrecht: Kluwer), 125
- (5) Carpenter, J. M., Mamajek, E. E., Hillenbrand, L. A., & Meyer, M. R. 2006, ApJ, 651, L49
- (6) Carpenter, J. M. et al. 2008, ApJS, 179, 423
- (7) Carpenter, J. M. et al. 2009, in preparation
- (8) Chen, C. H., Sargent, B. A., Bohac, C., Kim, K. H., Leibensperger, E., Jura, M., et al. 2006, ApJSS, 166, 351
- (9) Dahm, S. E. & Hillenbrand, L. A. 2007, AJ, 133, 2072
- (10) Dahm, S. E. 2008, AJ, 136, 521
- (11) de Zeeuw, P. T., Hoogerwerf, R., de Bruijne, J. H. J., Brown, A. G. A., & Blaauw, A. 1999, AJ, 117, 354
- (12) D’Alessio, P., Canto, J., Hartmann, L., Calvet, N., & Lizano, S. 1999, ApJ, 511, 896
- (13) D’Alessio, P. D., Calvet, N., Hartmann, L., Franco-Hernandez, R., & Servin, H. 2006, ApJ, 638, 314
- (14) Dullemond, C. P., Dominik, C., & Natta, A. 2001, ApJ, 560, 957
- (15) Espaillat, C., Calvet, N., D’Alessio, P., Hernandez, J., Qi, C., Hartmann, L., Furlan, E., & Watson, D. M. 2007, 670, L135
- (16) Furlan, E., Hartmann, L., Calvet, N., D’Alessio, P., Franco-Hernandez, R., Forrest, W. J., Watson, D. M. et al. 2006, ApJSS, 165, 568
- (17) Gullbring, E., Hartmann, L., Briceno, C., & Calvet, N. 1998, ApJ, 492, 323
- (18) Haisch, K. E., Jr., Lada, E. A., & Lada, C. J. 2001, ApJ, 553, L153
- (19) Hamann, F. & Persson, S. E. 1992, ApJ, 394, 628
- (20) Hartigan, P. & Kenyon, S. J. 2003, ApJ, 583, 334
- (21) Hartmann, L. 2005, in Chondrites and the Protoplanetary Disk, ASP Conference Series, 341, ed. A. N. Krot, E. R. D. Scott, & B. Reipurth, San Francisco, ASP, 131
- (22) Hartmann, L., Megeath, S. T., Allen, L., Luhman, K., Calvet, N., D’Alessio, P., Franco-Hernandez, R., & Fazio, G. 2005, ApJ, 629, 881
- (23) Hernandez, J., Calvet, N., Briceno, C., Hartmann, L., Vivas, A. K., Muzerolle, J., Downes, J., Allen, L., & Gutermuth, R. 2007, ApJ, 671, 1784
- (24) Herczeg, G. J. & Hillenbrand, L. A. 2008, ApJ, 681, 594
- (25) Hauschildt, P. H., Allard, F, & Baron, E. 1999, ApJ, 512, 377
- (26) Higdon, S. J. U., Devost, D., Higdon, J. L., Brandl, B. R., Houck, J. R., Hall, P. et al. 2004, PASP, 116, 975
- (27) Keller, L. D., Sloan, G. C., Forrest, W. J., Ayala, S., D’Alessio, P., Shah, S., et al. 2008, ApJ, 684, 411
- (28) Kenyon, S. J., & Hartmann, L. 1995, ApJS, 101, 117
- (29) Kohler, R., Kunkel, M., Leinert, C., & Zinnecker, H. 2000, A&A, 356, 541a
- (30) Kunkel, M. 1999, Ph.D. thesis, Julius-Maximilians-Univ., Wurzburg
- (31) Lada, C. J., Muench, A. A., Luhman, K. L., Allen, L., Hartmann, L., Megeath, T., Myers, P., Fazio, G., Wood, K., Muzerolle, J., Rieke, G., Siegler, N., & Young, E. 2006, AJ, 131, 1574
- (32) Lanz, T. & Catala, C. 1992, A&A, 257, 663
- (33) Luhman, K. L., Whitney, B. A., Meade, M. R., Babler, B. L., Indebetouw, R., Bracker, S., & Churchwell, E. B. 2006, ApJ, 647, 1180
- (34) Mamajek, E. E., Meyer, M. R., Hinz, P. M., Hoffmann, W. F., Cohen, M., & Hora, J. L. 2004, ApJ, 612, 496
- (35) Martín, E. L. 1998, AJ, 115, 351
- (36) Muzerolle, J., Hartmann, L., & Calvet, N. 1998, AJ, 116, 455
- (37) Muzerolle, J., Calvet, N., Brice o, C., Hartmann, L., & Hillenbrand, L. 2000, ApJ, 535, L47
- (38) Muzerolle, J., Adame, L., D’Alessio, P., Calvet, N., Luhman, K. L., Muench, A. A. et al. 2006, ApJ, 643, 1003
- (39) Najita, J. R., Strom, S. E., Muzerolle, J. 2007, MNRAS, 378, 369
- (40) O’Connell, R. W. 1973, AJ, 78, 1074
- (41) Padgett, D. et al. 2008, in preparation.
- (42) Pascucci, I., Apai, D., Luhman, K., Henning, Th., Bouwman, J., Meyer, M., Lahuis, F., & Natta, A. 2009, ApJ, submitted for publication
- (43) Plavchan, P., Jura, M., & Lipscy, S. J. 2005, 631, 1161
- (44) Preibisch, T., Guenther, E., Zinnecker, H., Sterzik, M., Frink, S., & Roeser, S. 1998, A&A, 333, 619
- (45) Preibisch, T., & Zinnecker, H. 1999, AJ, 117, 2381
- (46) Preibisch, T., Brown, A. G. A., Bridges, T., Guenther, E., & Zinnecker, H. 2002, AJ, 124, 404
- (47) Reach, W. T., Megeath, S. T., Cohen, M., Hora, J., Carey, S., Surace, J., Willner, S. P., Barmby, P., Wilson, G., Glaccum, W., Lowrance, P., Marengo, M., & Fazio, G. G. 2005, PASP,117,978
- (48) Robitaille, T. P., Whitney, B. A., Indebetouw, R., Wood, K., and Denzmore, P. 2006, ApJS, 167, 256
- (49) Robitaille, T. P., Whitney, B. A., Indebetouw, R., and Wood, K. 2007, ApJS, 169, 328
- (50) Sicilia-Aguilar, A., Hartmann, L. W., Watson, D., Bohac, C., Henning, T., & Bouwman, J. 2007, ApJ, 659, 1637
- (51) Siess, L., Dufour, E., & Forestini, M. 2000, A&A, 358, 593
- (52) Silverstone, M. D., Meyer, M. R., Mamajek, E. E., Hines, D. C., Hillenbrand, L. A., Najita, J. et al. 2006, ApJ, 639, 1138
- (53) Slesnick, C. L., Hillenbrand, L. A., & Carpenter, J. M. 2008, ApJ, accepted for publication
- (54) Sloan, G. C., Keller, L. D., Forrest, W. J., Leibensperger, E., Sargent, B., Li, A., et al. 2005, 632, 956
- (55) Uchida, K. I., Calvet, N., Hartmann, L., Kemper, F., Forrest, W. J. et al. 2004, ApJS, 154, 539
- (56) Valenti, J. A., Basri, G., & Johns, C. M. 1993, AJ, 106, 2024
- (57) Vogt, S. S., Allen, S. L., Bigelow, B. C., Bresee, L., Brown, B., Cantrall, T. et al. 1994, SPIE, 2198, 362
- (58) Walter, F. M., Vrba, F. J., Mathieu, R. D., Brown, A., & Myers, P. C. 1994, AJ, 107, 692
- (59) Werner, M. W., Roellig, T. L., Low, F. J., Rieke, G. H., Rieke, M., Hoffmann, W. F. et al. 2004, ApJS, 154, 1
- (60) White, R. J. & Basri, G. 2003, ApJ, 582, 1109
- (61) White, R. J. & Hillenbrand, L. A. 2004, ApJ, 616, 998
- (62) Zasowski, G., Markwick-Kemper, Watson, D. M., Furlan, E., Bohac, C. J., Hull, C., & Green, J. D. 2008, in press


| Source | STaaSpectral type from the literature. | bbExtinction estimates are taken from Preibisch & Zinnecker (1999) and Preibisch et al. (2002). | VrccRadial velocity estimates from the literature for early-type (B+A) members and from cross-correlation analysis of HIRES observations for late-type (K+M) members. | W(H)ddNegative values indicate emission. abs - absorption, cer - core emission reversal, ipc - inverse P Cygni. | W(He I)ddNegative values indicate emission. abs - absorption, cer - core emission reversal, ipc - inverse P Cygni. | W(H)ddNegative values indicate emission. abs - absorption, cer - core emission reversal, ipc - inverse P Cygni. | W(Li I) | W(Ca II)eeNegative values indicate emission. If core emission reversal is present, equivalent widths are measured from the base of the Ca II absorption profile. | Other Emissionff[O I] 6300, He I 6678, [S II] 6617, 6731. | CommentsggBe: classical Be star; CTTS/WTTS determination using the spectral type dependent W(H) criteria of White & Basri (2003); Accretion based upon H velocity width analysis. |
|---|---|---|---|---|---|---|---|---|---|---|
| (mag) | (km s-1) | (Å) | 5876(Å) | (Å) | 6708(Å) | 8542(Å) | ||||
| HIP 77859 | B2 | 0.5 | 8.6 | abs | abs | abs | … | abs | Be | |
| HIP 78207 | B8 | 0.0 | 5.6 | 21.37 | abs | ipc | … | abs | Be | |
| HIP 77911 | B9 | 2.9 | 12.16 | abs | abs | abs | … | abs | ||
| HIP 79410 | B9 | 0.6 | 9.4 | abs | abs | abs | … | abs | ||
| HIP 79439 | B9 | 0.6 | 9.5 | abs | abs | abs | … | abs | ||
| HIP 80024 | B9 | 0.7 | 9.25 | abs | abs | abs | 0.03: | abs | ||
| HIP 76310 | A0 | 0.3 | 3.72 | abs | abs | abs | … | abs | ||
| HIP 79156 | A0 | 0.5 | 9.17 | abs | abs | abs | … | abs | ||
| HIP 79878 | A0 | 0.0 | 5.64 | abs | abs | abs | … | abs | ||
| HIP 78996 | A9 | 0.3 | 12.52 | abs | abs | abs | … | abs | ||
| HIP 80088 | A9 | 0.3 | 11.05 | abs | abs | abs | … | abs | ||
| PZ99J161411.0-230536 | K0 | 2.4 | … | +0.80 | +0.07 | +0.38 | 0.41 | 0.29 | WTTS | |
| PZ99J160421.7-213028 | K2 | 1.0 | 6.271.46 | cer | cer | 0.57 | 0.45 | 0.43 | 6300 | WTTS |
| PZ99J160357.6-203105 | K5 | 0.9 | 7.741.46 | 0.94 | 0.06 | 11.57 | 0.49 | 0.57 | 6300 | CTTS, accretor |
| J160643.8-190805 | K6 | 1.9 | 6.271.04 | 0.67 | 0.07 | 2.39 | 0.51 | 0.59 | WTTS | |
| J160900.7-190852 | K9 | 0.8 | 7.810.38 | 6.81 | 0.50 | 20.08 | 0.50 | 0.75 | 6300, 6678 | CTTS, accretor |
| J160823.2-193001 | K9 | 1.5 | 5.832.99 | 2.28 | 0.18 | 2.75 | 0.56 | 0.34 | WTTS | |
| J161420.2-190648 | M0 | 1.8 | 7.252.16 | 7.25 | 1.07 | 43.72 | 0.39 | 0.54 | 6300, 6678, 6717, 6731 | CTTS, accretor |
| ScoPMS 31 | M0.5 | 0.6 | 5.410.98 | 5.61 | 0.50 | 21.06 | 0.53 | 0.79 | 6300 | CTTS, accretor |
| PZ99J155734.4-232111 | M1 | 0.8 | 4.632.00 | 2.41 | 0.16 | 3.65 | 0.61 | 0.32 | WTTS | |
| J161115.3-175721 | M1 | 1.6 | 7.770.90 | 2.19 | 0.18 | 4.47 | 0.54 | 0.81 | 6300 | WTTS |
| J160545.4-202308 | M2 | 1.4 | … | 1.04 | 0.13 | 2.04 | 0.32 | 0.17 | WTTS, SB2 | |
| J160357.9-194210 | M2 | 1.7 | 3.820.83 | 2.43 | 0.20 | 2.70 | 0.41 | 0.45 | 6300 | WTTS |
| J160953.6-175447 | M3 | 4.1 | 6.301.05 | 13.68 | 2.19 | 22.23 | 0.59 | 0.23 | 6300, 6678 | CTTS |
| J155829.8-231007 | M3 | 0.0 | 5.630.89 | 55.00 | 8.83 | 158.48 | 0.31 | 0.84 | 6300, 6678 | CTTS, accretor |
| J155706.4-220606 | M4 | 2.0 | 6.111.74 | 8.43 | 0.49 | 9.92 | 0.54 | 0.43 | 6300, 6678 | WTTS, accretor |
| J155729.9-225843 | M4 | 1.4 | 1.501.06 | 5.63 | 0.65 | 6.91 | 0.59 | 0.05 | 6300, 6678 | WTTS |
| J160959.4-180009 | M4 | 0.2 | 7.501.39 | 3.64 | 0.25 | 4.41 | 0.58 | 0.46 | 6300 | WTTS |
| J155624.8-222555 | M4 | 1.7 | 6.880.83 | 5.48 | 0.36 | 5.51 | 0.60 | 0.07 | 6300 | WTTS |
| J160525.5-203539 | M5 | 1.5 | 4.171.63 | 9.53 | 0.63 | 8.61 | 0.62 | 0.42 | 6300, 6678 | WTTS |
| J160532.1-193315 | M5 | 0.0 | 3.361.58 | 101.91 | 7.78 | 152.12 | 0.39 | 0.75 | 6300, 6678 | CTTS, accretor |
| J160611.9-193532 | M5 | 0.9 | 7.385.84 | 13.31 | 1.40 | 15.24 | 0.67 | 0.06 | WTTS, multiple | |
| J160622.8-201124 | M5 | 0.0 | 5.540.88 | 3.25 | 0.17 | 3.12 | 0.59 | 0.78 | 6300 | WTTS |
| J160702.1-201938 | M5 | 1.7 | 5.001.78 | 5.27 | 0.84 | 8.30 | 0.58 | 0.21 | 6678 | WTTS |
| J160827.5-194904 | M5 | 1.4 | 7.141.68 | 18.05 | 3.00 | 14.56 | 0.52 | 0.11 | 6678 | WTTS |
| J160900.0-190836 | M5 | 0.7 | 8.601.37 | 12.85 | 1.15 | 12.88 | 0.56 | 0.12 | 6678 | WTTS |
| J160600.6-195711 | M5 | 1.7 | 5.511.90 | 4.74 | 0.30 | 4.11 | 0.57 | 0.69 | 6678 | WTTS |
| B9–A9 | |||
|---|---|---|---|
| Wavelength | MedianaaUnits of median, lower, and upper quartiles are ergs s-1 cm-2 | Lower QuartileaaUnits of median, lower, and upper quartiles are ergs s-1 cm-2 | Upper QuartileaaUnits of median, lower, and upper quartiles are ergs s-1 cm-2 |
| (m) | log(Fν) | log(Fν) | log(Fν) |
| 1.25 | 8.28 | 8.30 | 8.27 |
| 1.65 | 8.60 | 8.60 | 8.60 |
| 2.17 | 8.88 | 8.89 | 8.87 |
| 5.70 | 10.04 | 10.10 | 10.03 |
| 7.10 | 10.34 | 10.39 | 10.32 |
| 8.00 | 10.56 | 10.58 | 10.52 |
| 9.20 | 10.67 | 10.70 | 10.62 |
| 9.80 | 10.71 | 10.74 | 10.65 |
| 11.30 | 10.86 | 10.89 | 10.81 |
| 12.30 | 10.90 | 11.00 | 10.89 |
| 13.25 | 10.97 | 11.09 | 10.94 |
| 16.25 | 11.25 | 11.32 | 11.16 |
| 18.00 | 11.24 | 11.30 | 11.18 |
| 21.00 | 11.28 | 11.39 | 11.25 |
| 25.00 | 11.34 | 11.49 | 11.29 |
| 30.00 | 11.46 | 11.61 | 11.27 |
| 34.00 | 11.53 | 11.62 | 11.16 |
| K5–M2 | |||
| Wavelength | MedianaaUnits of median, lower, and upper quartiles are ergs s-1 cm-2 | Lower QuartileaaUnits of median, lower, and upper quartiles are ergs s-1 cm-2 | Upper QuartileaaUnits of median, lower, and upper quartiles are ergs s-1 cm-2 |
| (m) | log(Fν) | log(Fν) | log(Fν) |
| 1.25 | 9.09 | 9.13 | 9.06 |
| 1.65 | 9.16 | 9.16 | 9.16 |
| 2.17 | 9.36 | 9.39 | 9.32 |
| 5.70 | 10.18 | 10.29 | 10.12 |
| 7.10 | 10.40 | 10.48 | 10.33 |
| 8.00 | 10.49 | 10.55 | 10.41 |
| 9.20 | 10.37 | 10.42 | 10.10 |
| 9.80 | 10.33 | 10.41 | 10.04 |
| 11.30 | 10.35 | 10.52 | 10.11 |
| 12.30 | 10.50 | 10.68 | 10.30 |
| 13.25 | 10.55 | 10.65 | 10.33 |
| 16.25 | 10.48 | 10.70 | 10.23 |
| 18.00 | 10.30 | 10.64 | 10.10 |
| 21.00 | 10.27 | 10.68 | 10.11 |
| 25.00 | 10.29 | 10.83 | 10.18 |
| 30.00 | 10.41 | 11.04 | 10.33 |
| 34.00 | 10.44 | 11.05 | 10.32 |
| M3–M5 | |||
| Wavelength | MedianaaUnits of median, lower, and upper quartiles are ergs s-1 cm-2 | Lower QuartileaaUnits of median, lower, and upper quartiles are ergs s-1 cm-2 | Upper QuartileaaUnits of median, lower, and upper quartiles are ergs s-1 cm-2 |
| (m) | log(Fν) | log(Fν) | log(Fν) |
| 1.25 | 10.41 | 10.43 | 10.35 |
| 1.65 | 10.49 | 10.49 | 10.49 |
| 2.17 | 10.65 | 10.67 | 10.64 |
| 5.70 | 11.55 | 11.62 | 11.40 |
| 7.10 | 11.77 | 11.88 | 11.58 |
| 8.00 | 11.78 | 11.98 | 11.67 |
| 9.20 | 11.72 | 11.92 | 11.51 |
| 9.80 | 11.70 | 11.95 | 11.52 |
| 11.30 | 11.77 | 12.07 | 11.68 |
| 12.30 | 11.84 | 12.21 | 11.70 |
| 13.25 | 11.85 | 12.25 | 11.74 |
| 16.25 | 12.04 | 12.32 | 11.85 |
| 18.00 | 11.90 | 12.24 | 11.69 |
| 21.00 | 11.94 | 12.28 | 11.67 |
| 25.00 | 12.00 | 12.36 | 11.66 |
| 30.00 | 12.04 | 12.42 | 11.67 |
| 34.00 | 11.99 | 12.46 | 11.62 |
| Source | (veiling)aaDefined such that . | MassbbStellar Mass (M⊙) from the models of Siess et al. (2000). | RadiusccStellar Radius (R⊙) from the models of Siess et al. (2000). | log ddMass accretion rate derived from the optical veiling analysis near 6500. | log eeMass accretion rate derived from the log-linear relation between Ca II 8542 emission line luminosity and accretion luminosity from Herczeg & Hillenbrand (2008). |
|---|---|---|---|---|---|
| (M⊙) | (R⊙) | log (M⊙/yr) | log (M⊙/yr) | ||
| PZ99J160357.6-203105 | 0.16 | 1.07 | 1.51 | 9.12 | 9.10 |
| J160900.7-190852 | 0.1 | 0.58 | 1.12 | 9.95 | 9.30 |
| J161420.2-190648 | 1.0 | 0.58 | 1.07 | 8.91 | 8.89 |
| ScoPMS 31 | 0.05 | 0.50 | 1.49 | 10.0 | 8.85 |
| J155829.8-231007 | 1.50 | 0.27 | 0.41 | 9.91 | 10.49 |
| J155706.4-220606 | 0.39 | 0.30 | 1.39 | 9.14 | 9.69 |
| J160532.1-193315 | 0.18 | 0.11 | 0.46 | 10.97 | 10.54 |
| Source | n6-13aaSpectral indices defined in §5.3, from 6 to 13 m, 13 to 25 m, and 6 to 25 m | n13-25aaSpectral indices defined in §5.3, from 6 to 13 m, 13 to 25 m, and 6 to 25 m | n6-25aaSpectral indices defined in §5.3, from 6 to 13 m, 13 to 25 m, and 6 to 25 m | bbThe continuum subtracted, integrated flux of the 10 m silicate emission feature normalized to the continuum. |
|---|---|---|---|---|
| HIP 80024 | 2.66 | 0.76 | 1.84 | 0.01 |
| HIP 80088 | 2.73 | 1.09 | 2.02 | 0.02 |
| HIP 79878 | 2.57 | 1.65 | 2.17 | 0.07 |
| HIP 79439 | 2.76 | 2.27 | 2.55 | 0.05 |
| HIP 79410 | 2.33 | 1.56 | 2.00 | 0.06 |
| HIP 79156 | 2.53 | 2.03 | 2.31 | 0.02 |
| HIP 78996 | 2.50 | 1.50 | 2.07 | 0.05 |
| HIP 76310 | 2.17 | 0.83 | 0.89 | 0.04 |
| PZ99J161411.0-230536 | 0.44 | 1.39 | 0.85 | 0.16 |
| PZ99J160421.7-213028 | 2.69 | 0.76 | 1.84 | 0.12 |
| PZ99J160357.6-203105 | 0.78 | 0.43 | 0.26 | 0.31 |
| J161420.2-190648 | 0.58 | 0.07 | 0.36 | 0.84 |
| J161115.3-175721 | 0.97 | 1.08 | 1.02 | 0.63 |
| J160900.7-190852 | 0.09 | 0.40 | 0.12 | 0.78 |
| J160823.2-193001 | 0.65 | 0.35 | 0.52 | 0.27 |
| J160702.1-201938 | 1.51 | 0.67 | 1.15 | 0.30 |
| J160643.8-190805 | 2.15 | 1.45 | 1.85 | 0.01 |
| J160357.9-194210 | 1.41 | 0.40 | 0.98 | 0.66 |
| ScoPMS 31 | 0.87 | 1.31 | 0.07 | 0.36 |
| J160959.4-180009 | 0.36 | 1.17 | 0.30 | 1.08 |
| J160953.6-175446 | 1.15 | 0.69 | 0.95 | 0.22 |
| J160900.0-190836 | 0.85 | 0.39 | 0.32 | 0.53 |
| J160827.5-194904 | 1.58 | 1.12 | 1.38 | 0.35 |
| J160622.8-201124 | 1.02 | 0.54 | 0.36 | 0.70 |
| J160600.6-195711 | 1.89 | 0.26 | 1.18 | 0.30 |
| J160532.1-193315 | 0.72 | 2.90 | 1.66 | … |
| Source | aaThe blackbody temperature used to fit the photosphere-subtracted IRS spectrum. | bbThe fractional infrared luminosity of the source. | ccThe minimum orbital radius of the dust grains. | ddThe dust grain blow-out radius due to stellar radiation pressure. | eeThe minimum dust mass responsible for the observed excess emission. |
|---|---|---|---|---|---|
| (K) | (AU) | (m) | (M⊕) | ||
| HIP 76310 | 122 | 2.110-4 | 29 | 3.0 | 8.210-5 |
| HIP 78996 | 150 | 7.710-5 | 11 | 1.4 | 2.010-6 |
| HIP 79156 | 150 | 7.710-5 | 12 | 1.4 | 1.110-6 |
| HIP 79410 | 195 | 2.610-5 | 15 | 4.3 | 4.010-6 |
| HIP 79439 | 150 | 5.610-6 | 26 | 4.8 | 2.910-6 |
| HIP 79878 | 170 | 2.610-5 | 15 | 3.0 | 2.810-6 |
| HIP 80024 | 105 | 5.810-5 | 55 | 3.7 | 1.010-4 |
| HIP 80088 | 120 | 8.810-5 | 13 | 1.0 | 2.410-6 |