Dynamical constraints on the neutron star mass in EXO 0748-676
Abstract
We present VLT intermediate resolution spectroscopy of UY Vol, the optical counterpart of the LMXB X-ray burster EXO 0748-676. By using Doppler tomography we detect narrow components within the broad He ii , and emission lines. The phase, velocity and narrowness of these lines are consistent with their arising from the irradiated hemisphere of the donor star, as has been observed in a number of LMXBs. Under this assumption we provide the first dynamical constraints on the stellar masses in this system. In particular, we measure . Using this value we derive and . We find for the case of a main sequence companion star. Our results are consistent with the presence of a massive neutron star as has been suggested by Özel (2006), although we cannot discard the canonical value of .
keywords:
accretion disks - binaries: close - stars: individual: EXO 0748-676 - X-rays:stars1 Introduction
EXO 0748-676 (=UY Vol) is a Low Mass X-ray Binary (LMXB) discovered as a transient source by EXOSAT in 1985 (Parmar et al. 1985). Instead of returning to the quiescent state the system had remained in an active state ever since, showing typical properties of persistent LMXBs. However, it has returned to the off-state very recently (Hynes & Jones, 2008).
EXO 0748-676 also exhibits irregular X-ray dips and periodic eclipses which have provided an excellent determination of the orbital period (P=3.82 h) and the orbital inclination (; Parmar et al. 1986). On the other hand, Villarreal & Strohmayer (2004) have detected a burst oscillation at 45 Hz during type I X-ray burst events which is associated with the neutron star (NS) spin frequency. Recently, Özel (2006) have suggested the presence of a massive NS with and km in EXO 0748-676. This result is based on the gravitational redshift measured in O and Fe absorption lines arising from the surface of the NS (Cottam et al. 2002) and the assumption that the strong thermonuclear X-ray bursts displayed by the system (Gottwald et al. 1986) can be modelled by a phase of symmetric expansion of the NS radius and a cooling phase where the X-ray emission is Eddington-limited. In contrast, Pearson et al. (2006) have reported He ii Doppler tomograms which show a spot consistent with the expected gas stream position. These authors favor a NS of by fitting different gas stream trajectories to the position of the spot.
In this paper we present VLT-FORS1 spectroscopy of the optical counterpart (UY Vol) of EXO 0748-676 which reveals the presence of narrow emission components within the He ii emission lines. In recent years, narrow emission lines from the donor have been detected in several LMXBs (see Cornelisse et al. 2008 for details, also Casares 2009) since they were first discovered by Steeghs & Casares (2002) in Sco X-1. The Roche lobe filling donor star intercepts the energetic photons from the inner accretion disc resulting in the observed optical emission lines from its surface. The Doppler motion of these lines traces the orbit of the companion star, thereby providing the first constraints on the binary parameters for persistent systems where the photospheric light from the companion is otherwise swamped by the bright accretion disc. It is remarkable that this technique has proved the presence of a black hole with a mass in GX339-4 (Hynes et al. 2003; Muñoz-Darias et al. 2008), presented evidence for a massive NS in Aql X-1 (Cornelisse et al. 2007) and X1822-371 (Casares et al. 2003; Muñoz-Darias et al. 2005), and provided the first contraints on the binary parameters in six other LMXBs, including the prototypical system Sco X-1 (Steeghs & Casares 2002). In this letter we present the first dynamical constraints on the stellar masses in EXO 0748-676 based on the study of the narrow components present within the He ii 4541, 4686 and 5412 emission profiles. In section 2 we describe the observations and data reduction process, whereas the data analysis is presented in section 3. Results are discussed in sections 4 and 5.
2 Observations and data reduction
We observed EXO 0748-676 on 22 Jan 2008 using the FOcal Reducer and low dispersion Spectrograph-1 (FORS1) attached to the VLT-UT2 (Kueyen) telescope at the Observatorio Astronómico Cerro Paranal (Chile). We used the GRIS_1200g holographic grating obtaining a total of 28 spectra of 600s each. The slit width was fixed at 0.51-arsec resulting in a spectral resolution of km s-1 and a wavelength coverage of Å. The seeing stayed between 0.4-0.6-arsec during the first 4 hours but it increased up to 1-arsec during the last hour of the run, making slit losses significant and absolute flux calibration unreliable for this part of the night. In total we covered binary orbits (i. e. h of data). The images were de-biased and flat-fielded and the spectra extracted using conventional iraf routines. The wavelength calibration was performed by fitting a fourth-order polynomial to an arc image taken during daytime. This resulted in a dispersion of 0.73 Å pix-1 and rms scatter Å. We used the sky spectra to correct for velocity drifts due to instrumental flexure which were found to be km s-1 (i. e. pix). The zero point of the wavelength scale was established from the position of the strong OI skyline. The spectra were finally flux calibrated using observations of the flux standard LTT 1788 and exported into our analysis software (molly).

3 Data Analysis
Fig. 1 shows the average spectrum of EXO 0748-676. In order to produce this
figure we used the 21 out-of-eclipse spectra taken with good seeing conditions,
comparable to the slit-width. The H and H double peak emission lines
together with the strong He ii , ,
features and the Bowen blend at are clearly seen in
the spectrum. He i , , and Fe ii 5284 are
also detected, although they are less prominent. In this paper we will focus
on the analysis of the He ii emission lines where narrow components are found.
In order to compute the orbital phase of each spectrum we used the
constant-period ephemeris given by Wolff et al. (2002). The zero-phase has been
refined by fitting the mid-eclipse time of an eclipse observed by RXTE on 30
Jan 2008 (i.e. only 8 days after our observations). We find an error of
in orbital phase which has been corrected in the ephemeris. We
finally adopted:
3.1 Systemic velocity
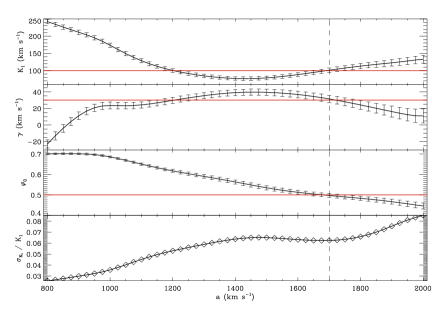
As in our previous work, we decided to apply the double gaussian technique (Schneider & Young, 1980) to the wings of the He ii 4686 emission line in order to obtain a first estimate of the orbital parameters of the NS. We have used relative Gaussian separations between in steps of 25 . This range has been chosen to avoid low velocity components associated with the companion star and the outer disc. After fitting the expression
| (1) |
to the radial velocity curves extracted for each value of , we obtain the diagnostic diagram presented in Fig. 2. We adopt the value of where the phase is correct and also happend to occur near the plateau in the diagnostic parameter (Shafter et al., 1986). This results in and .
This method assumes that the emission line gas orbits the compact object and correctly traces its orbital dynamics. Non-isotropic emisison and/or significant disk asymmetries are known to lead to significant distortions in the radial velocity curves and thus the inferred . For this reason the values provided by the diagnostic-diagram should be taken as a rough approximation to the real ones, as will be discussed in the next section.
3.2 Doppler mapping
Extracting radial velocities of faint short-period systems is not straightforward. The situation is even more difficult when dealing with narrow spectral lines which require high spectral resolution. The spectral resolution also degrades with exposure time due to orbital smearing, whereas the signal-to-noise ratio (S/N) obviously increases for longer integrations. Therefore, in order to avoid significant orbital smearing one has to use short exposures (600 s in our case) which results in data sets with good orbital sampling but poor .
Using Doppler tomography (Marsh & Horne, 1988) instead of standard radial velocity curves has the benefit of using all the spectra at the same time, allowing one to map the brightness distribution of a weak emission line in velocity space. This method has been used in almost all previous studies of narrow emission lines (see e.g. Casares et al. 2006), and only for Sco X-1 (with and P=18.9 h) has the application of both techniques separately (i.e. radial velocity curves and Doppler mapping) been possible. In that case a good agreement between the two methods was found (Steeghs & Casares, 2002).
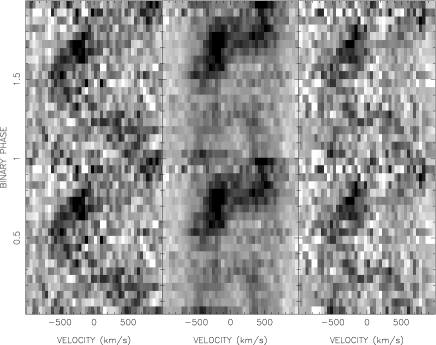
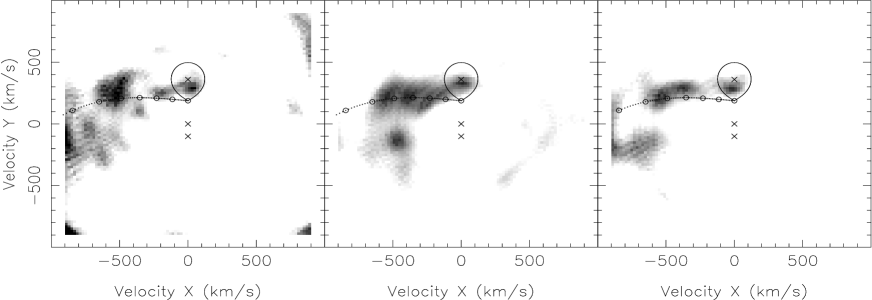
Fig. 3 shows the evolution of the He ii , and spectral lines along the orbit. An S-wave with a maximum radial velocity of at orbital phase appears in the 3 maps. This translates into bright spots at =(-500,200) in the Doppler maps of the three He ii lines (Fig. 4). Similar spots were also found by Pearson et al. (2006) in several emission lines (e.g He ii ). However, in this study we also detect in the three maps compact spots at the position of the donor (i.e. ). The velocities associated with these spots are in the range and are shown in table 1.
We have computed Doppler maps for a wide range of values bracketing , the value favored by the diagnostic diagram. We swept between and 100 in steps of 10 . The effect of using a wrong value of when computing the maps is to obtain out-of-focus spots, which become compact when approaching the correct value. By fitting 2D gaussians to the spots as a function of , we favor systemic velocities in the range . We finally selected because it produces significantly more compact spots in the three maps. In any case, the velocity measurements (table 1) derived with are consistent within the errors with those obtained with .
The velocity of a given irradiation line depends on the disc thickness and how transparent it is for the irradiating photons. The three He ii lines that we study here have similar ionization potentials and, hence, one should expect them to show the same value. This is consistent within the error bars with the results that we have obtained. Therefore, we decided to take the weighted mean value of the three lines as our best estimate of , which results in . Hence, we will use as 1-sigma lower limit to .
4 Reprocessed emission from the companion
Using our value derived from the He ii lines and the refined orbital ephemeris it is possible to remove the orbital velocity from each spectrum and compute the average spectrum in the rest frame of the companion. Fig 5 shows this spectrum, where narrow components standing out in the broad He ii , and emission lines are clearly seen. As an independent test to the Doppler analysis, we have computed the spectrum in the rest frame of the donor sweeping a wide range of values. We find that, for a range of values around , the narrow components show show the highest intensities together with narrow widths consistent with the spectral resolution of km s-1.
| He ii | He ii | |
|---|---|---|
Taking into account the position of the spots in the Doppler maps (i.e. orbital phase and velocity), the narrowness of the components and the presence of similar high excitation features in all the persistent LMXBs that we have studied (see Cornelisse et al. 2008) we associate these features with X-ray reprocessing from the irradiated hemisphere of the donor.
It is also noteworthy that we have a tentative detection of the \textN iii and \textC iii components within the Bowen blend in the rest frame of the companion star (left panel in Fig. 5). The weakness of these lines is probably due to the reduced number of spectra. We only cover one orbit and at least two orbits of data are usually required to clearly detect these transitions (e.g. see Casares et al. 2006). However, the He ii emission lines are very strong in this system compared to others previously studied and show narrow components that provide us with the opportunity to measure . It is especially interesting to note that EXO 0748-676 is the only system in the Bowen survey where He ii 4542 is as strong as the Bowen blend. He ii 4686 emission from the donor was also reported by Steeghs & Casares (2002) in Sco X-1, with a value similar to that obtained from the Bowen lines. However, in other bright systems where high signal-to-noise studies have been performed (e.g. X1822-371 Casares et al. 2003) no He ii emission from the donor was found.
5 System parameters
EXO 0748-676 offers important advantages with respect to other persistent LMXBs.
The binary inclination is a known function of the mass ratio owing to the X-ray eclipses (Hynes et al., 2006).
For instance, yields , whereas implies .
Moreover, since X-ray eclipses and X-ray bursts from the NS surface are
observed, the NS must be visible, and hence the disc opening angle ,
which obscures part of the irradiated face of the donor, is also related to
the inclination through
Therefore for a given , the inclination angle and an upper limit to
are set. This is very useful in order to compute the K-correction.
Emission lines formed on the inner hemisphere of the donor star as a result of
X-ray reprocessing only provide a lower limit () to the true
-velocity. In Muñoz-Darias et al. (2005) we model the deviation between the
light-center of the reprocessed lines and the center of mass of a Roche lobe
filling star in a persistent LMXB, including screening effects by a flared
accretion disc (i.e. the K-correction). We find that this correction depends
on , and weakly on the orbital inclination. We now apply the
K-correction to EXO 0748-676 as a function of , including the above limits on
and .

5.1 The mass of the neutron star
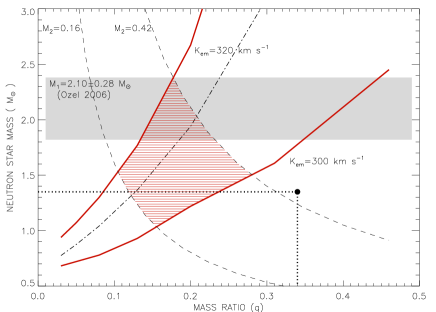
Fig. 6 shows the lower limit to the NS mass as a function of obtained from (lower solid line). Assuming (favored by the diagnostic diagram) we obtain , in agreement with Hynes et al. (2006). On the other hand, if we use the maximum K-correction () and the upper limit we obtain an upper limit to the NS mass (upper solid line in Fig. 6). Meyer & Meyer-Hofmeister (1982) suggest that, even in the absence of irradiation, accretion discs in LMXBs have , which is also consistent with the results by D’Avanzo et al. (2006) for Cen X-4 in quiescence. Applying the the K-correction with and we obtain a less conservative upper limit represented by the dotted-dashed line in Fig. 6.
Pearson et al. (2006) favored y by fitting gas stream trajectories to the extended spot observed in the He ii Doppler map. This pair of values, which is marked by the dotted line in Fig. 6, is not consistent with our results. Conversely, our results are consistent with those derived by Özel (2006), which are represented by the grey region in Fig. 6. Nevertheless, our values are also consistent with the presence of a canonical NS with in EXO 0748-676. However, for this case to work we need
5.2 The nature of the donor star
The parameter constraint for EXO 0748-676 are consistent with a main sequence star and clearly a giant star cannot fit within the 3.8 h Roche lobe. Faulkner et al. (1972) showed that the mean density () of a Roche lobe-filling companion star is determined solely by the binary period :
g cm-3
where is the orbital period in hours.
For EXO 0748-676, with hours, we obtain
(Cox, 2000), which defines the right dashed line in Fig. 6 through
. Combining this relation with the lower, thick solid line we
obtain for the case of a main sequence donor.
Alternatively, the donor star could have evolved before the onset of mass
transfer. For this to happen within a Hubble time, the binary must have
experienced an episode of unstable mass transfer with in a thermal
time scale. The final product of this scenario is a LMXB formed by a donor
star with an evolved nucleus transfering material onto a NS.
Schenker &
King (2002) have computed companion star masses versus the orbital
period for the limiting case of a nearly all helium nuclei.
Using their relation for the case of EXO 0748-676 we obtain
which yields the left dashed line in Fig. 6.
Altogether, the allowed region in the space of parameters yields
and whereas a plausible
implies . It also interesting to consider a limiting case with
, and together with from the diagnostic diagram. For this case we obtain and therefore , favoring the main sequence scenario. However, we note that the unstable mass-transfer scenario was proposed to explain the observations in
XTE J1118+480 (Haswell et al., 2002) and Cyg X-2 (Podsiadlowski & Rappaport, 2000).
More recently, Rodríguez-Gil
et al. (2009) show that the mass of the
companion star in the cataclysmic variable HS 0218+3229 is also in excellent
agreement with the predictions of Schenker &
King (2002).
6 Conclusions
We present the first dynamical determination of the NS mass in EXO 0748-676. Assuming that the narrow components detected within the He ii , and emission lines arise from the irradiated hemisphere of the donor we measure which results in and . On the other hand, the mass of the donor star is constrained to through unstable mass-transfer/main sequence models. For the case of a main sequence donor we find .
Our results are consistent with the Özel (2006) scenario and rule out other system parameters proposed by Pearson et al. (2006). However, our observations are also consistent with a canonical mass NS and more observations are required to further constrain the mass of the NS in EXO 0748-676. Recently, EXO 0748+676 has been reported to reach quiescence at after 22 years of activity (Hynes & Jones, 2008). This provides an excellent opportunity to measure the orbit of the companion star and determine the mass of the NS.
JC acknowledges support from the Spanish Ministry of Science and Technology through the project AYA2007-66887.DS acknowledges a STFC Advanced Fellowship. Partially funded by the Spanish MEC under the Consolider-Ingenio 2010 Program grant CSD2006-00070: First Science with the GTC. The use of the spectral analysis software package MOLLY written by Tom Marsh is acknowledged.
References
- Casares (2009) Casares J., 2009, Proceedings of the VIII Scientific Meeting of the Spanish Astronomical Society (SEA), in press
- Casares et al. (2006) Casares J., Cornelisse R., Steeghs D., Charles P. A., Hynes R. I., O’Brien K., Strohmayer T. E., 2006, MNRAS, 373, 1235
- Casares et al. (2003) Casares J., Steeghs D., Hynes R. I., Charles P. A., O’Brien K., 2003, ApJ, 590, 1041
- Cornelisse et al. (2008) Cornelisse R., Casares J., Muñoz-Darias T., Steeghs D., Charles P., Hynes R., O’Brien K., 2008, ArXiv e-prints, 801
- Cornelisse et al. (2007) Cornelisse R., Casares J., Steeghs D., Barnes A. D., Charles P. A., Hynes R. I., O’Brien K., 2007, MNRAS, 375, 1463
- Cottam et al. (2002) Cottam J., Paerels F., Mendez M., 2002, Nature, 420, 51
- Cox (2000) Cox A., 2000, Allen’s astrophysical quantities, S&T, 100, 72
- D’Avanzo et al. (2006) D’Avanzo P., Muñoz-Darias T., Casares J., Martínez-Pais I. G., Campana S., 2006, A&A, 460, 257
- Faulkner et al. (1972) Faulkner J., Flannery B. P., Warner B., 1972, ApJ, 175, L79+
- Gottwald et al. (1986) Gottwald M., Haberl F., Parmar A. N., White N. E., 1986, ApJ, 308, 213
- Haswell et al. (2002) Haswell C. A., Hynes R. I., King A. R., Schenker K., 2002, MNRAS, 332, 928
- Hynes & Jones (2008) Hynes R., Jones E., 2008, The Astronomer’s Telegram, 1816, 1
- Hynes et al. (2006) Hynes R. I., Horne K., O’Brien K., Haswell C. A., Robinson E. L., King A. R., Charles P. A., Pearson K. J., 2006, ApJ, 648, 1156
- Hynes et al. (2003) Hynes R. I., Steeghs D., Casares J., Charles P. A., O’Brien K., 2003, ApJ, 583, L95
- Marsh & Horne (1988) Marsh T. R., Horne K., 1988, MNRAS, 235, 269
- Meyer & Meyer-Hofmeister (1982) Meyer F., Meyer-Hofmeister E., 1982, A&A, 106, 34
- Muñoz-Darias et al. (2005) Muñoz-Darias T., Casares J., Martínez-Pais I. G., 2005, ApJ, 635, 502
- Muñoz-Darias et al. (2008) Muñoz-Darias T., Casares J., Martínez-Pais I. G., 2008, MNRAS, 385, 2205
- Özel (2006) Özel F., 2006, Nature, 441, 1115
- Parmar et al. (1986) Parmar A. N., White N. E., Giommi P., Gottwald M., 1986, ApJ, 308, 199
- Parmar et al. (1985) Parmar A. N., White N. E., Giommi P., Haberl F., Pedersen H., Mayor M., 1985, IAU Circ., 4039, 1
- Pearson et al. (2006) Pearson K. J., Hynes R. I., Steeghs D., Jonker P. G., Haswell C. A., King A. R., O’Brien K., Nelemans G., Méndez M., 2006, ApJ, 648, 1169
- Podsiadlowski & Rappaport (2000) Podsiadlowski P., Rappaport S., 2000, ApJ, 529, 946
- Rodríguez-Gil et al. (2009) Rodríguez-Gil P., Torres M. A. P., Gansicke B. T., Muñoz-Darias T., Steeghs D., Schwarz R., Hagen H.-J., 2009, A&A submitted
- Schenker & King (2002) Schenker K., King A. R., 2002, Astronomical Society of the Pacific Conference Series, 261, 242
- Schneider & Young (1980) Schneider D. P., Young P., 1980, ApJ, 240, 871
- Shafter et al. (1986) Shafter A. W., Szkody P., Thorstensen J. R., 1986, ApJ, 308, 765
- Steeghs & Casares (2002) Steeghs D., Casares J., 2002, ApJ, 568, 273
- Villarreal & Strohmayer (2004) Villarreal A. R., Strohmayer T. E., 2004, ApJ, 614, L121
- Wolff et al. (2002) Wolff M. T., Hertz P., Wood K. S., Ray P. S., Bandyopadhyay R. M., 2002, ApJ, 575, 384