Force-induced misfolding in RNA
Abstract
RNA folding is a kinetic process governed by the competition of a large number of structures stabilized by the transient formation of base pairs that may induce complex folding pathways and the formation of misfolded structures. Despite of its importance in modern biophysics, the current understanding of RNA folding kinetics is limited by the complex interplay between the weak base-pair interactions that stabilize the native structure and the disordering effect of thermal forces. The possibility of mechanically pulling individual molecules offers a new perspective to understand the folding of nucleic acids. Here we investigate the folding and misfolding mechanism in RNA secondary structures pulled by mechanical forces. We introduce a model based on the identification of the minimal set of structures that reproduce the patterns of force-extension curves obtained in single molecule experiments. The model requires only two fitting parameters: the attempt frequency at the level of individual base pairs and a parameter associated to a free energy correction that accounts for the configurational entropy of an exponentially large number of neglected secondary structures. We apply the model to interpret results recently obtained in pulling experiments in the three-helix junction S15 RNA molecule (RNAS15). We show that RNAS15 undergoes force-induced misfolding where force favors the formation of a stable non-native hairpin. The model reproduces the pattern of unfolding and refolding force-extension curves, the distribution of breakage forces and the misfolding probability obtained in the experiments.
1 Introduction
Like proteins, RNAs have enzymatic, regulatory and structural functions that are crucial for the correct operation of cells [1, 2]. RNA molecules are found in single stranded form and are designed to fold into specific three-dimensional conformations, called native states. RNA folding is a kinetic process mainly governed by the interactions between complementary bases which can lead to the formation of both native and non-native domains. As a result, folding into states that are structurally different from the native state, usually referred as misfolding, can occur [3]. Misfolded RNAs are not functional and can be harmful to organisms [4], just as misfolded proteins (e.g. prions) that are involved in several diseases [5]. Folding of biomolecules, such as RNA molecules and proteins, is therefore a subject of great importance in modern biophysics. Under which conditions misfolding is prone to occur? What are the structural elements that prevent folding into the native structure? Is it possible to control misfolding by designing specific molecular sequences?. To answer such questions modeling of biomolecular folding is of great help. The competition between a very large number of structures, that may lead to misfolding, makes modeling of folding a difficult and challenging problem in biological physics where disorder and frustration play a crucial role [6, 7]. RNA mostly folds in a hierarchical fashion dominated by the formation of secondary structures [8, 9, 10, 15]. In contrast to proteins where native state prediction is very difficult, it is possible to infer the correct secondary structure of RNA molecules from computer calculations (Mfold). This makes RNA folding a more tractable theoretical problem than protein folding. Bi-stability and misfolding in nucleic acids have been recently investigated in temperature ramping [11] and force pulling [12] experiments.
In this work we address the problem of folding/misfolding in RNA molecules that are stretched by mechanical forces. Using single molecule techniques it is nowadays possible to pull on individual molecules such as biopolymers (e.g. nucleic acids, proteins, sugars…), molecular complexes (e.g. motor proteins and DNA/protein fibers) or even to stretch cells. Single molecule techniques provide valuable information about the thermodynamics and kinetics of biomolecular processes, thereby enlarging our knowledge of fundamental processes at the molecular and cellular level [13]. Among the most successful techniques in the field are optical tweezers, AFM and magnetic tweezers, all them capable of exerting forces in the piconewton (pN) range (1pN=N). Various studies have investigated the unfolding/refolding of individual RNA molecules using optical tweezers. RNA hairpins are typically unzipped at forces around 15pN where base pairs are disrupted by the direct action of force. Folding kinetics in force is of current interest as it provides an alternative route to investigate the problem of molecular folding, complementary to studies of folding by varying temperature or denaturant concentration. What is the main effect of force in RNA folding? Under the action of mechanical forces, the formation of secondary contacts in RNA between bases located at distant segments of the molecule is hampered by the stretching effect of the force. Starting from a stretched state and by progressively decreasing the force, folding is partially a sequential process in contrast to the non-sequential mechanism observed in thermal folding [16]. Here we introduce a phenomenological model, based on a sequential dynamics at the level of individual base pairs, that is useful to investigate folding and misfolding of RNA molecules that lack tertiary contacts. We apply it to interpret and reproduce experimental results recently obtained in the three-helix junction S15 RNA molecule, hereafter referred as RNAS15, pulled by optical tweezers [17] (see Fig. 1). These experiments consist of repeated force cycles that start from the fully stretched molecule at high forces. The force is first decreased down to low values to let the molecule refold. Next, it is increased up to the initial value in order to unfold the molecule again [18]. In this way the folding reaction can be monitored as a function of time. In such experimental conditions, we show that RNAS15 undergoes force-induced misfolding behavior as a consequence of the competition between the formation of two hairpins that cannot coexist in the same conformation. The computed misfolding probability, defined as the probability to end up in the misfolded state at the end of the relaxing process, is in good agreement with that obtained in the experiments. We are also able to reproduce the experimental unfolding and refolding force-extension trajectories, and obtain distributions of breakage forces (i.e. the force at which the native structure unfolds) that match the experimental ones at different loading rates.
2 Two unfolding patterns in RNAS15
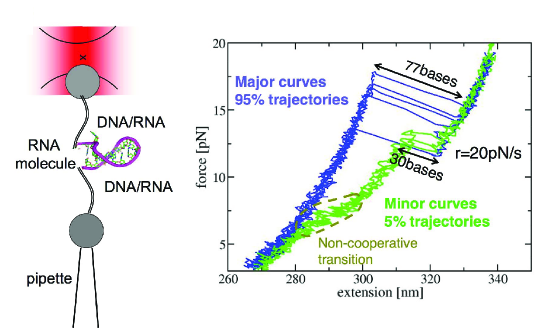
The present work is based on previous pulling experiments [17] where optical tweezers [19] were used to induce unfolding and refolding in RNAS15 at room temperature () in a solvent free of magnesium ions to avoid the formation of tertiary contacts. In these experiments a molecular construct is synthesized where the molecule RNAS15 is inserted between molecular DNA/RNA hybrid handles that provide enough space between the two beads to avoid non-specific interactions between the molecule and the beads, see Fig. 1. The force applied on the molecular construct (RNAS15 plus handles) is then ramped at constant speed [20] between 2 pN and 20 pN at two loading rates, and . At 2 pN (20 pN), the thermodynamically stable state is the folded (stretched) state. The output of the experiments is the force-extension curve that gives the force applied to the molecule as a function of the molecular extension. During the unfolding part of the cycle (2 pN 20 pN), two types of unfolding curves, referred to as major and minor, are observed (see Fig. 1). The major curves correspond to approximately 95% (90%) of the trajectories at (). The minor curves correspond to the rest ().
The major curves show a cooperative transition similar to that observed in the unzipping of small RNA hairpins [17, 18]. Up to forces pN, the force-extension curve corresponds to the stretching of the molecular handles used to manipulate the molecule [17, 18]. The sudden large gain in the extension at forces around pN is consistent with the whole opening of RNAS15 that is bases long. On the other hand, the minor curves do not show the typical stretching behavior of the handles at low forces ( pN). In particular, a non-cooperative transition occurs at force values between 6 and 9 pN. At these forces, the minor trajectories show large fluctuations in the extension (Fig. 1) suggesting the presence of fast conformational events where the molecule partially unfolds and refolds. Moreover, the cooperative transition observed in the minor curves at forces around pN corresponds to the opening of a bases domain that is much shorter than the total length of the RNA molecule.
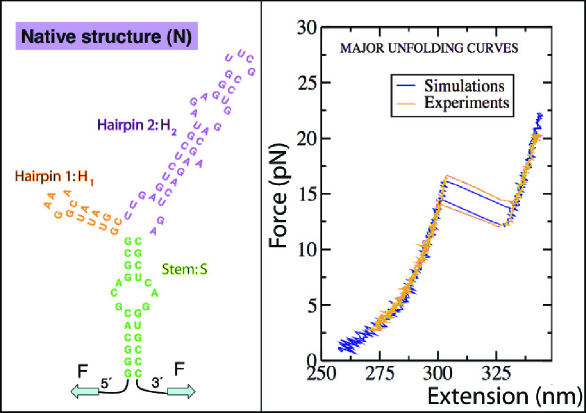
As shown in Fig. 2, the major unfolding curves are well reproduced by using an extension of the sequential kinetic model introduced by Cocco et. al [21, 22], applied to the native three-helix junction (denoted by ). The model in [21] describes the folding/unfolding force kinetics of single hairpins at the level of individual base pairs. It has one free parameter which is the attempt frequency, , for the opening and closing rates of a single base pair (see Methods). We extend this model to include multi-branched structures such as in RNAS15, which is composed of a stem that branches into two hairpins and (Fig. 2). We also include the effect of the instrumental setup used in the optical tweezers experiments [23].
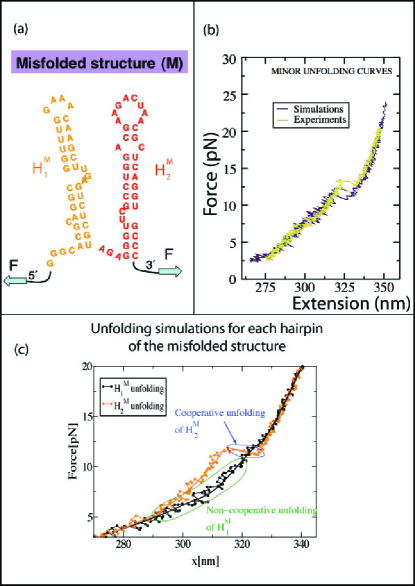
Our numerical results show that, during the unfolding transition, the whole structure unfolds immediately after the stem opens. Accordingly, an analysis of the distribution of breakage forces predicts a transition state for the unfolding reaction that is located close to the native state (see Methods). The corresponding kinetic barrier is actually generated by the presence of successive strong GC base pairs in the stem. On the other hand, this sequential dynamics applied to the structure composed of the native hairpins and does not reproduce the minor curves (data not shown). This suggests that the minor curves correspond to the unfolding of a misfolded structure, rather than to the unfolding of a structure that is partially folded into (with hairpins and , but not the stem, formed). By using the Vienna package for predicting RNA structures [25] we have searched for the most stable structure without the stem formed (in order to avoid the large cooperative rip characteristic of the major curves). This structure, denoted as , is composed of two hairpins, and , and has a free energy of 6.3 kcal/mol () above that of the native structure (see Methods and Fig. 3a) –note that and cannot coexist at the same time since the same nucleotides are involved in different base pairings. Upon stretching , numerical simulations show minor-like unfolding curves similar to the experimental ones (see Fig. 3b). In the simulations, the cooperative transition observed around pN corresponds to the unfolding of the bases hairpin as shown in Fig. 3c. This figure also shows that for loading rates similar to those of the experiments, unfolds in a non-cooperative way at force values between 6 and 9 pN (see Appendix A for a discussion on this issue). This corresponds to the non-cooperative transition observed in the experimental (unfolding) minor curves (see above and Fig. 1). In the following, we provide quantitative evidence showing that the minor curves indeed result from the formation of .
3 The minimal structures model
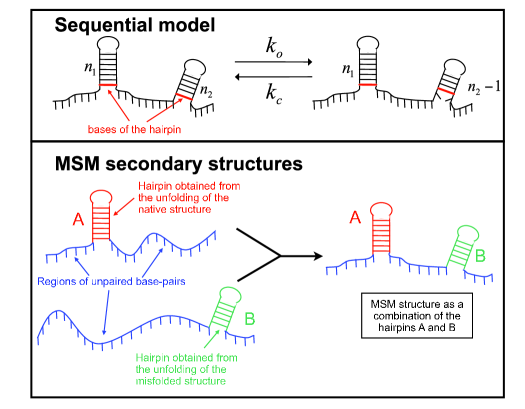
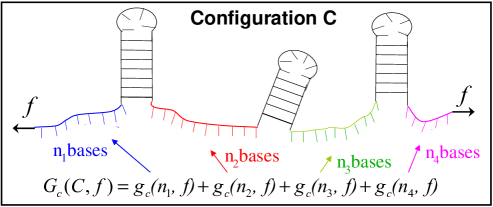
In order to investigate the folding/misfolding in RNAS15 we introduce a model that can be applied to any nucleic acid secondary structures. We call it the minimal structures model (MSM). The essential idea behind the model consists in associating to each type of experimental unfolding curve –two in the case of RNAS15, “major” and “minor”– a unique stable structure, whose unfolding force-extension pattern, obtained using the sequential dynamics, reproduces the experimental one. From this set of stable structures, that we call minimal structures, we generate the ensemble of configurations used to investigate both the unfolding and the refolding of the molecule. These configurations, hereafter referred to as MSM configurations, are built as follows. First, we consider all the intermediate configurations resulting from the sequential unfolding of each minimal structure. Each of these intermediate configurations is composed of hairpins that are separated by regions of unpaired bases. The ensemble of MSM configurations results from all the possible combinations of these hairpins (Fig. 4). The initial set of locally stable structures is said to be minimal since each of these structures is necessary to reproduce one of the pattern of unfolding force-extension curves obtained in the experiments. Moreover, this minimal set of structures makes simulations of kinetics affordable form a computational point of view (the number of configurations in the MSM grows in a polynomial way as , being the total number of base pairs of the minimal structre and the total number of minimal structures). Although the inclusion of more structures might appear desiderable, the implementation of the kinetics soon becomes exceedingly complicated and little is actually gained regarding comparison with the experiments. Finally, the dynamics that we implement at the level of single base pairs [21] satisfies detailed balance and is ergodic (i.e. each configuration in the MSM is connected through a path, made out of a finite number of successive openings and closings of base pairs, to any other configuration). Detailed balance and ergodicity are essential properties of the dynamics ensuring that, in the equilibrium state, all configurations are accessible and sampled according to the Boltzmann-Gibbs distribution. Detailed balance and ergodicity make the link between dynamics and thermodynamics where time averages can be replaced by ensemble averages.
During refolding there is always competition in the formation of hairpins that have bases in common (e.g and in RNAS15). Therefore, with more than one minimal structure, the MSM naturally leads to the formation of the different minimal structures and hence to misfolding. In RNAS15, comparison between experiments and numerical simulations for the unfolding curves (Fig. 2 and 3) suggests to choose and as the minimal structures. The total number of configurations within the MSM being on the order of a few hundreds. We have carried out numerical simulations of force cycles in the MSM in RNAS15 and observed the presence of minor and major unfolding curves in agreement with the experiments. Yet, the current model is not good enough to reproduce the experimental results as we are still not able to simultaneously reproduce the unfolding and refolding curves in a quantitative way (data not shown). In particular, by choosing a value of the attempt frequency that fits well the unfolding curves, we obtain refolding curves that do not match the experimental results (typical refolding forces are 2 pN higher in simulations than in experiments). Different causes could explain this discrepancy. First, we have neglected a large number of configurations that might compete with those of the MSM and whose presence would lead to lower refolding forces in agreement with the experimental results. In addition, the transient formation of tertiary interactions such as pseudo-knots, could be relevant during the folding process.
The number of secondary structures that can be formed in RNA grows exponentially with the total number of bases. Therefore, it is impossible, in large molecules, to simulate kinetics in the full ensemble of secondary structures. Although it is possible to determine the free energy of all possible secondary structures it appears extremely difficult to implement kinetic rules between all possible configurations. The simplest strategy, in order to include the effect of additional structures on the dynamics, is to consider all possible secondary contacts that can be formed within the unpaired regions in a given MSM configuration. Because the explicit inclusion of all possible secondary structures in the dynamics is too difficult, we take advantage of approximative schemes to address such problem. The current problem is reminiscent of that encountered in liquid or statistical field theories where an infinite class of correlation functions or observables have to be simultaneously solved. It is then common to solve the dynamics by closing the hierarchies of observables by selecting only a specific subset among all possible classes and resumming all diagrams among that subset. Here we adopt such strategy. In the spirit of resummation techniques in statistical physics, we integrate out all these additional structures and add corrections to the free energies of the MSM configurations as explained below.
3.1 Estimate of the free-energy correction in the MSM.
Let us consider a generic configuration of the MSM with free energy at a given force . is by definition composed of hairpins and regions of unpaired bases (Fig. 5). Starting from this configuration, we can generate additional ones by allowing the formation of secondary contacts between complementary bases within each unpaired region. The inclusion of these additional configurations in the MSM would result in a larger ensemble of configurations. This would also modify the thermodynamics of the system. Hence, in order to keep an ensemble of configurations as small as possible, the effect of such additional configurations is taken into account by adding a free energy correction, to each configuration . Subsequently, the free energy of any configuration in the MSM can be split into three contributions:
| (1) |
is the free energy of formation of the configuration at zero force. stands for the contribution to the mechanical free energy due to the stretching of the unpaired regions that are exposed to the force. This is equal to where is the equilibrium average extension of the configuration at force . Finally, the free energy correction at force , , is added so that includes and all the possible secondary structures that can be formed from using the bases of the unpaired regions. Note that some of these structures may correspond to configurations originally belonging to the MSM and, therefore, should not be included in the calculation of . In fact, the inclusion of such structures would lead to an incorrect and strongly biased estimation of the free energy correction inherent to the large thermodynamic stability of all configurations that belong to the MSM. The proper estimation of is therefore a very difficult task and a different strategy is required to circumvent this problem as we shall explain in the following.
In the present treatment, for the sake of simplicity, we do not consider interactions between bases of different unpaired regions. As a consequence, can be decomposed as a sum of independent contributions coming from each unpaired region . Having proceeded so far, we try to get an estimation of the correction that can be efficiently implemented in the numerical simulations of the kinetics. We use an annealed approximation where the contribution from each region only depends on the number of bases of that region, . As a result, we get where is the total number of unpaired regions (see Fig. 5).
As the free energy of an RNA sequence depends much on its sequence, should be estimated for each primary sequence. In this regard, our estimation procedure consists, first, in evaluating the average free energy of an -base long polynucleotide chain that is chosen within that sequence (see Methods). The average is taken over all possible segments of length along that sequence. To this value we subtract the initial stretching free energy of the -bases long polynucleotide and obtain . is always a lower bound to as it includes the contribution coming from the additional new configurations but also the contribution from configurations already generated by the minimal structures. In fact, by averaging over all segments covering the whole sequence, the term gets contributions from all possible hairpins that can be formed with bases. Therefore is biased toward low values due to the stabilizing contribution to the free energy by the minimal structures (e.g. the native or the misfolded structures in the case of RNAS15). This bias is particularly strong at low forces where the native hairpins dominate the annealed average. How does depend on and ? The fact that the free energy is an extensive variable (i.e. depends linearly on the size of the system , at least for where loop formation is possible) implies that the first derivative (i.e. respect to the intensive variable ) also depends linearly on . These properties are well confirmed by using the Vienna package [25], which gives the exact partition function and the equilibrium free energy for any RNA sequence. In the case of RNAS15 we find where the parameter depends linearly on up to a certain force value pN for which it vanishes: if and if , with (see figure 5). We stress that, for arbitrarily long sequences, determining and is still possible by restricting the calculation of the free energy to small values of (e.g. up to ) where is a linear function of (Fig. 5).
How to proceed now in order to estimate the true correction ? The functional form obtained for suggests the same functional dependence for , albeit with a priori different parameters, and . in is the force value where the free energy correction vanishes and below which secondary structures become, in average, more stable than the fully unfolded or unpaired form. At forces around pN many other configurations can be as stable as the MSM configurations. Therefore, the value of is not expected to be very sensitive to the bias introduced in the annealed average by the inclusion of the MSM configurations. Thus, we keep pN for also. Consequently, the free energy correction term leads to only one additional free parameter in the model, that we call . The free energy correction finally reads with if and zero otherwise. The parameter corresponds to the free energy correction per base pair at zero force and satisfies because is a lower bound to . What is the main effect of on the kinetics of unfolding and folding?. Additional configurations naturally tend to slow down the formation of individual hairpins that belong to the minimal structures. Accordingly, the free energy correction modifies the closing rates rather than the opening rates of individual base pairs (see Methods). Therefore the value of the parameter mostly determines the kinetics of folding rather than unfolding and a larger value of tends to slow down the kinetics of folding.
3.2 Applying the model to RNAS15.
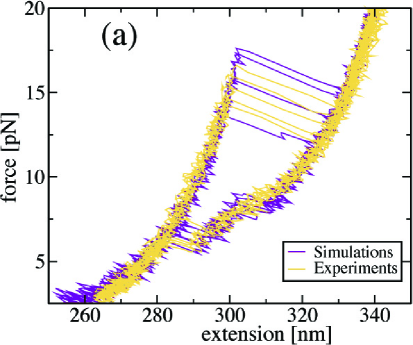
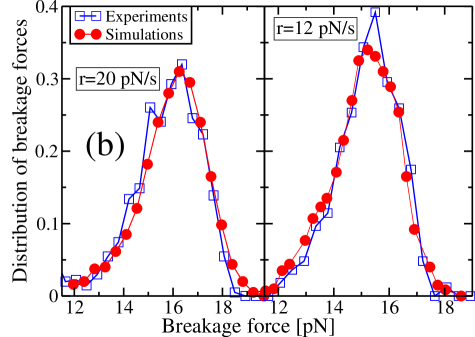
Overall the model requires only two free parameters, and , in order to fit all the experimental data available in RNAS15. The parameters and lead, at both loading rates, to unfolding and refolding force-extension curves, distributions of breakage force and misfolding probabilities that are in quantitative agreement with those found in the experiments (Fig. 6 and 7). Since no further explicit structures are necessary to reproduce the experimental data, we conclude that, in this case, a model containing the minimal structures and plus the free energy correction term, is enough to explain both the unfolding and refolding kinetics of RNAS15. In this regard, we have extended our analysis by including other minimal structures different from and and have obtained very similar results (data not shown).
Regarding the force-extension curves we note that the shoulder observed during the refolding trajectory (Fig. 6a) is mainly due to the transient formation of hairpins (, , and ). On the other hand, the minor curves correspond to the unfolding of the misfolded structure where the hairpin does not allow the formation of the native hairpin : acts as a kinetic trap that impedes the formation of . Misfolding in RNAS15 is not induced by thermal fluctuations since the free energy difference between and is very large, . Rather it is induced by the force that tends to favor the misfolding pathway.
Finally, we note that the free energy correction per base pair, , is an order of magnitude smaller than the typical free energy of formation of individual base pairs (). Yet, it is necessary to include this correction (about 10%) to quantitatively reproduce the experimental features of the unfolding/refolding kinetics in RNAS15.
4 Misfolding probability
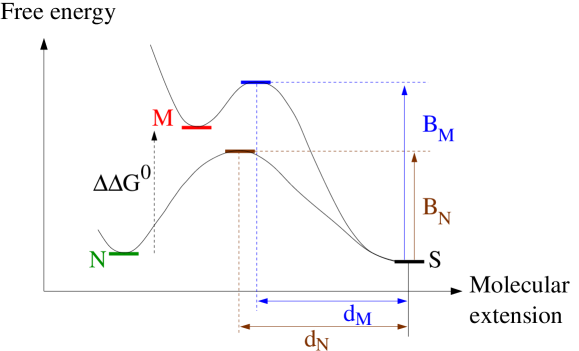
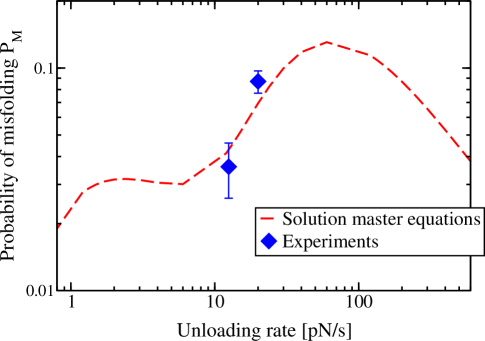
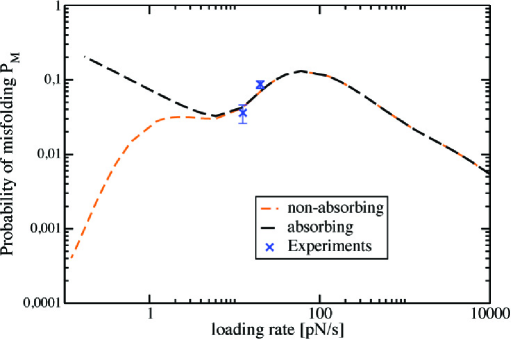
In a force cycle protocol, misfolding can be quantified by the misfolding probability . This is given by the probability to end up in the misfolded state at the end of the relaxing process. Multi-state models of chemical reactions provide a general picture about the unloading rate dependence of this probability. The simplest model consists of a three-state system (native , misfolded and stretched ) where the misfolded state acts as a kinetic trap during the folding transition (Fig. 7a). Starting from at high forces, and by decreasing the force at a constant rate , the general question we ask is how depends on . In the general situation of a force-independent position of the kinetic barriers (located at distances from ), we find that has a unique maximum located at (see Appendix B). However, if and depend on the force, shows a more complex behaviour where several maxima can appear (see Appendix B). This general scenario is expected to be applicable in RNAS15 where the results obtained from simulations of the MSM show a with two maxima (Fig. 7b). From a general point of view, a with more than one maximum suggests a complex free energy landscape with force dependent transition states (leading to force dependent fragilities as in the case of RNA hairpins [26]).
5 Discussion and conclusions
In this work we have investigated the folding/unfolding behaviour of nucleic acid secondary structures that are pulled by mechanical forces. To this aim we have introduced a phenomenological model (MSM) that is based on: the sequential dynamics of a minimal number of structures; and the inclusion of corrections in the free energy that account for the configurational entropy contributed by the exponentially large number of neglected secondary structures. The model describes force-induced misfolding of nucleic acid secondary structures such as RNA and DNA. It can be applied to arbitrary nucleic acid sequences that can form different secondary structure and can be used to predict the phenomenology observed in dynamic force spectroscopy measurements (breakage force distributions, force-extension curves and misfolding probability). The applicability of the approach has been shown in the case of the RNA three-helix junction S15.
The model can be also used in the prediction of different folding kinetics scenarios by implementing different sets of minimal structures. Sometimes the full applicability of the model may require the previous experimental identification of the minimal set of structures that generate the different patterns of force-extension curves. Although the model cannot predict misfolding for a given sequence it can be applied to identify possible misfolded states as well as kinetic intermediates by doing systematic in silico experiments. A useful strategy could be using the Vienna package [25] to build up the minimal set of structures and consequently determine potential misfolded states by generating different sets of secondary structures for the given RNA sequence. Subsequently one should search for the most stable structures that can be formed when native domains are not allowed. However, we are not able yet to provide a receipt that leads to the systematic determination of these states. As a consequence, the method we used for the determination of the misfolded structure must be specifically adapted to every RNA sequence.
For a given nucleic acid sequence the model only has two fitting parameters, and . The first one, , is an attempt frequency at the level of individual base pairs which should not vary much with the specific sequence under study. In this regard, the value we report for in RNAS15 is in agreement with the values obtained for other RNA molecules [21, 23] as expected. The second parameter, , is a thermodynamic parameter related to the configurational space of the molecule, i.e. the space of secondary structures associated with a given nucleic acid sequence. In principle, for a given RNA, the larger the ensemble of MSM configurations, the smaller the correction, and hence the value of . However, the total number of configurations included in the free energy correction grows exponentially with the total number of base pairs of the molecule, whereas the number of configurations in the MSM grows as a power of that total number. Consequently, the inclusion of more minimal structures in the model should not change much the value of . In addition, is the free energy correction per base pair and, therefore, it should not be much sensitive to the specific molecular sequence. Therefore it is reasonable to expect that the reported value of is largely constant among all RNA sequences under identical environmental conditions (e.g. temperature and salt). What happens in the case of short canonical (i.e. fully complementary or Watson-Crick base-paired) hairpins? These molecules show two-state behavior and cooperative folding [21, 23], yet the entropic correction might still be necessary to fully describe the kinetics of folding. In this case, there will be just one minimal structure (the native one) so the effect of the entropic correction, albeit small, could be experimentally observable. It would be very interesting to carry out future experiments capable of identifying, in generic two-state molecules, this correction of entropic origin. Finally, let us mention that a different theoretical approach is required to model the thermal denaturation of RNAs and the associated folding and misfolding mechanisms. In this case, the dissociation of base pairs is not a sequential process anymore.
Recent pulling experiments in TAR RNA [12] have shown how stretching forces can help the formation of the native structure when the molecule is initially trapped in misfolded structures. Here, we have found that a mechanical force can also induce the opposite effect, by favouring misfolding pathways that are unlikely in the absence of force. It remains a challenge to apply this model to predict the detection of misfolded structures and kinetic intermediates in single molecule pulling experiments for specifically designed nucleic acid sequences.
6 Methods
Optical tweezers experimental setup.
Experiments in RNAS15 were reported in a previous paper by Collin et. al [17]. Buffer conditions were 100 mM Tris-HCl, pH 8.1, 1 mM EDTA, free of magnesium ions, at room temperature . RNAS15 is attached, via RNA/DNA handles ( nm), to two micron-sized polystyrene beads. One bead is held fixed at the tip of a micropipette. The force is measured through the detection of the light deflected by the bead in the optical trap (Fig. 1).
Transition state along the unfolding pathway.
From the breakage force data, one can obtain information about the transition state corresponding to the force-induced unfolding pathway using a two-state model. According to this model, the variance of the breakage force distribution is inversely proportional to the distance from the transition state to the folded native state, that is . In RNAS15, this relation leads to a transition state for the unfolding reaction that corresponds to a configuration where only the first two or three base pairs of the stem are opened.
Extended sequential dynamics.
In the sequential model of Cocco et. al [21], successive closing and opening of base pairs is restricted to take place at the base of the hairpin, defined as the first 5’-3’ base pair formed (Fig. 4). The corresponding opening rates () depend on the free energy of formation of the base pairs, : where is an attempt frequency. The closing rates () depend on the mechanical energy loss, , due to the shortening of the unpaired part of the molecule: . These free energies have been estimated by thermal denaturation experiments [27] and single molecule force experiments respectively [28, 29]. The attempt frequency is therefore the only free parameter of the model. Typical values measured by NMR fall in the range Hz [24]. The extension of the model to multiple hairpins is depicted in Fig. 4.
In our simulations, we allow for the formation of both Watson-Crick and non-canonical (GA and GU) base pairs. The values for the free energies of formation of the different base pairs have been obtained from the Vienna package (corresponding to 1 M NaCl [25]) by adding a uniform correction in order to meet the salt condition of the buffer used in the experiments (100 mM Tris-HCl). The salt correction is determined by imposing the value for free energy of formation in RNAS15 to be equal to that recovered in the experiments [17]. The algorithm involves the whole experimental setup (handles and beads) within the so-called mixed ensemble where the control parameter is the distance between the optical trap and the immobilized bead [23] (rather than the force). Therefore, we include in the contribution of both the handles and unpaired RNA. The latter and the regions of unpaired RNA bases are described by using a worm-like chain model [30, 31] with persistence lengths of nm (handles) and nm (RNA) and contour lengths of nm/bp (handles) and nm/base (RNA). These values fit reasonably well the experimental force-extension curves in the region where the handles are strecthed. Each hairpin contributes to the total extension with an additional extension of nm. Finally, when taking into account our phenomenological corrections, becomes where is the difference in the free energy corrections between the open and closed configurations.
Free energy of an -bases long segment of RNAS15.
Any secondary structure that is built up from an -bases long polynucleotide can be seen as a succession of unpaired regions and partial secondary structures closed by a base-pair (for instance, in Fig. 5 the partial secondary structures are the hairpins). The free energy of such secondary structure can then be divided into the mechanical free energy corresponding to the stretching of both the unpaired regions and the base-pairs that close the partial secondary structures, plus the free energy formation of each partial secondary structure. In RNAS15, we estimate the latter using the Vienna package. Computing the free energy of all the secondary structures that can be formed with the -bases long polynucleotide allows us to determine the partition function, and hence the free energy, of the -bases long polynucleotide at force .
Misfolding probability in RNAS15.
We describe the dynamics of the MSM using a set of master equations (see see Appendix C). These equations describe the time evolution of the probability of the RNA to be in a specific MSM configuration. To get the misfolding probability we numerically integrate the set of equations. The force is decreased at a given unloading rate , starting from the stretched state at an initial force pN. The misfolding probability is computed at the end of the relaxing process when the force vanishes, i.e. when .
Acknowledgement.
We thank D. Collin and I. Tinoco Jr. for discussions during the initial stages of this work and M. Palassini and P. T. X. Li for useful comments on the manuscript. I. J acknowledges financial support form the European network STIPCO, Grant No. HPRNCT200200319. F. R acknowledges financial support from the Spanish Research Council (Grants FIS2004-3454, NAN2004-09348) and the Catalan Government (SGR05-00688).
Corresponding author.
Requests for material should be addressed to F. R (ritort@ffn.ub.es)
Appendix A Appendix: Cooperative unfolding of hairpins and
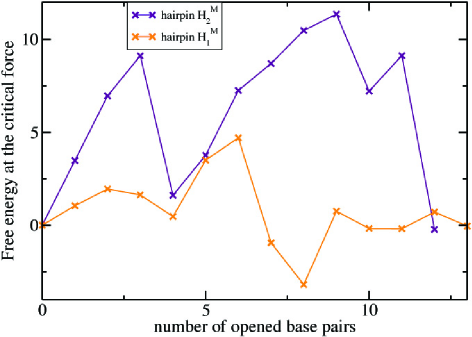
The misfolded structure is composed of two hairpins and . Both hairpins have similar thermodynamic stabilities and they present several mismatches (internal loops and bulges). Why unfolds cooperatively whereas does not (see Fig. 3c)? By using the Vienna package [25] for the free energies of formation of different base pairs we can compute the free energy of and as a function of the number of denaturated base pairs at the critical force where the folded and the unfolded hairpin are equally stable (i.e where both states have the same free eenergy). As shown in Fig. 8 the free energy landscape associated to (blue) presents a high kinetic barrier between the folded and the unfolded hairpin, whereas the free energy landscape associated to (red) is roughly flat. This explains the difference in the cooperativity observed between the two hairpins.
Appendix B Appendix: Misfolding in a three-state model
In this section, we analyse in detail the dynamics of a three-state model where a misfolded state () acts as a kinetic trap during the folding transition from the stretched state () to the native state (). Let us consider the case of a pulling protocol where the mechanical force applied to the system decreases at a constant loading rate . Starting from a high force value where the stretched state is the most stable one, we prove that the misfolding probability at the end of the force releasing process shows a single maximum along the -axis.
We denote by , and the probability to be at time in the state , and respectively. The relaxation process is governed by the following set of master equations:
| (2) |
where is the transition rate to go from state to state at a given force . Note that this model does not allow for direct transition pathways connecting and . Transitions between these states always pass through the stretched state . can then be viewed as an obligatory intermediate state of the reaction (see Fig. 9).
Absorbing states
In a first stage, we study the analytically tractable case where and are absorbing states, i.e. and . The set (2) of master equations becomes:
| (3) |
In the presence of a mechanical force that is coupled to the molecular extension, the rates can be written as and respectively, where () is the distance along the reaction cooordinate between and the kinetic barrier separating the state from the state () (see Fig. 7), and are the rates at zero force respectively and is the inverse of the thermal energy unit. Using these relations for the rates and considering a ramping protocol where the force decreases at a constant rate (), the set of equations (3) can be written in terms of the force as follows:
| (4) |
Starting from an initial stretched state at very large force (, , ), the solution to (4) is given by:
| (5) |
Let us focus now on the misfolding probability . Starting from Eq. (5) and after some simple manipulations, can be written as:
| (6) |
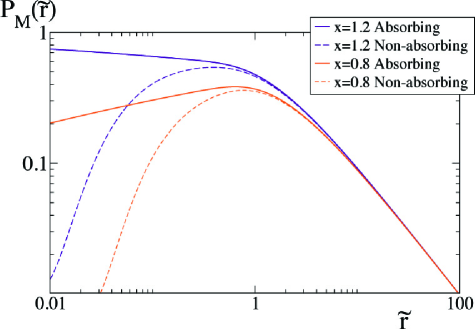
where , and are adimensional parameters. Interestingly, depending on the ratio , two behaviors can be distinguished for the dependence of as a function of the adimensional rate , i.e. of the rate . In the following, we show that for , has a single maximum along the -axis, whereas for , is a decreasing function of .
The first derivative of with respect to reads:
| (7) |
This clearly shows that when , is negative for all the (positive) values of , i.e. is a decreasing function of . When , the analysis is a bit more complicated. Let us show that has at least one solution for . First, when , from Eq. (7) it is clear that is negative. Second, the following inequality holds:
| (8) |
so that , and hence , is positive when (see Eq. (7)). Since is a continuous function that is positive when and negative when , we conclude that has at least one solution for . We could rigorously prove that this solution is unique. However, for the sake of lightness, we present here a proof based on physical arguments. First of all, at large , decreases when increases simply because the system does not have enough time to escape from when the loading rate becomes too large. On the other hand, a decreasing when 0 reflects the fact that at very large forces, the probability to fold into is much higher than the probability to fold into , the probabilities being very low though. In this case, the more time spent at high force values, i.e. the lower , the less probable to fold into .
Because when both and , shows at least one maximum at intermediate values of . Moreover, in the present case where the location of the kinetic barriers does not depend on the applied force, we find that there is a single maximum for when .
Non-absorbing states: the quasi-static regime
In the more realistic case where the states are not absorbing, the dependence of with respect to has a different nature at low . In this case fluctuations between and (passing through ) tend to populate at low forces. Indeed, by definition, the native state is supposed to be much more stable than the other states of the system at zero force, namely and . Consequently, at low the system has enough time to populate the native state. Or in other words, tends to its equilibrium value when . In any case (for both and ), we hence expect that when where is the free energy difference between and .
To conclude, we can say that in a three-state system with force-independent location of the kinetic barriers, the misfolding probability shows always a bell-shape as shown in Fig. 10. However, the presence of the maximum may have a different cause depending on the value of the ratio , i.e. depending on the relative distances of the native and misfolded kinetic barriers to the stretched state.
Force-dependent location of the kinetic barriers
Numerical simulations in RNAS15 show a complex dependence of the misfolding probability at the end of a force cycle with respect to the loading rate (see Appendix C and Fig. 7). This suggests that RNAS15 cannot be modeled as a three-state model with force-independent position of the kinetic barriers along the reaction coordinate. Interestingly, in the three-state model described above, still one can numerically study the effect of force-dependent positions of the kinetic barriers on the shape of . Physically, a dependence of and on the force corresponds to structural changes in the corresponding transition states [26]. In the case of absorbing states and , and for a force protocol where the force is released at constant rate , the probabilities to be in the different states , and at a given force read:
| (9) |
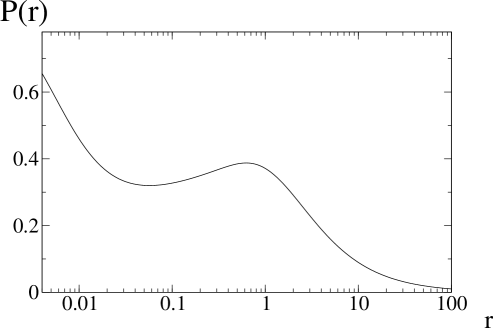
By playing with the force dependence of and we can obtain different shapes for the misfolding probability that show several extrema along the -axis. For instance, we can choose at low forces and at high forces. We then obtain a misfolding probability curve as the one shown in Fig. 11. The maximum at corresponds to a typical maximum of the force independent case , whereas the minimum at lower is due to a crossover from to . Interestingly, by solving the master equations (10) (see below) and by imposing the misfolded structure of RNAS15 to be an absorbing state, we obtain the same kind of dependence for the misfolding probability. This suggests that in RNAS15, at low forces. This also suggests that in the non-absorbing case, the low -regime observed in the numerical simulations of RNAS15 is the consequence of a quasi-static regime that tends to populate the native state.
Appendix C Appendix: Misfolding probability in RNAS15
In RNAS15, we can estimate the misfolding probability by using the minimal structures model (MSM, see main text). Within this scheme, each configuration in the MSM can be labeled by where , being the total number of MSM configurations. If is the probability to be in the configuration at time , the dynamics within the MSM is governed by the following set of master equations:
| (10) |
where counts for all the MSM configurations that are connected to via the sequential dynamics described in the Methods (see main text). and are the corresponding force-dependent closing/opening rates (see the Methods section).
We numerically integrate this system by imposing a decreasing force at constant rate with the following initial condition: the molecule is in the stretched state ( if and otherwise) and the force pN. The curves we obtain are in good agreement with the experimental results (see Figs. 12).
Numerically, we have checked that our results remain unchanged using a coarse-grained description at the level of a few base-pairs in order to get results faster (simulations tend to be very slow when the number of configurations starts to grow). In this case, we use the following two-state approximation. Let us suppose for instance that we coarse-grain the system of equations (10) at the level of base-pairs (typically ). If are the effective opening and closing rates, then where is the smallest eigenvalue of the evolution matrix. The detailed balance condition imposes the value of the ratio , hence it determines the values of and .
References
- [1] Doudna, J.A., and T. R. Cech. 2002. The chemical repertoire of natural ribozymes, Nature 418:222-228.
- [2] Moore, P.B., T. Steitz. 2002. The involvement of RNA in ribosome function, Nature 418:229-235.
- [3] Herschlag, D. 1995. RNA chaperones and the RNA folding problem, J. Biol. Chem. 270:20871-20874.
- [4] Chen, X., and S. L. Wolin. 2004. The Ro 60 kDa autoantigen: insights into cellular function and role in autoimmunity, J. Mol. Med. 82:232-239.
- [5] Dobson, C. M. 2002. Protein-misfolding diseases: Getting out of shape, Nature 418:729-730.
- [6] Bundschuh, R., and T. Hwa. 1999. RNA Secondary Structure Formation: A Solvable Model of Heteropolymer Folding, Phys. Rev. Lett. 83:1479-1482.
- [7] Onuchic, J., Z. Luthey-Schulten, and P. G. Wolynes. 1997. Theory of protein folding: The Energy Landscape Perspective, Ann. Rev. Phys. Chem. 48:545-600.
- [8] Brion, P., and E. Westhof. 1997. Hierarchy and dynamics of rna folding, Annu. Rev. Biophys. Biomol. Struct. 26:113-137.
- [9] Tinoco, I. Jr., and C. Bustamante. 1999. How RNA folds, J. Mol. Biol. 293:271-281.
- [10] Zarrinkar, P. P., and J. R. Williamson. 1996. The kinetic folding pathway of the Tetrahymena ribozyme reveals possible similarities between RNA and protein folding, Nature Struct. Biol. 3:432-438.
- [11] Viasnoff, V., A. Meller, and H. Isambert. 2006. DNA nanomechanical switches under folding kinetics control, Nano. Lett. 6:101-104.
- [12] Li, P. T. X., C. Bustamante, and I. Jr. Tinoco. 2007. Real-time control of the energy landscape by force directs the folding of RNA molecules, Proc. Nat. Acad. Sci. USA 104:7039-7044.
- [13] Ritort, F. 2006. Single molecule experiments in biological physics: methods and applications. Journal of Physics (Condensed Matter) 18:R531-R583.
- [14] Hyeon, C., and D. Thirumalai. 2005. Mechanical unfolding of RNA hairpins. Proc. Nat. Acad. Sci. USA 102:6789-6794.
- [15] M. Wu, and I. Jr. Tinoco. 1998. RNA folding causes secondary structure rearrangement, Proc. Nat. Acad. Sci. USA 95:11555-11560.
- [16] Onoa, B., D. Dumont, J. Liphardt, S. B. Smith, I. Jr. Tinoco, and C. Bustamante. 2003. Identifying Kinetic Barriers to Mechanical Unfolding of the T. thermophila Ribozyme, Science 299:1892-1895.
- [17] Collin, D., F. Ritort, C. Jarzynski, S. B. Smith, I. Jr. Tinoco, and C. Bustamante. 2005. Verification of the Crooks fluctuation theorem and recovery of RNA folding free energies, Nature 437:231-234.
- [18] Liphardt, J., B. Onoa, S. B. Smith, I. Jr. Tinoco, and C. Bustamante. 2001. Reversible Unfolding of Single RNA Molecules by Mechanical Force, Science 292:733-737.
- [19] Smith, S. B., Y. Cui, and C. Bustamante. 2003. Optical-Trap Force Transducer that Operates by Direct Measurement of Light Momentum, Methods in Enzymology 361:134-162.
- [20] Experimentally, the control parameter is the distance between the center of the trap and the tip of the micropipette (see Methods) and the system is pulled at a constant pulling speed. However, at forces larger than 5 pN the loading rate is approximately constant and equal to the trap stiffness times the pulling speed, see Evans, E., and K. Ritchie. 1997. Dynamic strength of molecular adhesion bonds, Biophys. J. 72:1541-1555.
- [21] Cocco, S., R. Monasson, and J. Marko. 2003. Slow nucleic acid unzipping from sequence-defined barriers, Eur. Phys. J. E 10:153-161.
- [22] Cocco, S., R. Monasson, and J. Marko. 2001. Force and kinetic barriers to unzipping of the DNA double helix, Proc. Natl. Acad. Sci. USA 98:8608-8613.
- [23] Manosas, M., J.-D. Wen, P. T. X. Li, S. B. Smith, C. Bustamante, I. Jr. Tinoco, and F. Ritort. 2007. Force Unfolding Kinetics of RNA using Optical Tweezers. II. Modeling Experiments. Biophys. J. 92:3010-3021.
- [24] Gueron, M., and J. L. Leron. 1992. Base pair opening in double-stranded nucleic acids. Nucleic Acids and Molec. Biol. 6:1-22.
- [25] Hofacker, I. L. 2003. Vienna RNA secondary structure server, Nucleic Acids Research., 31:3429-3431.
- [26] Manosas, M., D. Collin, and F. Ritort. 2006. Force-dependent fragility in RNA hairpins, Phys. Rev. Lett. 96:218301-04.
- [27] Tinoco, I. Jr. 1993. In The RNA World, R. F. Gesteland and J. F. Atkins editors, Cold Spring Harbor Laboratory Press, 603-607.
- [28] Baumann, C., S. B. Smith, V. Bloomfield, and C. Bustamante. 1997. Ionic effects on the elasticity of single DNA molecules, Proc. Nat. Acad. Sci. USA 94:6185-6190.
- [29] Maier, B., D. Bensimon, and V. Croquette. 2000. Replication by a single DNA polymerase of a stretched single-stranded DNA, Proc. Nat. Acad. Sci. USA 97:12002-12007.
- [30] Flory, P.J. 1969. In Statistical mechanics of chain molecules, appendix G, Oxford University Press, NY.
- [31] Smith, S. B., Y. Cui, and C. Bustamante. 1996. Overstretching B-DNA: the elastic response of individual double-stranded and single-stranded DNA molecules, Science 271:795-799.
- [32] Dudko, O. K., G. Hummer, and A. Szabo. 2006. Instrinsic rates and activation energies from single-molecule pulling experiments, Phys. Rev. Lett. 96:108101.
List of figures
Figure 1: Major and minor force-extension curves.
(Color online) Leftmost panel: Optical tweezers experimental setup for single RNA manipulation (figure not to scale). Rightmost panel: Experimental major and minor unfolding curves obtained from RNAS15 pulling experiments with optical tweezers[17]. The reported extension corresponds to the end-to-end distance of the RNA molecule plus the DNA/RNA hybrid handles.
Figure 2: Unfolding of the native structure.
(Color online) Leftmost panel: The RNAS15 three-helix junction native structure composed of a stem (green) that branches into two hairpin loops (orange) and (purple). Free energy of formation of the native state [25]: kcal/mol at room temperature (K). Rightmost panel: Experimental major unfolding curves compared with numerical results obtained from the sequential unfolding of the native structure (see text for details about the simulation procedure).
Figure 3: Unfolding of the misfolded structure.
(Color online) (a): The most stable structure without stem (called, in this paper, the misfolded structure) is composed of two hairpins: (orange) and (red). Its free energy of formation is equal to kcal/mol . (b): Experimental minor unfolding curves compared with numerical results obtained from the sequential unfolding of the misfolded structure on the left. (c): Curves obtained from sequential simulations (see text) of the unfolding of the individual hairpins and that compose the misfolded structure. Continuous lines represent a low bandwith average of the force-extension data.
Figure 4: The minimal structures model (MSM).
(Color online) Upper panel: Schematic representation of the sequential model for multi-hairpin structures. The only allowed transitions are the opening and closing of the base pairs located at the base of the hairpins (shown as thick bonds) where the force is applied. Lower panel: How to build the ensemble of configurations of the MSM. The intermediate configurations resulting from the sequential unfolding of either or are composed of hairpins and regions of unpaired bases (shown in blue). Then, the final MSM ensemble results from the combination of all the different hairpins and unpaired regions. In the example shown here, two hairpins ( and ) are combined together to form a configuration where the two original hairpins are separated by a region of unpaired bases.
Figure 5: Free energy corrections.
(Color online) Upper panel (a): schematic representation of a generic configuration of the MSM. It is composed of hairpins and regions of unpaired bases. The free energy correction of a given configuration at force , , is given by the sum of the independent free energy contributions coming from all different unpaired regions. Lower panel: function , defined as the free energy of an -bases polynucleotide chain minus the mechanical free energy of the fully extended chain averaged over all possible segments of that length along the RNAS15 sequence. We find that is approximately linear with , . The coefficient as a function of the force is plotted in the inset of the figure.
Figure 6: Dynamic force spectroscopy results.
(Color online) Experimental results compared to numerical simulations in the MSM. The MSM parameters are: and . (a): Unfolding and refolding major curves at loading rate . (b): Distribution of breakage forces, i.e. the force at which the molecule unfolds, obtained from the major unfolding curves at (distributions have been obtained from 900 (2000) trajectories in the experiments (simulations)) and (distributions have been obtained from 400 (2000) trajectories in the experiments (simulations)).
Figure 7: Misfolding probability and three-state model.
(Color online) Upper panel: Representation of the three-state model including the stretched, native and misfolded states. The misfolded state acts as a kinetic trap for the folding transition between the stretched state and the native state. Lower panel: Misfolding probability (computed at the end of the relaxing process) as a function of the unloading rate. The experimental points correspond to and .
Figure 8: (Appendix A)
(Color online) Free energy as a function of the number of opened base pairs for the two hairpins forming the structure, (red) and (blue), at the critical force where both the folded and the unfolded hairpins are equally stable (critical force values are around 10 and 11 pN for and respectively). Results shown are obtained by using the Vienna package [25].
Figure 9: (Appendix B)
Three-state model with three states . is an intermediate state on-pathway from the misfolded to the native state. The four possible rates for are also shown.
Figure 10: (Appendix B)
(Color online) Misfolding probability as a function of the adimensional rate for the three-state model with force-independent positions of the kinetic barriers and native/misfolded absorbing states. The full curves have been obtained by numerically integrating Eq. (6) with so that . The dashed curves show the corresponding case where the native/misfolded states are non absorbing. In this case, we denote by , respectively , the distance from states , respectively, to the position along the reaction coordinate of the kinetic barrier separating these states from . The curves have been obtained using and with . and correspond to the free energy of formation of the native and misfolded states, respectively, at zero force.
Figure 11: (Appendix B)
Misfolding probability as a function of the rate in the case of a force-dependent position of the barrier between the native and the stretched state in the three-state model with absorbing native/misfolded states. The curve has been obtained by taking for pN and for pN. We have also used .
Figure 12: (Appendix C)
(Color online) Misfolding probability obtained from the set of master equations (10) describing the folding kinetics in the MSM. The dashed black lines correspond to the case where the misfolded state is absorbing.