The Physical Properties of Four 600 K T Dwarfs
Abstract
We present 7.6 – 14.5 spectra of ULAS J003402.77005206.7 and ULAS J133553.45113005.2, two T9 dwarfs with the latest spectral types currently known. We fit synthetic spectra and photometry to the near- through mid-infrared energy distributions of these dwarfs and that of the T8 dwarf 2MASS J093935482448279. We also analyse near-infrared data for another T9, CFBD J005910.82011401.3. We find that the ratio of the mid- to near-infrared fluxes is very sensitive to effective temperature at these low temperatures, and that the 2.2 m and 4.5 m fluxes are sensitive to metallicity and gravity; increasing gravity has a similar effect to decreasing metallicity, and vice versa, and there is a degeneracy between these parameters. The 4.5 m and 10 m fluxes are also sensitive to vertical transport of gas through the atmosphere, which we find to be significant for these dwarfs. The full near- through mid-infrared spectral energy distribution allows us to constrain the effective temperature (K) / gravity (ms-2) / metallicity ([m/H] dex) of ULAS J003400 and ULAS J133511 to 550–600/100–300/0.0–0.3 and 500–550/100–300/0.0–0.3, respectively. These fits imply low masses and young ages for the dwarfs of 5 – 20 MJupiter and 0.1 – 2 Gyr. The fits to 2MASS J093924 are in good agreement with the measured distance, the observational data, and the earlier T8 near-infrared spectral type if it is a slightly metal-poor 4 – 10 Gyr old system consisting of a 500 K and 700 K, 25 MJupiter and 40 MJupiter, pair, although it is also possible that it is an identical pair of 600 K, 30 MJupiter, dwarfs. As no mid-infrared data are available for CFBD J005901 its properties are less well constrained; nevertheless it appears to be a 550 – 600 K dwarf with 300 – 2000 ms-2 and [m/H] 0 – 0.3 dex. These properties correspond to mass and age ranges of 10 – 50 MJupiter and 0.5 – 10 Gyr for this dwarf.
pacs:
97.10.Ex, 97.20.Vs1 Introduction
The low-temperature field brown dwarfs are of interest for many reasons. They are important for studies of star formation and the initial mass function at low masses, and of the chemistry and physics of cool atmospheres. Furthermore, they populate the substellar temperature range and can act as proxies for giant exoplanets which have similar temperatures and radii, but which have less well understood interiors and which are harder to observe than isolated brown dwarfs.
The far-red Sloan Digital Sky Survey (SDSS, York et al. 2000), and near-infrared Deep Near-Infrared Survey of the Southern Sky (DENIS, Epchtein 1998) and Two Micron All Sky Survey (2MASS, Skrutskie et al. 2006), led to the discovery of the field population of very low mass and low temperature stars and brown dwarfs – the L and T dwarfs (e.g. Kirkpatrick et al. 1997, Martin et al. 1999, Strauss et al. 1999, Leggett et al. 2000). The L dwarfs have effective temperatures () of 1400 – 2300 K and the T dwarfs have K (Golimowski et al. 2004, Vrba et al. 2004), with a lower limit not yet defined. Burrows, Sudarsky & Lunine (2003) calculate that several changes will occur near K which may trigger a new spectral type, including the formation of H2O clouds, strengthening of NH3 and the increasing importance of the mid-infrared flux region.
The flux from the T dwarfs is predominantly emitted in the far-red through mid-infrared, and the classification scheme is based on the strength of the near-infrared H2O and CH4 absorption bands (Burgasser et al. 2006). At the time of writing, only 14 T dwarfs are known with spectral type later than T7, i.e. with less than 900 K (e.g. http://www.DwarfArchives.org). The near-infrared spectra of three recently discovered T9 dwarfs (Warren et al. 2007, Burningham et al. 2008, Delorme et al. 2008a), the latest spectral type currently known, hint at an NH3 feature at 1.5 m and suggest that we may be at the brink of defining the next spectral class, for which the letter Y has been suggested (Kirkpatrick et al. 1999).
In this paper we present new mid-infrared spectra for two of these T9 dwarfs, ULAS J003402.77005206.7 and ULAS J133553.45113005.2, obtained with the Infrared Spectrograph (IRS, Houck et al. 2004) on the Spitzer Space Telescope (Werner et al. 2004). We combine these data with the previously published near-infrared spectra and mid-infrared IRAC photometry to generate an almost complete spectral energy distribution for the dwarfs, and use atmospheric and evolutionary models to constrain their physical properties. We also investigate similar data for 2MASS J093935482448279, a T8 dwarf recently found to be very cool (Burgasser et al. 2008), and the near-infrared spectrum for the third T9 dwarf, CFBD J005910.82011401.3.
2 The Sample
Two T9 dwarfs were recently found in the UK Infrared Telescope (UKIRT) Infrared Deep Sky Survey (UKIDSS, Lawrence et al. 2007) and another in the far-red Canada-France-Hawaii Telescope’s Brown Dwarf Survey (CFBDS, Delorme et al. 2008b): ULAS J003402.77005206.7 (hereafter ULAS J003400; Warren et al. 2007), ULAS J133553.45113005.2 (ULAS J133511; Burningham et al. 2008), and CFBD J005910.82011401.3 (CFBD J005901; Delorme et al. 2008a). The two UKIDSS dwarfs were found in the 1st and 3rd data releases of the Large Area Survey (LAS) component of UKIDSS, which reaches . The 3rd data release covers 900 deg2 of a planned 4000 deg2 for the LAS. The CFBDS reaches , and 350 deg2 have been analysed. The discovery papers show that the near-infrared spectra, as well as IRAC photometry for the two UKIDSS dwarfs, imply a very low of 600 K for these three dwarfs. Here we present new data for the two UKIDSS T9 dwarfs; no new data are presented for the CFBDS dwarf but we include it in our analysis as these three dwarfs appear to be similarly cool. We also include in this analysis a dwarf discovered in the 2MASS survey by Tinney et al. (2005): 2MASS J093935482448279 (2MASS J093924). Although classified as T8 using low-resolution near-infrared spectra and methane imaging, Burgasser et al. (2008) show that mid-infrared data constrain its temperature to be similar to that of the T9 dwarfs.
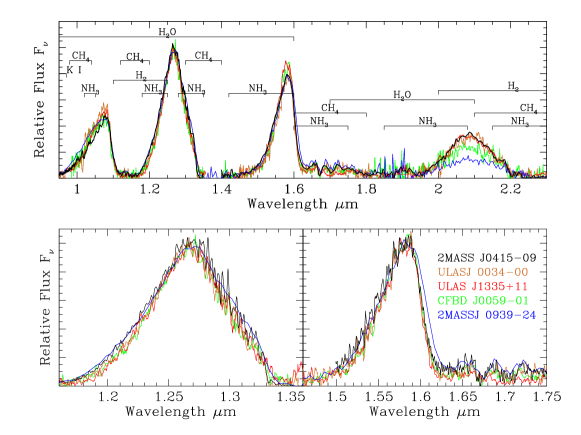
Figure 1 shows the near-infrared spectra of these four dwarfs as well as the spectrum of the T8 spectral standard 2MASS J041519540935066 (2MASS J041509; Burgasser et al. 2002, 2006) which has 725 – 775 K (Saumon et al. 2007). At these low temperatures very little flux remains to be absorbed in the troughs of the strong H2O and CH4 bands and spectral typing based on these fluxes becomes difficult. Burningham et al. (2008), Delorme et al. (2008a) and Warren et al. (2007) show that spectral indices which measure the blue wings of the and flux peaks, “WJ” at 1.21 m and “NH3-” at 1.55 m, appear to be useful type indicators, and that the previously defined “H2O-” at 1.50 m also retains some use at these extreme types (see e.g. Figures 7 though 9 of Burningham et al.). It is likely that there is an NH3 absorption feature in the blue wing of the band for the coolest dwarfs, and Delorme et al. (2008a) suggest that these objects may be the prototype of the Y spectral class. However the feature is difficult to distinguish from the strong H2O and CH4 bands and so until even later-type dwarfs are available to define the Y class we adopt a type of T9 here (as also suggested by Burningham et al.).
The three dwarfs classified as T9 have narrower and (1.2 and 1.6 ) flux peaks than 2MASS J041509, suggesting that they are cooler than 750 K. The near-infrared indices, including the “WJ” and “NH3-” indices, confirm an earlier type of T8 for 2MASS J093924. However, as shown by Burgasser et al. (2008) and as we demonstrate below, the mid-infrared data for 2MASS J093924 constrain its temperature to be similar to the T9 dwarfs. The near-infrared spectrum of 2MASS J093924 is very low resolution with or m, so that detection of the variation in the width of the and bands is somewhat compromised; however the object is further complicated by possible binarity (Burgasser et al. and §5.4) and we show later that multiplicity can addresses the discrepancy between near-infrared spectral type and temperature.
Table 1 lists astrometric and photometric data for the three T9 dwarfs and 2MASS J093924, taken from the sources referenced in the Table. The photometry for the UKIDSS dwarfs has been converted to the SDSS AB system using transformations given by Warren et al. (2007). The photometry is on the Mauna Kea Observatories Vega-based system (Tokunaga et al. 2002; the for 2MASS J093924 is synthesized from its spectrum which was flux calibrated using 2MASS photometry). The IRAC photometry is reported in the standard IRAC system, which is calibrated against Vega. The IRAC values provide a flux density at a nominal wavelength assuming a flux distribution where is constant, which is not the case for T dwarfs. Hence the IRAC magnitudes do not give the flux at the nominal wavelengths listed in Table 1, but do give a scaling factor for the spectrum over the IRAC filter bandpasses (e.g. Cushing et al. 2006).
3 Spitzer IRS Observations
We used the Short-Low (SL) module of the IRS to obtain first-order 7.6 – 15.2 spectra of ULAS J003400 and ULAS J133511 in the standard staring mode, which produces low-resolution spectra with 60 – 120. Wavelengths longer than m are compromised by an overlapping second order. The blue peakup band was used to center the targets in the 3.7” slit by offsetting from a nearby bright star, and cycles were repeated after nodding the target along the slit by roughly one- and two-thirds of its length.
ULAS J003400 was observed as part of program 40419 using instrument-team guaranteed time in Cycle 4. The dwarf was observed on 2008 January 15 and January 16, each time using a 240 second ramp duration and 32 cycles. The total time on source was 8.5 hours, and the total AOR duration was 10.8 hours.
The brighter dwarf ULAS J133511 was observed as part of program 40449 using general observer time in Cycle 4. The dwarf was observed on 2008 August 9, using a 60 second ramp duration and 64 cycles. The total time on source was 2.1 hours, and the total AOR duration was 2.8 hours.
Low-level processing of the spectra was done automatically by versions 17.2.0 and 18.1.0 of the IRS pipeline for ULAS J003400 and ULAS J133511, respectively. The IRS pipeline removed all of the instrumental artifacts to produce Basic Calibrated Data (BCD) for each exposure. The data were further reduced as described in Cushing et al. (2006). Briefly, the spectra were extracted using a modified version of the Spextool package with a fixed aperture of 6”. Observations of Lac, obtained as part of the IRS calibration observations, were used to remove the instrument response and flux calibrate the spectra. The flux calibration was checked using the IRAC band 4 (6.4 – 9.3 m) photometry, extrapolating the observed spectrum bluewards from 7.6 to 6.4 m using the observed spectrum of the T8 dwarf 2MASS J041509 as a template. Very little flux is emitted at these wavelengths due to strong absorption by H2O at 5 – 7 m and CH4 at 7 – 9 m. This photometric check showed that the IRS calibration is accurate to 10%.
Figure 2 shows the IRS spectra of ULAS J003400 and ULAS J133511.
4 Atmospheric and Evolutionary Models
Atmospheric and evolutionary models were generated by members of our team (Marley et al. 2002, Saumon & Marley 2008). The atmospheric models include all the significant sources of gas opacity (Freedman et al. 2008). However there are known deficiencies in the molecular opacity line lists at m , where the line list for CH4 is incomplete and the line list for NH3 does not exist. At the temperatures considered here these opacities are significant and we return to this issue later in §5 and §6. The models assume solar system abundances and calculate the equilibrium abundances of the important C, N, and O bearing gases as detailed by Freedman et al. (2008). These equilibrium values are then used to determine the abundances of the various gas species in each atmospheric layer during construction of the temperature-pressure profile. We iteratively compute models in radiative-convective equilibrium, solving for a temperature-pressure profile while employing the source-function technique of Toon et al. (1989) to solve the equation of transfer. During this process, condensates of certain refractory elements are included in atmospheric layers where physical conditions favor such condensation. At the temperatures considered here the condensate clouds are located deep below the photosphere and the opacity of the clouds is ignored although grain condensation is still accounted for in the chemistry.
The models also include vertical transport in the atmosphere, which significantly affects the chemical abundances of C-, N- and O-bearing species. The very stable molecules CO and N2 are dredged up from deep layers to the photosphere, causing enhanced abundances of these species and decreased abundances of CH4, H2O, and NH3 (e.g. Fegley & Lodders 1996, Hubeny & Burrows 2007, Saumon et al. 2007). Vertical transport is parameterized in our models by an eddy diffusion coefficient (cm2 s-1) that is related to the mixing time scale. Generally, larger values of imply greater enhancement of CO and N2 over CH4 and NH3, respectively. Values of – 6, corresponding to mixing time scales of yr to h respectively, reproduce the observations of T dwarfs (e.g. Leggett et al. 2007a, Saumon et al. 2007).
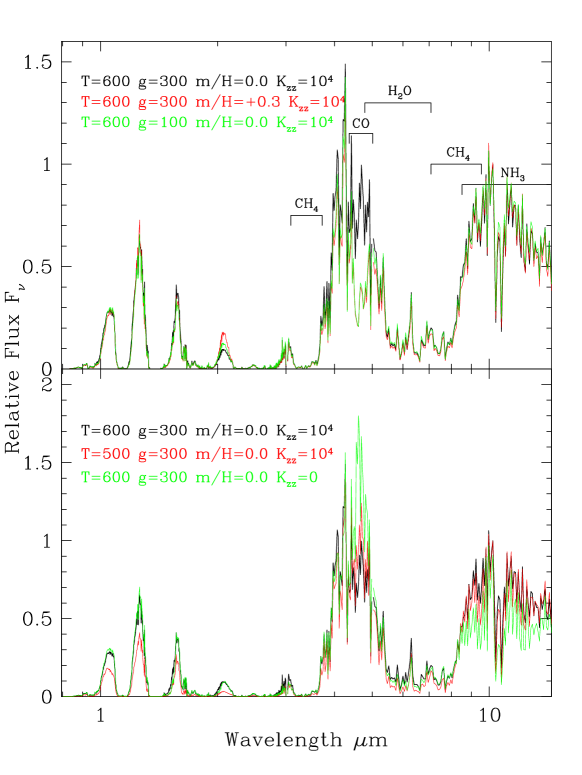
The evolutionary sequences of Saumon & Marley (2008), computed with cloudless models as the surface-boundary condition, provide radius, mass, and age for a variety of atmospheric parameters. For this investigation synthetic spectra were generated with of 500, 550, 600, 650 and 700 K; gravity of 100, 300, 1000 and 2000 ms-2 (corresponding to in c.g.s. units of 4.00, 4.48, 5.00 and 5.30); metallicities of solar and twice solar ([m/H]); and vertical mixing diffusion coefficient of zero (corresponding to equilibrium) and cm2s-1. A limited set was also calculated with cm2s-1 and [m/H]. The evolutionary models show that a brown dwarf with K must have ms-2 if its age is Gyr (Saumon & Marley 2008).
Figure 3 plots a selection of 500 K and 600 K synthetic spectra to demonstrate the effects of varying the atmospheric parameters. The top panel shows that metallicity and gravity variations can affect the spectral energy distributions similarly — an increase in metallicity or a decrease in gravity leads to significantly increased flux in the -band at 2.2 m, and decreased flux at 4.5 m (impacting IRAC band 2 photometry for example). The opposite changes occur if metallicity is decreased or gravity increased. The lower panel shows that varying impacts the overall slope of the spectral energy distribution — decreasing increases the ratio of the mid- to near-infrared fluxes (although surface flux at all wavelengths decreases with decreasing temperature). The lower panel also shows that the mixing parameter strongly affects the 4.5 m and 9 – 15 m fluxes: increasing reduces the 4.5 m flux as CO is dredged up, and increases the 9 – 15 m flux as N2 is favored over NH3. For the objects considered here the CH4 and H2O bands are not significantly affected by CO mixing, as the amount of carbon and oxygen tied up in CO is a small fraction of that in these other molecules at these temperatures.
5 Analysis
5.1 The 0.9 – 2.5 m and 7.6 – 14.5 m Spectra of ULAS J003400 and ULAS J133511
The synthetic spectra were compared to the observed 0.9 – 2.5 m and 7.6 – 14.5 m spectra of ULAS J003400 and ULAS J133511 using the fitting procedure described by Cushing et al. (2008), except that here we do not mask out the 1.58 to 1.75 m spectral region. No regions were ignored in the fitting, despite the known problems at m (§4). The procedure uses weighted least-squares fitting to identify the synthetic spectrum that best matches the observed spectrum. The scaling of the synthetic spectra to the observations is determined as part of the fitting procedure, by minimising the weighted deviation between the two datasets.
Fits using the entire wavelength range as well as only the near- or mid-infrared were carried out. For both of these T9 dwarfs the fits to either the near- or mid-infrared regions alone imply a value of of . However the fit to the mid-infrared spectrum does not constrain the temperature strongly, and the fit to the near-infrared is very poor in the -band. The fits to the full spectrum gives a lower temperature of for ULAS J003400 and for ULAS J133511; in these full-range fits the match to the -band is improved at the expense of a poorer fit to the -band. Increasing makes the overall spectrum bluer (e.g. Figure 3), and temperatures as high as suggested by the near-infrared fits cannot reproduce the observed full spectral energy distributions.
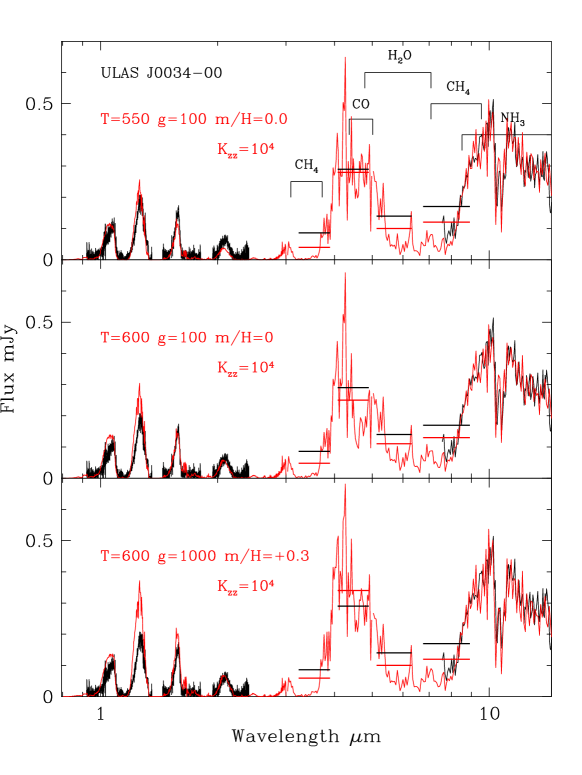
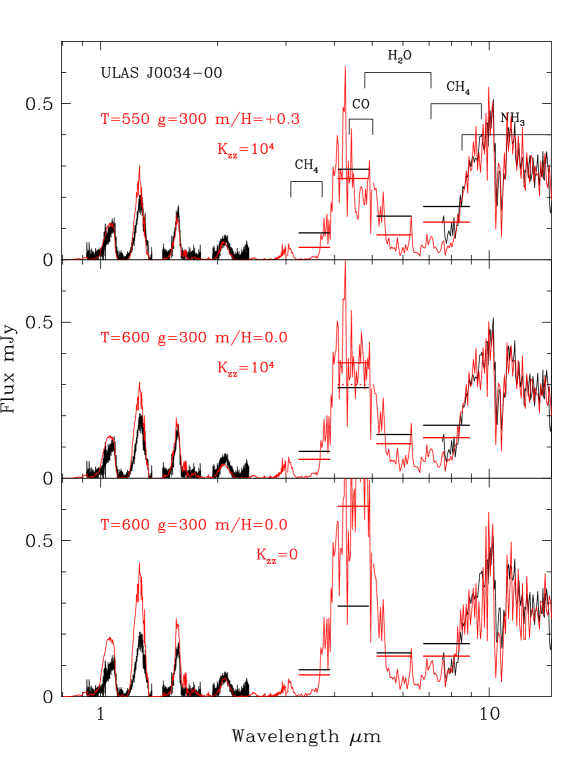
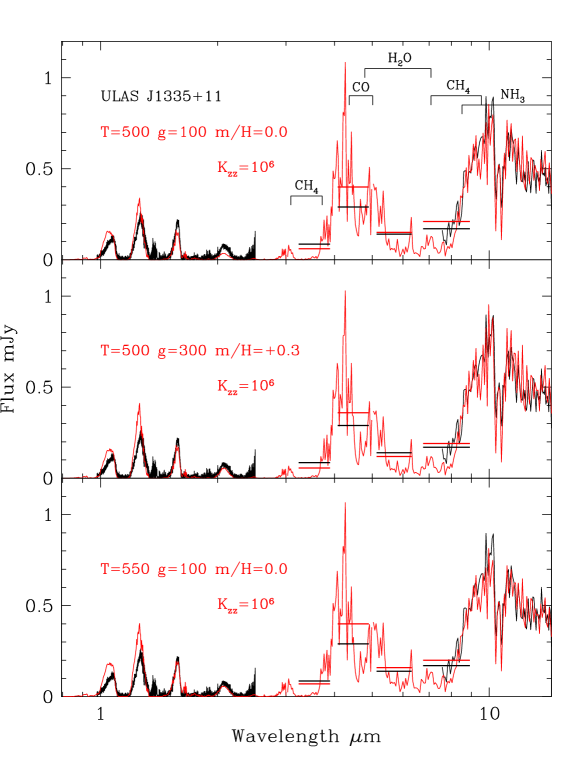
The best fitting model to the spectrum of ULAS J003400 has effective temperature (K) / gravity (ms-2) / metallicity ([m/H] dex) of 550 / 100 / 0.0; this fit is shown in the top panel of Figure 4. However temperatures in the range 550 – 600 K, gravities of 100 – 300 ms-2 and metallicities of 0.0 – 0.3 dex do not give significantly worse fits, as shown in the top two panels of Figures 4 and 5. The best fitting model to the spectrum of ULAS J133511 has effective temperature (K) / gravity (ms-2) / metallicity ([m/H] dex) of 500 / 100 / 0.0; this fit is shown in the top panel of Figure 6. Temperatures in the range 500 – 550 K, gravities of 100 – 300 ms-2 and metallicities of 0.0 – 0.3 dex give similar quality fits as shown in Figure 6.
The full spectral range supports a low gravity for both dwarfs of ms-2 . Although an increase in gravity can be partly compensated for by increasing metallicity, a gravity as high as ms-2 gives a poorer least-squares fit to both dwarfs, and this can be seen for ULAS J003400 in the bottom panel of Figure 4.
For both dwarfs, models which include gas transport, i.e. non-equilibrium chemistry with , are strongly preferred by the fits to the mid-infrared only and the fits to the entire spectral range. The equilibrium chemistry models do not reproduce the shape of the 9 – 15 spectrum, where NH3 absorption is strong, but not as strong as it would be in the case; this is shown in the bottom panel of Figure 5. The flux at 4.5 m is also dependent on the value of , which we discuss further when considering the IRAC photometry below. Vertical mixing in ULAS J133511 appears stronger than in ULAS J003400 based on the 4.5 m IRAC photometry; we determine cm2s-1 cf. cm2s-1 for ULAS J003400 (§5.2).
5.2 The 3 - 9 m Photometry of ULAS J003400 and ULAS J133511
The IRAC photometry for ULAS J003400 and ULAS J133511 (Warren et al. 2007, Burningham et al. 2008) fills the gap between the near- and mid-infrared spectra and provides another check of the model fit. The observed and calculated IRAC fluxes are indicated in Figures 4, 5 and 6. The observed fluxes are determined by transforming the observed magnitudes to fluxes using the Vega fluxes of 280.9, 179.7, 115.0 and 64.1 Jy at the four IRAC bands [3.6], [4.5], [5.8] and [8.0], respectively, as provided in the IRAC Data Handbook. The calculated flux is determined in the same way from synthetic absolute magnitudes, scaling by the distance to the dwarf, , which is provided by the spectral fit. The scaling factor required to match the synthetic spectra to the data is a function of the solid angle where is the radius of the dwarf. As is known from the evolutionary model corresponding to the particular set of atmospheric parameters , and [m/H], the distance can be derived. Both dwarfs are assumed to be single in this analysis; both have been imaged at high resolution and not resolved (N. Lodieu and M. Liu, private communications).
The IRAC [4.5] flux is sensitive to the vertical transport coefficient as shown in Figures 3 and 5. Increasing from 4 to 6 reduces the [4.5] flux by 10 – 25% at these temperatures and gravities, as the non-equilibrium abundance of CO increases. The other IRAC bands are insensitive to at these low temperatures, as described in §4 and shown in the middle panel of Figure 5. Hence % effects at [4.5] can be neglected when examining the model fits as these can be addressed by varying .
All the models preferred by the spectral fits to ULAS J003400 give IRAC [3.6], [5.8] and [8.0] fluxes which are too low by 30 – 50 %. The agreement at [4.5] is good as long as (which is required by the spectral fits also). The fits to the [3.6], [5.8] and [8.0] fluxes are better for ULAS J133511, while the [4.5] model flux is high by 20 – 30 % for this dwarf, even with cm2s-1. The fact that subsets of the modelled and observed IRAC photometry agree well for each dwarf suggests that a more detailed model grid and a model fitting routine which incorporates both the spectroscopy and photometry could provide a more consistent set of observed and synthetic data. We postpone such work until the molecular line lists are improved (see §6).
Despite the remaining 30% discrepancies at [3.6], [5.8] and [8.0] for ULAS J003400 (regions where there is very little flux), the near- and mid-infrared spectra, and the IRAC photometry, together with our models, can satisfactorily constrain (K)/ (ms-2)/[m/H] (dex) to 550 – 600/100 – 300/0.0 – 0.3 and 500 – 550/100 – 300/0.0 – 0.3 for ULAS J003400 and ULAS J133511, respectively. Vertical transport of gas must be significant, with a diffusion coefficient of – cm2 s-1, similar to values found for earlier-type T dwarfs.
These parameters and their corresponding radii, masses, ages, distances and tangential velocities are given in Table 2. The low temperatures and gravities imply that the dwarfs have masses of only 5 – 20 MJupiter and young ages of 0.1 – 2 Gyr. We discuss the uncertainties in these parameters in §6. We note that the implied distance of 13 – 16 pc for ULAS J003400 is in excellent agreement with a preliminary trigonometric parallax of 14 3 pc (R. Smart, private communication).
5.3 Trends in Color
Fitting the synthetic spectra to the observations showed that the ratio of the mid- to near-infrared flux is very sensitive to temperature. Combining ground-based near-infrared photometry with IRAC photometry therefore should be a useful indicator of , in particular the [4.5] band as there is very little flux at [3.6], [5.8] and [8.0]. Warren et al. (2007) investigate various color combinations and find that [4.5] is a good indicator of for T dwarfs. While the -band is sensitive to metallicity and gravity, the -band is insensitive (e.g. Figure 3). Stephens et al. (2009) show that T dwarf colors involving and IRAC magnitudes show a lot of scatter with , at least some of which is due to condensates clearing out of the photospheric region probed by 1.2 m radiation in the earlier T dwarfs.
Figure 7 shows [4.5] as a function of . Model sequences are shown for a range of gravity and metallicity, and for non-equilibrium chemistry models with cm2 s-1. Increasing by a factor of 100 leads to no significant change in , but a decrease in [4.5] of 0.1 – 0.3 magnitudes. From this and other studies it appears that the range of in T dwarfs is – cm2 s-1 and so the uncertainty in the modelled [4.5] due to unknown should be 0.2 magnitudes. Plausible changes in gravity and metallicity for a local disk sample also affect [4.5] by 0.2 magnitudes and affect by 0.3 – 0.6 magnitudes at the temperatures considered here (note the effect on increases with decreasing temperature). As described before, the trends with metallicity and gravity are degenerate. Although these 0.2 magnitude uncertainties are not ideal in a temperature indicator, Figure 7 shows that for K [4.5] increases by 0.6 – 0.8 magnitudes per 100 K and so temperatures can still be accurately determined. The Spitzer warm mission retains IRAC [4.5] capability and hence will continue to provide important data for studies of brown dwarfs.
Colors for ULAS J003400, ULAS J133511 and 2MASS J093924 are shown in Figure 7, as well as those of other dwarfs taken from the literature (Patten et al. 2006, Leggett et al. 2007a, Luhman et al. 2007). The T7.5 dwarfs Gl 570D and HD 3651B are benchmark dwarfs with well constrained ages and metallicities from their primary stars, and well constrained based on their measured luminosity and the known distance to the primary star (Burgasser et al. 2000, Burgasser 2007, Liu et al. 2007, Mugrauer et al. 2006, Saumon et al. 2006). Gl 570D has 750 – 825 K, 630 – 2000 ms-2 and [m/H] 0.01 – 0.10; HD 3651B has 780 – 840 K, 1260 – 3160 ms-2 and [m/H] 0.09 – 0.16. 2MASS J041509 has a well measured distance and spectral energy distribution which indicates 725 – 775 K, 1000 – 2500 ms-2 and [m/H] 0.0 – 0.3 dex (Saumon et al. 2007). If the sequences shown in Figure 7 are shifted redwards in by 0.2 magnitudes and redwards in [4.5] by 0.1 magnitudes there is good agreement with the observations of these slightly metal-rich dwarfs, and with the overall population in the diagram. The models appear to be too faint at , and this can also be seen in Figures 4 through 6. Most likely this is due to some inadequacy in the CH4 line list or the H2 collision-induced absorption, as discussed in Saumon & Marley (2008; their §4.1).
The color trends shown in Figure 7 support the temperatures, gravities and metallicities found above for ULAS J003400 and ULAS J133511: that they are relatively low-gravity dwarf with solar or enhanced metallicities, and that ULAS J133511 is cooler than ULAS J003400. The colors also support the conclusion of Burgasser et al. (2008) in their analysis of the T8 dwarf 2MASS J093924: that it has a similar temperature to these T9 dwarfs, but a higher gravity and/or lower metallicity. We explore fits to this object’s spectral distribution in the following section.
5.4 Fitting the Spectral Energy Distribution of 2MASS J093924
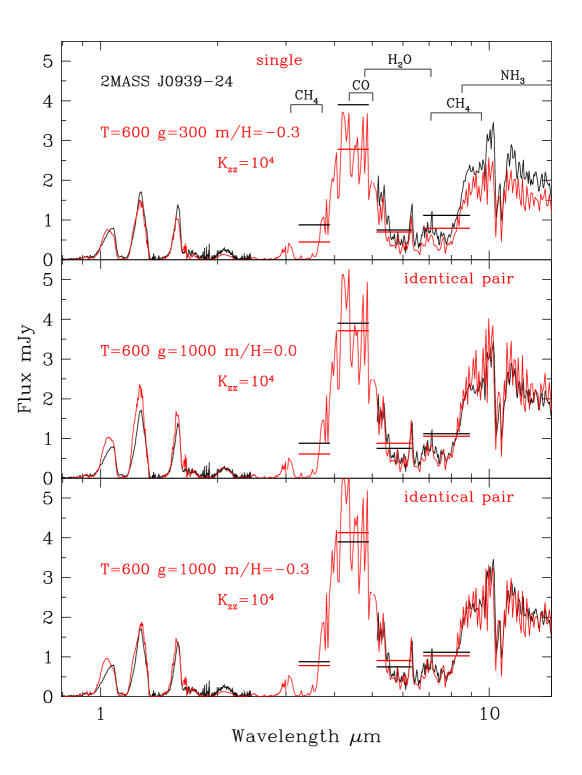
Burgasser et al. (2008) find the following parameters for 2MASS J093924 using near- through mid-infrared observational data: K, 600 ms-2 and [m/H] (the uncertainties in and [m/H] are quite large). The same model set and a similar least-squares fitting routine were used as we use here for ULAS J003400 and ULAS J133511. In this case however the distance to the dwarf is known and so the scaling factor required to match the models to the observations gives the radius of the dwarf, or alternatively if the radius is known from evolutionary arguments then the scaling factor can be derived. Adopting the first approach Burgasser et al. show that the radius is larger than expected from the models, and they suggest the dwarf is a binary.
Figure 8 shows this dwarf’s observed spectroscopy, IRAC photometry and a selection of modelled data. We have selected models with K and values of gravity and metallicity within the range determined by Burgasser et al.’s least-squares fitting. Scaling of the modelled spectra and photometry is achieved using the known distance to the dwarf and the radius from evolutionary models. We assume that either it is single or an equal luminosity unresolved pair, as best matches the data. The lower gravity fit, which would be marginally consistent with this object being single, is a significantly poorer fit to the spectra and photometry than the higher gravity fits, which require it to be a binary system. Also a warmer model with 650 K can reproduce the near-infrared data well if the dwarf is single, but is under-luminous in the mid-infrared by 30%. A reasonable fit can be found if indeed, as suggested by Burgasser et al., this is a pair of similar luminosity 600 K dwarfs with ms-2 and [m/H] – 0.0 dex.
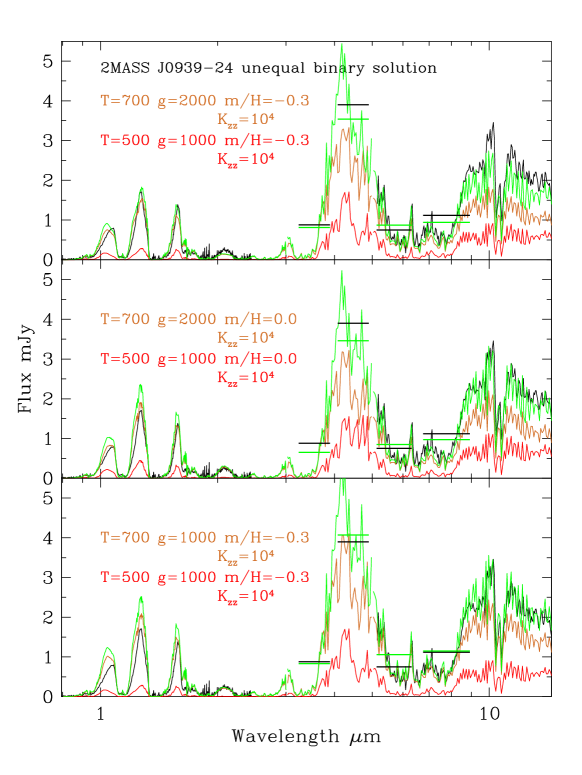
Given that a temperature as low as 600 K is unexpected for an object with the same near-infrared spectral type as the 750 K dwarf 2MASS J041509, and that the near-infrared data led Leggett et al. (2007b) to assign K to 2MASS J093924, we explored the possibility that this object consists of a more dissimilar pair of dwarfs. We find that a satisfactory fit is produced if 2MASS J093924 is composed of a 700 K and a 500 K dwarf. The gravities must be high so that the radii are small, otherwise the total flux of the system is too large. The relative gravities are also constrained by the evolutionary models, as the dwarfs presumably are coeval. Fits with 1000 ms-2 for the 500 K dwarf constrains the gravity of the 700 K dwarf to 1000 – 2000 ms-2. The system still appears to be somewhat metal-poor with [m/H] – 0.0 dex. Figure 9 shows composite fits for this range of parameters. To improve the agreement with the previously determined temperature of this object, and to make the temperature:spectral type correlation stronger, this dissimilar-pair solution is preferred to the equal-luminosity pair solution. The near-infrared spectrum is then dominated by the warmer dwarf (see Figure 9) and becomes consistent with the T8 spectral type. The modelled dissimilar pair has slightly wider and flux peaks than the equal luminosity pair, consistent with the wider peaks observed for 2MASS J093924 and 2MASS J041509 compared to the three T9 dwarfs (Figure 1).
However the detailed spectral shape is sensitive to gravity and metallicity as well as temperature, and the temperature:spectral type relationship will have some scatter. Hence unless the object is resolved it cannot be determined whether the equal or non-equal pair solution is correct. The physical properties of both solutions are listed in Table 2. The 500 K 700 K pair are constrained to be high gravity and therefore quite old at 4 – 10 Gyr; perhaps appropriate for the slightly metal-poor nature of the system.
5.5 The 0.9 – 2.5 m Spectrum of CFBD J005901
At this time there are no mid-infrared data published for the T9 dwarf CFBD J005901. Figure 1 shows that the near-infrared spectrum of CFBD J005901 is very similar to ULAS J003400 and ULAS J133511, except that the -band flux is suppressed. Burningham et al. (2008) show that the “WJ”, “NH3-” and “H2O-” indices place CFBD J005901 consistently between ULAS J003400 and ULAS J133511, and Delorme et al. (2008a) conclude that it is 50 K cooler than ULAS J003400 based on a comparison of near-infrared features. The indices and flux suggest that CFBD J005901 has a temperature between that of ULAS J003400 and ULAS J133511 and either a higher gravity or lower metallicity. The value is intermediate between the ULAS T9 dwarfs and 2MASS J093924 (see Figure 6), suggesting that either it is not as metal-poor or as high gravity as the latter dwarf (or pair of dwarfs). Delorme et al. find that CFBD J005901 is unresolved at high resolution and so here we assume it is single.
Fitting the near-infrared spectrum alone, we find that a temperature as low as 500 K does not give a satisfactory fit; 550 – 600 K produces similar fits in the near-infrared as the other dwarfs, when 300 – 2000 ms-2 and [m/H] 0 – 0.3 dex. The high metallicities are required if 550 K and 1000 – 2000 ms-2, to fit the -band flux. This temperature range of 550 – 600 K is in agreement with the trends in the near-infrared indices, and Delorme et al.’s conclusion that CFBD J005901 is cooler than ULAS J003400, if CFBD J005901 is at the low-end of the range while ULAS J003400 is at the high end.
The range of implied distances and other physical properties for CFBD J005901 are given in Table 2. This dwarf may be significantly older and more massive than ULAS J003400 and ULAS J133511; its tangential velocity is also significantly higher (50 kms-1 cf. 25 kms-1). Mid-infrared data will greatly help constrain its parameters. Such data are needed to confirm the temperature implications of the near-infrared indices, and will also constrain metallicity and gravity by fixing the scaling of the models and restricting the slope of the near-infrared flux distribution.
6 Discussion and Conclusions
We have used new and published near- through mid-infrared spectroscopy and photometry to constrain the atmospheric parameters of the very low-temperature dwarfs ULAS J003400, ULAS J133511 and 2MASS J093924. We find strong evidence that photospheric mixing continues to be an important process, even at these cool temperatures. Any 5 m survey for Y dwarfs (e.g. WISE or Spitzer warm missions) must take this mixing into account, as the flux will be less than predicted by equilibrium chemistry. Considering the complexity of the atmospheres, the models reproduce the data well. However there are known deficiencies in the molecular opacity line lists, and discrepancies can be seen in Figures 4 – 6 and 8. The known problems are large at m , where the line list for CH4 is incomplete, the line list for NH3 does not exist, and where treatment of the red wing of the very broad 0.77 m K I line is difficult. These problems most likely account for the excess model flux seen in our fits at m .
Given these deficiencies, the systematic errors in our derived parameters are difficult to determine. However, the good agreement with evolutionary models for the 800 K brown dwarf companions to stars of known age and metallicity means that it is unlikely that the errors are larger than 100 K in , or a factor of two in gravity and metallicity (see the trends shown in Figures 3 and 7). Nevertheless it is of paramount importance that the line lists for CH4 and NH3 are improved, now that objects as cool as 500 K are being discovered.
It is also very helpful at these low temperatures to have mid-infrared observational data. The absorption features in the near-infrared are effectively saturated, and the changes with temperature have become subtle. The mid-infrared flux level is very sensitive to temperature and can remove this degeneracy; this sensitivity increases with decreasing temperature as shown in Figure 7. Mid-infrared data offers the possibility of identifying low-temperature systems such as 2MASS J093924, which may be a 500 K 700 K brown dwarf pair. We find that two of the three currently known T9 dwarfs have K and the third appears to be even cooler with K . Vertical transport of gas remains significant even at these very low temperatures, so that enhanced CO opacity reduces the flux at 4.5 m and decreased NH3 opacity increases the flux at 9 – 15 m.
The evolutionary models show that the parameters we derive for ULAS J003400 and ULAS J133511 imply that they are both very low mass and relatively young — their masses are between 5 and 20 MJupiter corresponding to an age range of 0.1 to 2.0 Gyr. The ranges for CFBD J005901 are larger — 10 – 50 MJupiter and 0.5 – 10 Gyr. If 2MASS J093924 consists of a 500 K 700 K binary then it is relatively old and massive: a 4 – 10 Gyr system composed of a 25 MJupiter and a 40 MJupiter brown dwarf pair.
References
References
- [1]
- [2] [] Burgasser A et al. 2000 ApJ 531 L57
- [3]
- [4] [] Burgasser A et al. 2002 ApJ 564 421
- [5]
- [6] [] Burgasser A, Geballe T R, Leggett S K, Kirkpatrick J D and Golimowski D A 2006 ApJ 637 1067
- [7]
- [8] [] Burgasser A 2007 ApJ 658 617
- [9]
- [10] [] Burgasser A, Tinney C G, Cushing M C, Saumon D, Marley M S, Bennett C S and Kirkpatrick J D 2008, ApJ 689 L53
- [11]
- [12] [] Burningham B et al. 2008, MNRAS 391 320
- [13]
- [14] [] Burrows A, Sudarsky D, and Lunine J I 2003 ApJ 596 587
- [15]
- [16] [] Cushing M C et al. 2006 ApJ 648 614
- [17]
- [18] [] Cushing M C et al. 2008 ApJ 678 1372
- [19]
- [20] [] Delorme P et al. 2008 A&A 482 961
- [21]
- [22] [] Delorme P et al. 2008 A&A 484 469
- [23]
- [24] [] Epchtein N 2008 Proc. 179th Symposium of the International Astronomical Union (Kluwer Academic Publishers) p 106
- [25]
- [26] [] Fazio, G. et al. 2004 ApJS 154 10
- [27]
- [28] [] Fegley B and Lodders K 1996 ApJL 472 L37
- [29]
- [30] [] Freedman R S, Marley M S and Lodders K 2008 ApJS 174 504
- [31]
- [32] [] Golimowski D A et al. 2004 AJ 127 3516
- [33]
- [34] [] Houck J R et al. 2004 ApJS 154 18
- [35]
- [36] [] Hubeny I and Burrows A 2007 ApJ 669 1248
- [37]
- [38] [] Kirkpatrick D J, Beichman C A and Skrutskie M F 1997 ApJ 476 311
- [39]
- [40] [] Kirkpatrick D J et al. 1999 ApJ 519 802
- [41]
- [42] [] Knapp G R et al. 2004 AJ 127 3553
- [43]
- [44] [] Lawrence A et al. 2007 MNRAS 379 1599
- [45]
- [46] [] Leggett S K et al. 2000 ApJ 536 L35
- [47]
- [48] [] Leggett S K, Saumon D, Marley M S, Geballe T R, Golimowski D A, Stephens D and Fan X 2007a ApJ 655 1079
- [49]
- [50] [] Leggett S K, Marley M S, Freedman R, Saumon D, Liu M C, Geballe T R, Golimowski D A, and Stephens D 2007b ApJ 667 537
- [51]
- [52] [] Liu M C, Leggett S K and Chiu K 2007 ApJ 660 1507
- [53]
- [54] [] Luhman K L et al. 2007 ApJ 654 570
- [55]
- [56] [] Marley M S, Seager S, Saumon D, Lodders K, Ackerman A S, Freedman R S, and Fan X 2002 ApJ 568 335
- [57]
- [58] [] Martin E L, Delfosse X, Basri G, Goldman B, Forveille T and Zapatero Osorio M 1999 AJ 118 2466
- [59]
- [60] [] McLean I et al. 2003 ApJ 596 561
- [61]
- [62] [] Mugrauer M, Seifahrt A, Neuhauser R and Mazeh T 2006 MNRAS 373 L31
- [63]
- [64] [] Patten B M et al. 2006 ApJ 651 502
- [65]
- [66] [] Saumon D, Marley M S, Cushing M C, Leggett S K, Roellig T L, Lodders K and Freedman R S 2006 ApJ 647 552
- [67]
- [68] [] Saumon D et al. 2007 ApJ 662 1245
- [69]
- [70] [] Saumon D and Marley M S 2008 ApJ
- [71]
- [72] [] Skrutskie M F et al. 2006 AJ 131 1163
- [73]
- [74] [] Stephens D S, Leggett S K, Cushing M C, Saumon D, Marley M S, Geballe T, Golimowski D A and Fan X 2009, ApJ
- [75]
- [76] [] Strauss M A et al. 1999 ApJ 522 61
- [77]
- [78] [] Tinney C G, Burgasser A J, Kirkpatrick J D and McElwain M W 2005 AJ 130 2326
- [79]
- [80] [] Tokunaga A T, Simons D A and Vacca W D 2002 PASP 114 180
- [81]
- [82] [] Toon O B, McKay C P, Ackerman T P and Santhanam K 1989 JGR 94 16287
- [83]
- [84] [] Vrba F J et al. 2004 AJ 127 2948
- [85]
- [86] [] Warren S J et al. 2007 MNRAS 381 1400
- [87]
- [88] [] Werner M W et al. 2004 ApJS 154 1
- [89]
- [90] [] York D G et al. 2000 AJ 120 1579
- [91]
| Property | ULAS J003400a | CFBD J005901 | 2MASS J093924b | ULAS J133511 |
|---|---|---|---|---|
| Right Ascension | 00:34:02.77 | 00:59:10.90 | 09:39:35.48 | 13:35:53.45 |
| Declination | 00:52:06.7 | 01:14:01.1 | 24:48:27.9 | 11:30:05.2 |
| Epoch yyyymmdd | 20051004 | 20070805 | 20000210 | 20070421 |
| ”/yr | 0.05 | 0.940.06 | 0.5730.002 | 0.160.05 |
| ”/yr | 0.05 | 0.180.06 | 1.0450.003 | 0.05 |
| Distance pc | 14 3 | 5.340.13 | ||
| 22.110.05 | 21.930.05 | 22.040.10 | ||
| 18.900.10 | 18.820.02 | 18.810.04 | ||
| 18.150.03 | 18.060.03 | 15.610.09 | 17.900.01 | |
| 18.490.04 | 18.270.05 | 15.960.09 | 18.250.01 | |
| 18.480.05 | 18.630.05 | 16.830.09 | 18.280.03 | |
| 3.55 m | 16.280.03 | 13.760.04 | 15.960.03 | |
| 4.49 m | 14.490.03 | 11.660.04 | 13.910.03 | |
| 5.73 m | 14.820.05 | 12.960.04 | 14.340.05 | |
| 7.87 m | 13.910.06 | 11.890.04 | 13.370.07 | |
| References | 1 | 2 | 3, 4 | 5 |
a The preliminary parallax is a private communication from R. Smart.
b The MKO-system photometry is synthesized from the spectrum
which was flux-calibrated using 2MASS photometry.
References: (1) Warren et al. 2007, (2) Delorme et al. 2008a,
(3) Tinney et al. 2005, (4) Burgasser et al. 2008,
(5) Burningham et al. 2008.
| Name | [m/H] | R/R⊙ | Mass | Age | Distance | Vtan | ||
|---|---|---|---|---|---|---|---|---|
| (K) | (ms-2) | (Jupiter) | (Gyr) | (pc) | (kms-1) | |||
| ULAS J003400 | 550 | 100 | 0.0 | 0.12 | 5 – 8 | 0.1 – 0.2 | 14 | 25 |
| 550 | 300 | 0.3 | 0.11 | 10 – 20 | 1 – 2 | 13 | 23 | |
| 600 | 100 | 0.0 | 0.12 | 5 – 8 | 0.1 – 0.2 | 16 | 28 | |
| 600 | 300 | 0.0 | 0.11 | 10 – 20 | 1 – 2 | 13 | 25 | |
| ULAS J133511 | 500 | 100 | 0.0 | 0.12 | 5 – 8 | 0.1 – 0.2 | 9 | 17 |
| 500 | 300 | 0.3 | 0.11 | 10 – 20 | 1 – 2 | 9 | 14 | |
| 550 | 100 | 0.0 | 0.12 | 5 – 8 | 0.1 – 0.2 | 11 | 17 | |
| 2MASS J093924ABa | 600 | 1000 | – 0.0 | 0.09 | 20 – 40 | 2 – 10 | 5.34 | 30 |
| 2MASS J093924Ab | 700 | 1000 – 2000 | – 0.0 | 0.08 – 0.09 | 30 – 50 | 4 – 10 | 5.34 | 30 |
| 2MASS J093924Bb | 500 | 1000 | – 0.0 | 0.09 | 20 – 30 | 4 – 10 | 5.34 | 30 |
| CFBD 005901 | 550 | 300 | 0.0 | 0.11 | 10 –20 | 0.5 – 2 | 11 | 50 |
| 550 | 1000 | 0.3 | 0.09 | 25 – 40 | 4 – 10 | 11 | 50 | |
| 550 | 2000 | 0.3 | 0.08 | 40 – 50 | 10 | 10 | 45 | |
| 600 | 300 | 0.0 | 0.11 | 10 –20 | 0.5 – 2 | 14 | 64 | |
| 600 | 1000 | 0.0 | 0.09 | 25 – 40 | 4 – 10 | 11 | 50 | |
| 600 | 2000 | 0.0 | 0.08 | 40 – 50 | 10 | 10 | 45 |
aAssuming that this object is a pair of similar luminosity dwarfs.
bAssuming that this object is a pair of dissimilar dwarfs.