Probing the Yb3+ spin relaxation in Y0.98Yb0.02Ba2Cu3Ox by Electron Paramagnetic Resonance
Abstract
The relaxation of Yb3+ in YBa2Cu3Ox () was studied using Electron Paramagnetic Resonance (EPR). It was found that both electronic and phononic processes contribute to the Yb3+ relaxation. The phononic part of the relaxation has an exponential temperature dependence, which can be explained by a Raman process via the coupling to high-energy (500 K) optical phonons or an Orbach-like process via the excited vibronic levels of the Cu2+ ions (localized Slonczewski-modes). In a sample with a maximum oxygen doping =6.98, the electronic part of the relaxation follows a Korringa law in the normal state and strongly decreases below . Comparison of the samples with and without Zn doping proved that the superconducting gap opening is responsible for the sharp decrease of Yb3+ relaxation in YBa2Cu3O6.98. It was shown that the electronic part of the Yb3+ relaxation in the superconducting state follows the same temperature dependence as 63Cu and 17O nuclear relaxations despite the huge difference between the corresponding electronic and nuclear relaxation rates.
pacs:
74.72.-h, 76.75.+i, 74.25.Dw, 74.25.HaI INTRODUCTION
It is well known that in the high- superconductor YBa2Cu3Ox the substitution of yttrium by isovalent rare-earth (RE) ions, having local magnetic 4 moments, does not change the critical temperature considerably.Hor This makes it possible to use these local moments as useful paramagnetic probes of the electronic states within the CuO2 planes without seriously perturbing them. Relaxation of the RE magnetic moments provides important information about fluctuating electric and magnetic fields in cuprate superconductors. In the normal state, RE ions with non-zero orbital moment can interact with phonons, spin fluctuations and charge carriers. These interactions limit the life-time of the crystal field (CF) excitations and lead to broadening of the observed CF transitions. Inelastic neutron scattering (INS) is widely used to study the relaxation of the RE magnetic moments in cuprates superconductors by measuring the linewidths of the observed CF transitions.Mesot However, the mechanism of the relaxation of RE ions in cuprates is the issue of hot debates.Boothroyd1 ; Staub1 Most of the authors consider an interaction of 4 spins with charge carrier spins (Korringa mechanism) as a dominant channel of relaxation.Walter ; Amoretti ; Boothroyd2 ; Furrer Other authors, in opposite, conclude that the interactions of RE spins with charge carriers are negligible and that the interactions with lattice vibrations are only responsible for the relaxation behavior of the 4 spins in cuprates.Staub2 ; Staub3 ; Roepke At the moment there is no consensus on this subject and therefore it is important to disentangle the electronic and phononic sources of relaxation.
Relaxation of the 4 magnetic moments can be studied also by measuring the linewidth of the Electron Paramagnetic Resonance (EPR) signal of the RE ions.Barnes There have been a few EPR studies of the RE ions with non-zero orbital moment (Er and Yb) doped in cuprates.Elschner ; Eremin ; Kurkin ; Shimizu1 ; Shimizu2 ; Ivanshin1 ; Ivanshin2 ; Gafurov Again, the situation with EPR is similarly contradictory as in INS studies. Some groups observed both electronic (Korringa) and phononic (Orbach) contributions to EPR relaxation.Elschner ; Shimizu1 ; Shimizu2 While others conclude that the Korringa contribution is negligible and the interaction with lattice vibrations only is sufficient to explain the temperature dependence of the EPR linewidth in cuprates.Ivanshin1 ; Ivanshin2 ; Gafurov
In this work we report a detailed EPR study of the Yb3+ relaxation in YBa2Cu3Ox samples with oxygen content covering the whole doping range (). By measuring the temperature dependence of the Yb3+ EPR linewidth in a broad temperature range, it was found that both phononic and electronic mechanisms contribute to the relaxation. The electronic contribution decreases with decreasing oxygen content , while the phononic contribution is practically doping independent and has an exponential temperature dependence. In a sample with a maximum oxygen doping =6.98, the electronic part of the relaxation follows a Korringa law in the normal state, and a sharp drop of the relaxation rate is observed below . In the superconducting state the electronic part of the Yb3+ relaxation rate follows the same temperature dependence as 63Cu and 17O nuclear relaxations.
This paper is organized as follows: Sample preparation and experimental details are described in Sec. II. The EPR spectra and the procedure of their analysis are discussed in Sec. III. Sec. IV presents the temperature and doping dependence of the Yb3+ relaxation rate in the normal and superconducting states. In Sec. V we summarize our results and the conclusions of this study.
II Experimental details
The polycrystalline samples of Y1-yYbyBa2Cu3Ox were prepared by the standard solid state reaction by using Y2O3, Yb2O3, BaCO3 and CuO of a minimum purity of 99.99%. Appropriate amounts of starting reagents were mixed and calcinated at temperatures 800-920oC during at least 150 h in air, with several intermediate grindings. Finally, the as-prepared sample was oxidized in oxygen atmosphere (1 bar of O2) at 500oC. After the oxidation the sample had an oxygen content close to 7 (6.98). The required oxygen content in the samples was adjusted by gettering in a closed ampoule with metallic copper (850oC, 10 h; cooling 10oC/h). The oxygen content in the reduced samples was checked by comparing theoretical and real mass changes of the oxidized getter and the reduced sample. For all the samples phase purity was checked with a conventional X-ray diffractometer (SIEMENS D500).
The dilute level of the Yb doping (=0.02) was chosen in order to minimize broadening effects from Yb-Yb interactions and at the same time to obtain a sufficiently strong EPR signal. The EPR measurements were performed with an -band BRUKER EMX spectrometer equipped with an Oxford Instruments helium flow cryostat. In order to avoid a signal distortion due to skin effects, the samples were ground and the powder was suspended in epoxy. The -axes grain-orientation was obtained by placing the samples in a 9 T magnetic field until the epoxy hardened. As a result of the orientation procedure the -axes of the grains were preferentially aligned along the magnetic field direction.Farrell
EPR spectra were measured in five samples Y0.98Yb0.02Ba2Cu3Ox with =6.1, 6.4, 6.5, 6.6, 6.98 and critical temperatures of 0, 12(1), 51(1), 60(1), and 93(1) K, respectively. In addition, one Zn-doped sample Y0.98Yb0.02Ba2(Cu0.97Zn0.03)3O6.95 was measured with =57(1) K.


III Analysis of the ytterbium EPR spectra
In the YBa2Cu3Ox structure, the rare-earth site is eight-fold coordinated by oxygens lying in the CuO2 bilayers. Group theoretical considerations show that the eight-fold degeneracy of the ground-state multiplet 2F7/2 of the Yb3+ ions (4) is split by the crystal electric field of orthorhombic symmetry into four Kramers doublets.Bleaney Generally, this splitting is large enough so that only the lowest lying doublet is appreciably populated at low temperatures. In fact, inelastic neutron scattering measurements showed that in YbBa2Cu3O7 the first excited doublet lies 1000 K above the ground doublet.Guillaume So, EPR signals would be observed only for this doublet, which can be described in an effective = 1/2 notation.
Fig. 1(a) shows Yb3+ EPR spectra of Y0.98Yb0.02Ba2Cu3O6.4 at =40 K with the external magnetic field along and perpendicular to the crystal -axis. The spectra correspond to Yb3+ with an effective spin =1/2 with values =3.13(3) and =3.49(3). The average value =3.37 is close to =3.43 expected for the isolated ground doublet.Bleaney Fig.1(b) shows Yb3+ EPR spectra for the optimally doped sample =6.98 at =25 K. Note that the EPR line splits into two components for the orientation. This reflects the transition from tetragonal to orthorhombic crystal symmetry in YBa2Cu3Ox with increasing oxygen content. Enhanced noise seen in these spectra is related to the superconducting state. It is known that in the superconducting state the strong noise is generated due to vortex motion in the modulating magnetic field used in standard EPR spectrometers.
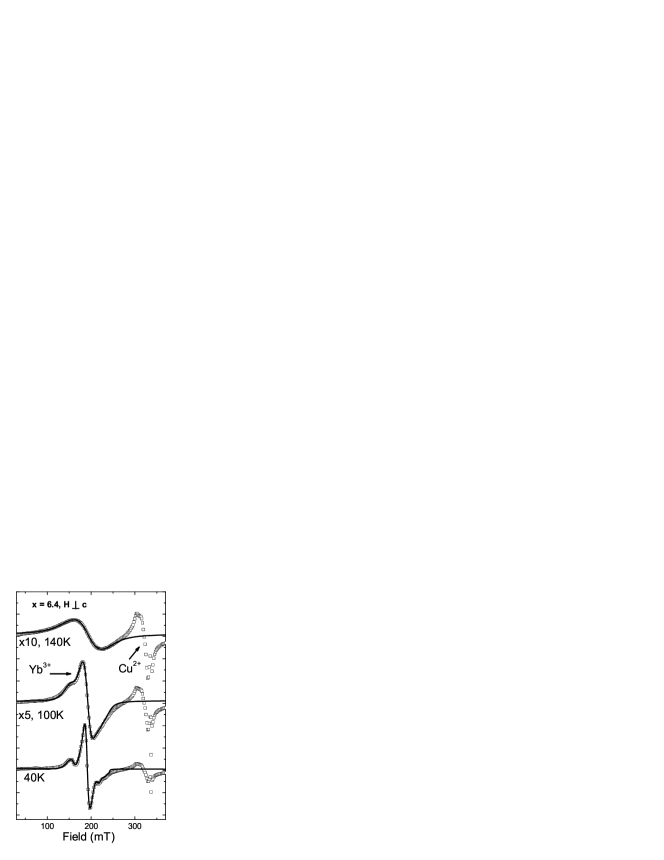
Fig. 2 shows typical EPR spectra for the =6.4 sample at different temperatures with the magnetic field applied perpendicular to the -axis. The EPR lines in the region are due to Cu2+ defect centers, which are always present in YBa2Cu3O6+x.Kochelaev The concentration of the Cu2+ defect centers in our samples correspond to 1-2% of the total copper content, as determined from the Cu2+ EPR signal intensity. The Yb3+ EPR spectrum at 40 K is rather complex, with a dominant central line and shoulders on each side. The shoulders are due to partially resolved hyperfine components. Natural ytterbium has 69% even-mass isotopes with nuclear spin =0, 14% 171Yb with =1/2, and 16% 173Yb with =5/2. Both odd isotopes give rise to nuclear hyperfine interactions. In Fig. 2 one can see that with increasing temperature the Yb3+ EPR line broadens and the multiple-line structure of the Yb spectra gradually merges into one line which continues to broaden with temperature. This broadening is due to the Yb relaxation and is the subject of the present study.
The observed line shape can be interpreted in the following way: a temperature-independent residual function due to inhomogeneous broadening which is further broadened by a temperature dependent relaxation. The method by which the relaxation-induced peak-to-peak derivative linewidth is extracted from the total peak-to-peak linewidth of the EPR signal depends upon the line shapes associated with inhomogeneous and homogeneous broadening mechanisms. The homogeneous broadening leads to Lorentzian line shape while the inhomogeneous low-temperature line shape is usually approximated as either Lorentzian or Gaussian. For a Lorentzian-Lorentzian convolution there is a simple relation : , where is a residual, temperature-independent linewidth. The result of a Lorentzian-Gaussian convolution is called a Voigt function, which cannot be expressed in closed form.
In our case the low-temperature line shape is neither Lorentzian nor Gaussian. The anisotropic nature of the Yb3+ signal, the partially resolved hyperfine structure, and the non-ideal grain alignment, make it very difficult to accurately model the complex shape of the Yb EPR spectra and its evolution with temperature. Therefore, in order to extract the linewidth related to relaxation, we used an approach similar to one used in inelastic neutron scattering studies of rare-earth relaxation in cuprates.Boothroyd2
The inhomogeneous broadening of an EPR line is due to the spread of the resonance frequencies of an assembly of electronic spins. The width of the single spin packet contributes to homogeneous broadening. This situation can be described by a convolution integral,Smirnov
| (1) |
where * is the convolution symbol, is the inhomogeneous line shape and is the resonance line profile of the spin packet given by a Lorentzian line function. EPR spectra are usually detected in the form of a first derivative, . In this case , where is the first derivative of a Lorentzian with amplitude , center at and the peak-to-peak width related with relaxation,
| (2) |
In order to describe the inhomogeneous line shape , we divided Yb EPR spectra in 120 points with a step of =1 mT in the interval of 120-240 mT. In this case an integral is replaced by a sum of 120 Lorentzians:
| (3) |
The residual function , characterizing the inhomogeneous line shape was obtained at low temperatures where relaxational broadening is negligible. We found that in all samples measured in the present work, except one Zn-doped sample, the relaxational broadening was absent below 40 K. Therefore, this temperature was used to determine the inhomogeneous line shape for samples without Zn doping. In Zn-doped sample the linewidth continues to decrease down to 15 K and therefore the inhomogeneous line shape was determined at this temperature. As an example, the line drawn through the 40 K data in Fig. 2 represents the residual function for =6.4 sample. Having established the residual function, we kept the coefficients fixed at all temperatures and fitted the data at high temperatures by convolving the residual function with the broadening function of Lorentzian shape. The center , width , and amplitude of the broadening function were the only variable parameters. The resulting fits are shown in Fig. 2.
IV Temperature and doping dependence of the ytterbium relaxation
IV.1 Yb3+ relaxation in the normal state
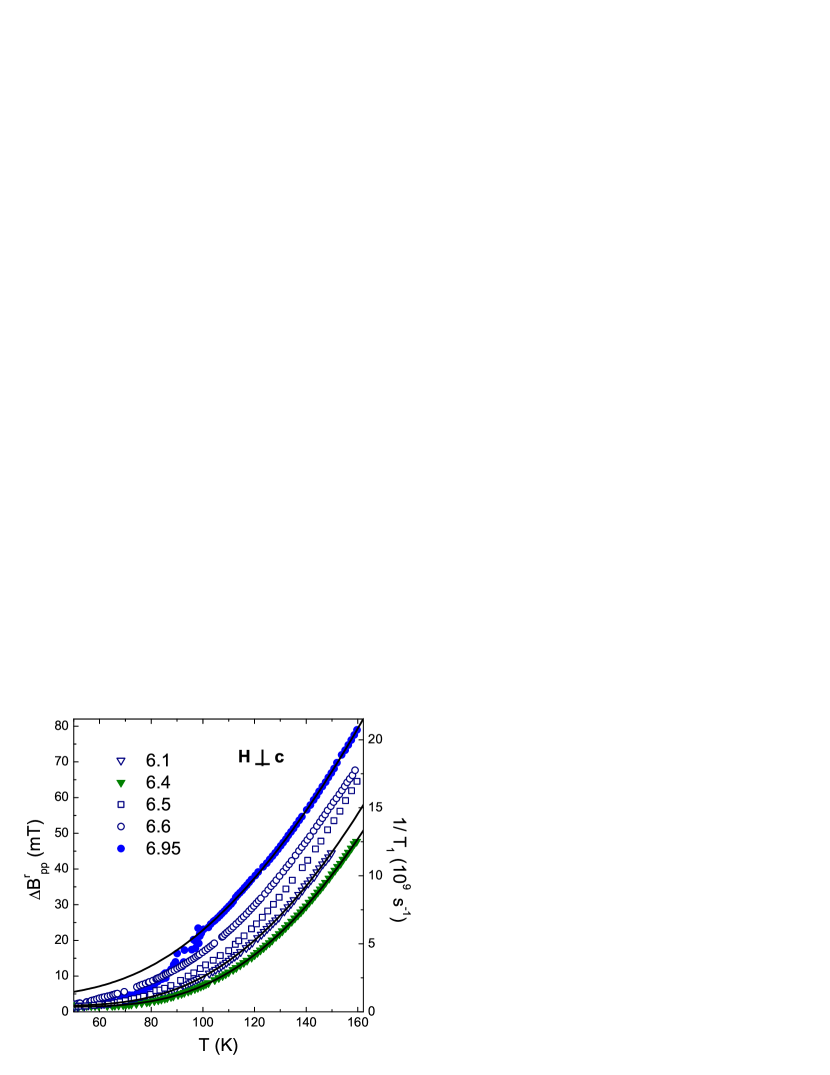
Figure 3 shows the temperature dependence of the peak-to-peak width related with relaxation and corresponding relaxation rate of Yb3+ in Y0.98Yb0.02Ba2Cu3Ox for different oxygen contents. In order to distinguish between electronic and phononic contributions to relaxation, let us first consider the sample with the lowest oxygen content (=6.1). One can see in Fig. 3 that in this sample, which is antiferromagnetic and insulating with practically no charge carriers, the relaxation rate is comparable to those of samples with much higher oxygen contents. Consequently, this suggests that the phonon contribution to the rare-earth relaxation rate is significant at all oxygen doping levels, since in the x=6.1 sample the electronic contribution is expected to be negligible.
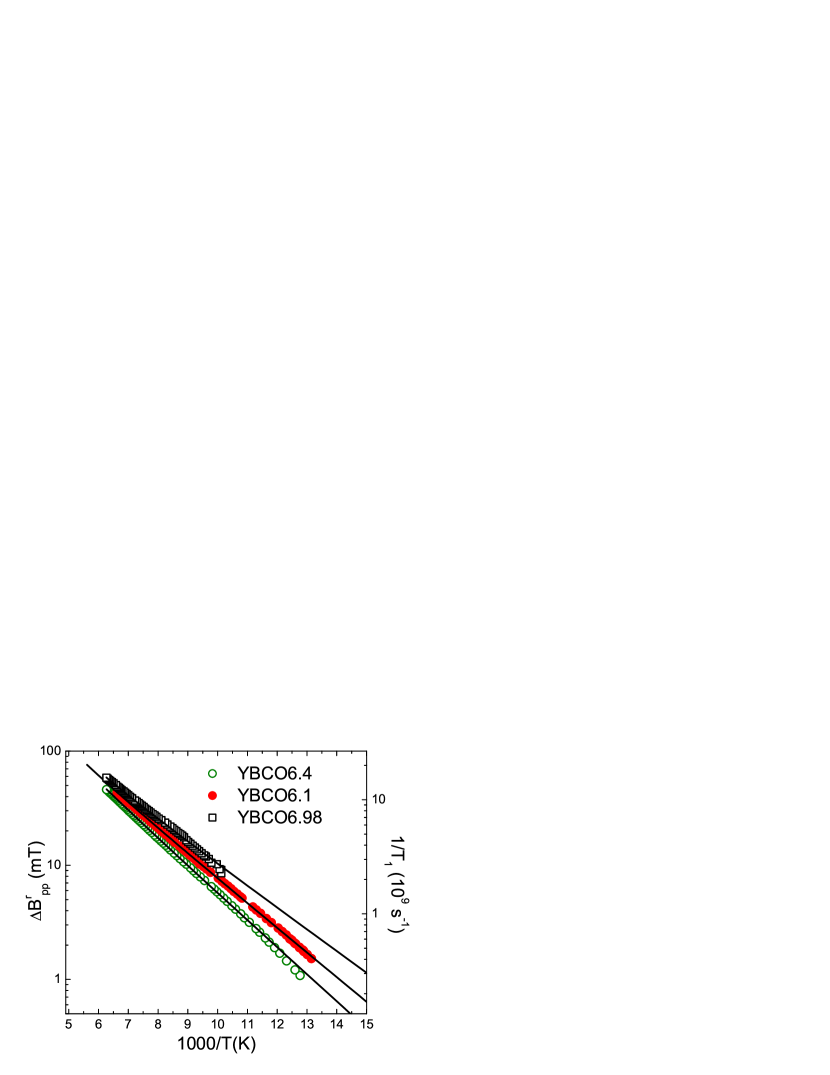
We observed that the temperature dependence of the relaxation rate follows closely the exponential function with =520(30) K and 570(30) K, for =6.1 and 6.4 respectively. This is demonstrated in Fig. 4, where the relaxation rates as a function of inverse temperature are plotted on a semi-logarithmic scale. Such an exponential dependence is expected for the Orbach relaxation process via an excited intermediate energy level.Orbach In this case corresponds to the separation between the ground state doublet and the excited level. According to inelastic neutron scattering experiments the first excited energy level of Yb in YBa2Cu3O7 is about 1000 K above the ground state doublet.Guillaume Since there is no excited crystal field energy level with 500 K, the traditional Orbach relaxation mechanism can be excluded.
An exponential temperature dependence of the relaxation rate is also expected for the Raman two-phonon process involving optical phonons or local vibrations.Kochelaev1 ; Huang In this case the relaxation rate is
| (5) |
where is the optical phonon frequency.Kochelaev1 ; Huang The solid lines in Fig. 4 represent a best fit to the data using Eq.(5). It is obvious that the Raman process involving optical phonons can explain the phonon contribution to the Yb3+ spin-lattice relaxation. Optical phonons within the energy range 500(50) K exist in YBa2Cu3Ox. These are: (i) the in-plane bond-bending (500-560 K) and (ii) the out of plane (470 K) phonons.Pintschovius Theoretical calculations are necessary in order to determine which of the two optical phonon modes (in-plane bond-bending or out of plane ) mostly contributes to Yb3+ spin-lattice relaxation.
It is interesting to note that an exponential temperature dependence of the spin relaxation rate was observed in a previous EPR study of crystals containing Jahn-Teller (JT) transition metal ions.Muller1 ; Muller2 In this case relaxation takes place due to an Orbach-like process via the excited vibronic levels of the JT ion (localized Slonczewski-modes).Muller3 In our case such a scenario is also possible if Yb3+ spin relaxation occurs due to coupling to the vibrations of surrounding CuO6 complexes, since Cu2+ is a strong JT ion. There are no reports on JT splitting of Cu2+ in SrTiO3 or similar perovskites, but in MgO and CaO it is approximately 1500 K, Muller2 which is much larger than 500 K found in the present work. However, it was observed that for Ni3+ the JT splitting in SrTiO3 is 2-4 times reduced compared to MgO, CaO or Al2O3.Muller2 A similar reduction of the JT splitting can be expected also for Cu2+ in perovskites. In addition, in cuprates the Cu2+ ions are situated next to each other. In such a cooperative situation the energy of the Slonczewski mode will be lower compared to the isolated Cu2+ ions. It would be interesting to search for localized vibronic modes in cuprates using inelastic neutron scattering.
For an oxygen content , Eq.(5) cannot describe the relaxation data well, and it was necessary to take into account the Korringa relaxation mechanism where localized Yb3+ moments couple to mobile charge carriers in the CuO2 planes through an exchange interaction. In normal metals the Korringa relaxation has a linear temperature dependence .Barnes The parameter is proportional to the product , where is the exchange integral between Yb3+ moments and holes, and is the density of states at the Fermi energy. In underdoped cuprates the density of states at the Fermi level is temperature dependent due to the pseudogap opening. This leads to the nonlinear temperature dependence of the relaxation rate as demonstrated by 89Y NMRAlloul and Gd EPRJanossy experiments in YBa2Cu3Ox. No exact formula exists to describe this nonlinear temperature dependence. Therefore we did not fit the data for underdoped samples (). However, the use of the Korringa law is justified in our optimally doped sample , where the pseudogap is absent.Alloul The solid lines in Fig. 3 correspond to fits of the data using a sum of phononic and electronic contributions:
| (6) |
| (K) | (G) | (K) | (G/K) | |
|---|---|---|---|---|
| 6.1 | - | 10800(500) | 500(30) | 0 |
| 6.4 | 12(1) | 13190(500) | 540(30) | 0 |
| 6.98 | 93(1) | 9090(400) | 460(30) | 1.27(10) |
| 6.95(Zn) | 57(1) | 10160(400) | 490(30) | 1.27(10) |
The obtained parameters , , and are summarized in Table I. It is interesting to compare the value of the Korringa constant =1.27(10) G/K for with the values obtained from EPR measurements of Gd-doped YBa2Cu3Ox. In contrast to Yb3+, the Gd3+ ion has zero orbital moment (=0) and interacts very weakly with lattice vibrations. Therefore, the Korringa relaxation due to interaction with charge carriers is the dominant process and the Korringa constant can be obtained directly from the temperature dependence of the EPR linewidth. Indeed, EPR measurements on a Gd-doped EuBa2Cu3O6.85 single crystalShaltiel showed a linear broadening of the EPR line in the temperature range 90-300 K with the Korringa constant =0.5 G/K. This value of is comparable, but smaller than our value of . This is expected due to the smaller oxygen content () and consequently smaller density of states at the Fermi level compared to our sample ().
The comparable values of Korringa constants for Gd3+ and Yb3+ in YBCO shows that they have similar exchange coupling with charge carriers. The observed Korringa constants of RE ions in YBCO are at least one order of magnitude smaller than the corresponding quantities found for RE ions in conventional metals.Barnes The small value of for RE ions in YBa2Cu3Ox is due to the weak coupling between the RE moments and the holes in the CuO2 planes. This explains naturally the small effect of RE magnetic moments on in YBa2Cu3Ox.Garifullin
IV.2 Yb3+ relaxation in the superconducting state
Generally, it is difficult to measure EPR in the superconducting state because of the strong microwave absorption and the noise due to vortex motion in the modulating magnetic field used in standard EPR spectrometers. Nevertheless, in grain-aligned samples with small grain size it was possible to observe an Yb3+ EPR signal below (see Fig. 1(b)). This allowed us to study the temperature dependence of the Yb3+ relaxation in the superconducting state. We observed a strong reduction of the Yb3+ relaxation rate below . This is clearly seen in Fig. 3 for , where the relaxation rate falls below the theoretical line given by Eq. (6). It is natural to attribute the drop of the relaxation to the opening of the superconducting gap.
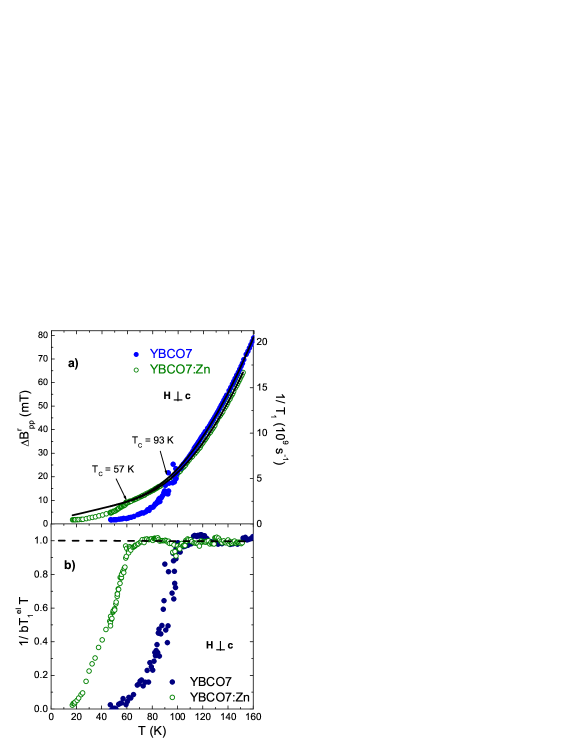
In order to check this possibility, we measured the relaxation of Yb3+ in Y0.98Yb0.02Ba2(Cu0.97Zn0.03)3O6.95 where Zn doping reduces to 57 K. Fig. 5(a) shows the temperature dependence of the peak-to-peak width related with relaxation and corresponding relaxation rate in samples with and without Zn doping. It is expected that 3% Zn doping should not change strongly the phonon spectra and the electronic density of states. In fact, above 90 K the relaxation rates are very close for both samples. However, below 90 K the behavior of relaxation is different. While the relaxation rate of the sample without Zn doping sharply decreases below this temperature due to the onset of superconductivity, in the Zn-doped sample relaxation continues to decrease gradually until =57 K, where a similar sharp turn is observed. This result unambiguously shows that the superconducting gap opening is responsible for the drop of Yb3+ relaxation in YBa2Cu3O6.98. Moreover, it proves the presence of the electronic channel of relaxation described by the Korringa term in Eq. (6). Zn doping helps to reveal the Korringa term, which is masked at high temperatures by phonon relaxation due to the much stronger temperature dependence, and below by opening of the superconducting gap. Figure 5(b) shows the electronic part of the Yb3+ relaxation after subtracting the phonon contribution in pure and Zn-doped samples. The linear temperature dependence in the normal state and a sharp decrease below is clearly seen.
In superconducting samples at low temperatures extra broadening could be present due to the distribution of the diamagnetic shifts related to the irregular shape of the powder grains. However, we observed no additional broadening even in optimally doped superconducting sample down to 40 K. In fact, the superconducting and nonsuperconducting samples had the same inhomogeneous linewidth at this temperature. This is in agreement with the estimations of the diamagnetic shift 3 mT at 10 K in Hc orientation in YBa2Cu3O7, which further decreases with increasing temperature.Janossy Therefore, extra broadening from the distribution of this diamagnetic shift in our optimally doped sample at 40 K is estimated to be about 1 mT, which is much smaller than the observed inhomogeneous linewidth =11 mT.
It is expected that the electronic part of the relaxation of the 4 magnetic moments on the yttrium site in YBCO measured by EPR has the same temperature dependence as 89Y nuclear relaxation, since in both cases the relaxation is proportional to the imaginary part of the dynamic spin susceptibility.Kochelaev-Review This was confirmed by EPR measurements of Gd3+ spin relaxation in YBa2Cu3Ox in normal state.Janossy ; Atsarkin Also, in the present work, the electronic part of the Yb3+ spin relaxation in optimally doped YBCO above shows a linear temperature dependence (Korringa behavior) like 89Y nuclear relaxation.Alloul Note, however, that there is a huge difference between the magnitudes (more than a factor 109) of the electron and nuclear relaxation rates due to the large difference between the corresponding coupling constants.
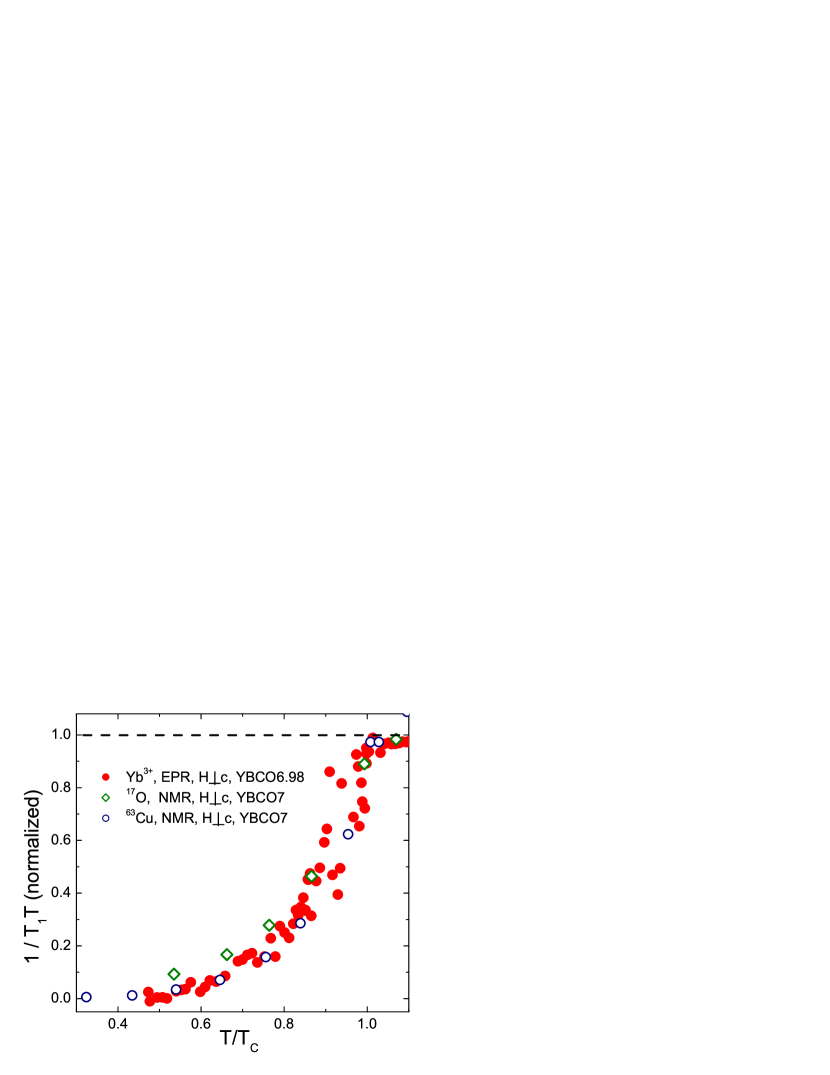
It would be interesting to compare the temperature dependences of the electron and nuclear spin relaxation rates on the yttrium site in the superconducting state, where relaxation drops due to the opening of the superconducting gap. Unfortunately, no detailed 89Y nuclear relaxation data exists for YBa2Cu3Ox in the superconducting state. A very small coupling between the yttrium nuclei and the charge carriers leads to very long relaxation times and makes 89Y NMR measurements in the superconducting state extremely difficult. Therefore, we plot in Fig. 6 the electronic part of versus reduced temperature for Yb3+ in =6.98 sample together with the corresponding quantities from NMR measurements for 17O and 63Cu nuclei in YBa2Cu3O7.O-NMR ; Cu-NMR The relaxation rates are plotted for orientation and 63Cu NMR relaxation data is plotted for weak magnetic field =0.45 T where the fluxoid core contribution to relaxation is small.Cu-NMR The electron and nuclear relaxation rates were normalized to their values above at T=100 K. As is evident from Fig. 6, shows a very similar temperature dependence for the Yb3+ electronic spins and the 63Cu and 17O nuclei.
Previously, the relaxation rate of Yb3+ in the superconducting state of optimally doped YBa2Cu3O7 was extracted from 170Yb Mössbauer spectra.Hodges The temperature dependence of was followed only up to 90 K limited by the decrease in the intensity of the Mössbauer effect. Therefore, a sharp decrease of the relaxation rate at transition from normal to superconducting state was not observed. Nevertheless, it is interesting to compare the absolute values of the relaxation rates of Yb3+ obtained by Mössbauer and EPR techniques. Such a comparison is shown in Table II. The excellent quantitative agreement of the relaxation rates obtained by two different experimental techniques is remarkable and provides strong support of the methods of extracting relaxation rates from Mössbauer spectroscopyHodges and from EPR spectra presented in this work.
| (K) | (109 s-1) | (109 s-1) |
|---|---|---|
| 60 | 0.5(1) | 0.6(1) |
| 70 | 1.3(1) | 1.2(1) |
| 80 | 2.5(1) | 1.8(1) |
| 90 | 4.0(1) | 4.4(1) |
Relaxation measurements at low temperatures () can provide information about the superconducting gap symmetry.Asayama However, in the present EPR experiments we could not detect relaxation broadening at , since it becomes much smaller than the inhomogeneous residual linewidth. This prevents a reliable measurement of the relaxation rate below . It is expected that at low temperatures in the superconducting state the Yb3+ relaxation rate will decrease below 107 s-1. In this case can be measured directly using the pulse EPR techniques. It would be interesting to perform such experiments at low temperatures.
V Summary and Conclusions
To summarize, we performed a detailed study of the temperature dependence of the Yb3+ EPR linewidth, i.e., the relaxation in YBa2Cu3Ox from the undoped insulating to the optimally doped superconducting region (). It was found that both electronic and phononic processes contribute to Yb3+ relaxation. We were able to separate these processes and studied their relative contributions to relaxation as a function of oxygen doping. As expected, the electronic contribution decreases with decreasing oxygen doping, while the phonon contribution is practically doping independent. It was found that the phononic part of relaxation has an exponential temperature dependence, which cannot be explained by a traditional mechanism involving acoustic phonons. Instead, a Raman process via the coupling to high-energy (500 K) optical phonons or an Orbach-like process via the excited vibronic levels of the Cu2+ ions (localized Slonczewski-modes) is responsible for the phononic part of the Yb3+ relaxation in YBa2Cu3O6+x.
In a sample with maximum oxygen doping , the electronic part of relaxation follows the Korringa law in the normal state, and a sharp drop of the relaxation rate was observed below . Comparison of the EPR linewidths in samples with and without Zn doping allowed us to prove that the superconducting gap opening is responsible for the sharp decrease of Yb3+ relaxation in YBa2Cu3O6.98. It was shown that the electronic part of the Yb3+ relaxation rate in the superconducting state follows a very similar temperature dependence as the 63Cu and the 17O nuclear relaxation rates, despite the huge difference between the corresponding electronic and nuclear relaxation rates.
There is an excellent quantitative agreement between relaxation rates of Yb3+ in YBa2Cu3O7 obtained previously by Mössbauer spectroscopy and in the present work by EPR. This provides strong support of the methods of extracting relaxation rates from Mössbauer spectroscopy and from EPR spectra. One should note however, that the EPR signal from Yb3+ in YBa2Cu3Ox can be followed up to at least 160 K, while Mössbauer measurements in the same compound using 170Yb are limited by 90 K due to the decrease in the intensity of the Mössbauer effect with temperature.
The present results demonstrate that Yb3+ can serve as a very effective microscopic spin probe to study electronic, magnetic and lattice properties of YBa2Cu3Ox.
VI Acknowledgments
This work was supported by the Swiss National Science Foundation, the SCOPES grant No. IB7420-110784, and the NCCR program MaNEP.
References
- (1) P.H. Hor, R.L. Meng, Y.Q. Wang, L. Gao, Z.J. Huang, J. Bechtold, K. Forster, and C.W. Chu, Phys. Rev. Lett. 58, 1891 (1987).
- (2) J. Mesot and A. Furrer, J. Supercond. 10, 623 (1997).
- (3) A.T. Boothroyd, Phys. Rev. B 64, 066501 (2001).
- (4) S.W. Lovesey and U. Staub, Phys. Rev. B 64, 066502 (2001).
- (5) U. Walter, S. Fahy, A. Zettl, S.G. Louie, M.L. Cohen, P. Tejedor, and A.M. Stacy, Phys. Rev. B 36, 8899 (1987).
- (6) G. Amoretti, R. Caciuffo, P. Santini, O. Francescangeli, E.A. Goremychkin, R. Osborn, G. Calestani, M. Sparpaglione, and L. Bonoldi, Physica C 221, 227 (1994).
- (7) A. Mukherjee, A.T. Boothroyd, D. MK. Paul, M. P. Sridhar Kumar, and M. A. Adams, Phys. Rev. B 49, 13089 (1994); A.T. Boothroyd, A. Mukherjee, and A.P. Murani, Phys. Rev. Lett. 77, 1600 (1996).
- (8) J. Mesot, G. Böttger, H. Mutka, and A. Furrer, Europhys. Lett. 44, 498 (1998).
- (9) U. Staub, M. Gutmann, F. Fauth, and W. Kagunya, J. Phys.: Condens. Matter 11, L59 (1999).
- (10) S.W. Lovesey and U. Staub, Phys. Rev. B 61, 9130 (2000).
- (11) M. Roepke, E. Holland-Moritz, B. Büchner, H. Berg, R.E. Lechner, S. Longeville, J. Fitter, R. Kahn, G. Coddens, and M. Ferrand, Phys. Rev. B 60, 9793 (1999).
- (12) S.E. Barnes, Adv. Phys. 30, 801 (1981).
- (13) L. Kan, S. Elschner, and B. Elschner, Solid State Commun. 79, 61 (1991).
- (14) M.V. Eremin, I.N. Kurkin, M.P. Rodionova, I.H. Salikhov, and L.R. Tagirov, Supercond. Phys. Chem. Techn. (Russia) 4, 716 (1991).
- (15) I.N. Kurkin, I.Kh. Salikhov, L.L. Sedov, M.A. Teplov, and R.Sh. Zhdanov, JETP 76, 657 (1993).
- (16) H. Shimizu, K. Fujiwara, and K. Hatada, Physica C 288, 190 (1997).
- (17) H. Shimizu, K. Fujiwara, and K. Hatada, Physica C 299, 169 (1998).
- (18) V.A. Ivanshin, M.R. Gafurov, I.N. Kurkin, S.P. Kurzin, A. Shengelaya, H. Keller, and M. Gutmann, Physica C 307, 61 (1998).
- (19) L.K. Aminov, V.A. Ivanshin, I.N. Kurkin, M.R. Gafurov, I.Kh. Salikhov, H. Keller, and M. Gutmann, Physica C 349, 30 (2001).
- (20) M.R. Gafurov, L.K. Aminov, I.N. Kurkin, and V.V. Izotov, Supercond. Sci. Technol. 18, 352 (2005).
- (21) D.E. Farrell, B.S. Chandrasekhar, M.R. DeGuire, M.M. Fang, V.G. Kogan, J.R. Clem, and D.K. Finnemore, Phys. Rev. B 36, 4025 (1987).
- (22) A. Abragam and B. Bleaney, Electron Paramagnetic Resonance of Transition Ions (Clarendon Press, Oxford, 1970).
- (23) M. Guillaume, P. Allenspach, J. Mesot, U. Staub, A. Furrer, R. Osborn, A.D. Taylor, F. Stucki, and P. Unternährer, Solid State Commun. 81, 999 (1992).
- (24) J. Sichelschmidt, B. Elschner, A. Loidl, and B.I. Kochelaev, Phys. Rev. B 51, 9199 (1995).
- (25) A. I. Smirnov and R. L. Belford, J. Magn. Reson. A 113, 65 (1995).
- (26) Gh. Cristea, T. L. Bohan, and H. J. Stapleton, Phys. Rev. B 4, 2081 (1971).
- (27) V.A. Atsarkin, V.V. Demidov, G.A. Vasneva, T. Feher, A. Jánossy, and B. Dabrowski, Phys. Rev. B 61, R14944 (2000).
- (28) S.A. Dodds, J. Sanny, and R. Orbach, Phys. Rev. B 18, 1016 (1978).
- (29) B.I. Kochelaev, JETP 10, 171 (1960).
- (30) Chao-Yuan Huang, Phys. Rev. 154, 215 (1967).
- (31) L. Pintschovius, W. Reichardt, M. Klaser, T. Wolf, and H.V. Lohneysen, Phys. Rev. Lett. 89, 037001 (2002); M. Opel, R. Hackl, T.P. Devereaux, A. Virosztek, A. Zawadowski, A. Erb, E. Walker, H. Berger, and L. Forro, Phys. Rev. B 60, 9836 (1999).
- (32) U. Höchli and K.A. Müller, Phys. Rev. Lett. 12, 730 (1964).
- (33) U. Höchli, K.A. Müller, and P. Wysling, Phys. Lett. 15, 1 (1965).
- (34) K.A. Müller, in Magnetic Resonance and Relaxation, edited by R. Blinc (North-Holland Publishing Company, 1967), pp. 192-208.
- (35) H. Alloul, T. Ohno, and P. Mendels, Phys. Rev. Lett. 63, 1700 (1989).
- (36) A. Jánossy, L.C. Brunel, and J.R. Cooper, Phys. Rev. B 54, 10186 (1996).
- (37) D. Shaltiel, C. Noble, J. Pilbrow, D. Hutton, and E. Walker, Phys. Rev. B 53, 12430 (1996).
- (38) N.E. Alekseevskii, A.V. Mitin, V.I. Nizhankovskii, I.A. Garifullin, N.N. Garifyanov, G.G. Khaliullin, E.P. Khlybov, B.I. Kochelaev, and L.R. Tagirov, J. Low Temp. Phys. 77, 87 (1989).
- (39) B.I. Kochelaev and G.B. Teitelbaum, in Superconductivity in Complex Systems, (Springer, 2005), pp. 205-266.
- (40) V.A. Atsarkin, V.V. Demidov, and G.A. Vasneva, Phys. Rev. B 52, 1290 (1995).
- (41) J. A. Martindale, P.C. Hammel, W. L. Hults, and J. L. Smith, Phys. Rev. B 57, 11769 (1998).
- (42) J. A. Martindale, S. E. Barrett, C. A. Klug, K. E. O’Hara, S. M. DeSoto, C. P. Slichter, T. A. Friedman, and D. M. Ginsberg, Phys. Rev. Lett. 68, 702 (1992).
- (43) J. A. Hodges, P. Bonville, P. Imbert, and G. Jéhanno, Physica C 184, 259 (1991).
- (44) For a review see, K. Asayama, Y. Kitaoka, G.Q. Zheng, and K. Ishida, Prog. Nucl. Magn. Reson. Spectrosc. 87, 221 (1996).