Dynamics of crater formations in immersed granular materials
Abstract
We report the formation of a crater at the free surface of an immersed granular bed, locally crossed by an ascending gas flow. In two dimensions, the crater consists of two piles which develop around the location of the gas emission. We observe that the typical size of the crater increases logarithmically with time, independently of the gas emission dynamics. We describe the related granular flows and give an account of the influence of the experimental parameters, especially of the grain size and of the gas flow.
pacs:
83.80.Fg : Granular materials, rheology, 47.57.Gc : Granular flow, complex fluid, 47.85.Dh : Hydrodynamics, applied fluid mechanicsI Introduction
Craters are part of the widespread phenomena observed in nature, going from impact meteorite craters to volcanic structures. Studies of crater morphologies have a wide range of applications, going from puzzling crater formation in drying paint Evans00 to molecular dynamics Insepov03 ; Yamaguchi03 ; Aoki05 . Among the main applications to natural phenomena, aside from meteorite impact crater, are the formation and growth of volcanic edifices, by successive ejecta emplacement and/or erosion. The time evolution and dynamics play a crucial role here, as the competition between volcanic-jet mass-flux (degassing and ejecta) and crater-size evolution may control directly the eruptive regime Woods95 . Attempts have been made to model the talus development of volcanic caldera through erosion Obanawa08 , or to constrain the morphology and dynamics of pyroclastic constructs via granular-heap drainage laboratory experiments Riedel03 .
Crater morphology in dry granular material has been extensively studied, both experimentally and theoretically Grasselli01 ; Uehara03 ; Lohse04 ; Zheng04 ; Wada06 ; deVet07 . Most of these studies investigate the final, steady, crater shape resulting from the collision of solid bodies with the material surface and scaling laws are derived Walsh03 . Note however that some authors also reported experimental study of the crater formation dynamics, including growth and collapse after impact, in the ”single impacting body” configuration Boudet06 ; Yamamoto06 . In a recent work, Wu et al. have extended these studies to a particles stream impacting a dry granular bed Wu07 .
In immersed granular material, one reports craters generated by an underwater vortex ring Suzuki07 , involving fluidized ejecta dynamics, or underwater impact craters generated by landslide Fritz03 . Craters in immersed granular materials can result either from two-phase or three-phase flows. In particular, water or gas flowing through an immersed granular bed can induce localized instabilities and fluidization Rigord05 ; Zoueshtiagh07 , which eventually leads to the formation of craters at the free surface.
In a previous experimental study, Gostiaux et al. Gostiaux02 have investigated the dynamics of air flowing through an immersed granular layer. They reported that, depending on the flow rate, the system exhibits two qualitatively different regimes: At small flow rate, the bubbling regime during which bubbles escape the granular layer quite independently one from another; At large flow rate, the open-channel regime which corresponds to the formation of a channel crossing the whole thickness of the granular bed through which air escapes almost continuously. At intermediate flow rate, a spontaneous alternation between these two regimes is observed. Interestingly, they noticed the appearance of a crater around the locus of air release but did not provide any extensive study of its formation dynamics. Here, we extend these seminal observations to a quantitative study of the resulting deformation of the free surface of the granular bed. To do so, we reproduce the previous experimental conditions in two dimensions: In a vertical Hele-Shaw cell, the crater is then formed by two sand piles which grow and move away from each other as time passes by. By monitoring the evolution ot the free surface through time, we investigate the effect of the different gas flow regimes on the crater dynamics. The results point out a grain-transport mechanism that differs significantly from the one involved in dry-sand dune motion Bagnold ; Kroy ; Andreotti ; Hersen .
II Experimental setup and protocol
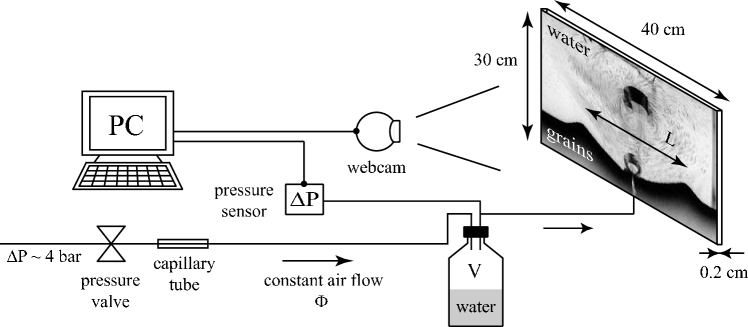
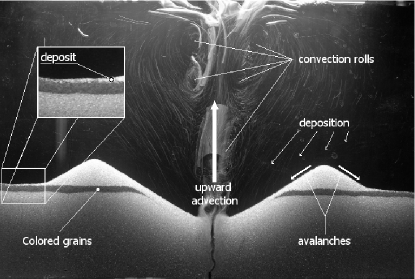
The principle of the experiment is to force air, injected locally at the base of an immersed granular bed, to flow vertically across the material. The experimental setup thus consists in a 2-mm-thin vertical-cell containing the grains and water (Fig. 1). The two vertical walls (glass plates) are 40 cm wide and 30 cm high.
The air injection is assured by a system similar to that used in Gostiaux02 : Air is injected, at a constant flow rate, in a chamber connected to the bottom of the cell. In practice, a small hole (diameter 1 mm) connects, at the center, the bottom of the vertical cell to the chamber, partially filled with water in order to tune the inner gaseous volume . The air flow is controlled thanks to a reducing valve which maintains a constant overpressure at the entrance of a capillary tube: Provided that the pressure drop in the capillary tube is much larger than the fluctuations of the pressure inside the chamber, the air flow toward the chamber is not significantly altered by the dynamics of the granular layer and remains constant. The flow rate (ranging from 1.5 mL/s to 4.3 mL/s) is tuned by changing either the capillary tube (rough) or the pressure difference imposed by the reducing valve (fine) and is subsequently measured (to within 0.1 mL/s) by means of a home-made flow meter. A sensor (MKS Instruments, 223 BD-00010 AB), connected to an acquisition board (National Instruments, PCI-6251), monitors the pressure difference, (to within 10 Pa), between the chamber and the outside atmosphere.
In order to account for the dynamics of the free surface, we image the system from the side. In a first configuration, a transparency flat viewer (Just NormLicht, Classic Line) located behind the cell is used to achieve a homogeneous lighting of the whole bed which is imaged with the help of a Webcam (Logitech, QuickCam Express) connected to a PC. A small software (Astra Image Webcam Video Grabber) makes it possible to take one image of the system every 10 seconds and, thus, to record the dynamics during several hours (typically 24 hours). In a second configuration, in order to observe the motion of the grains, we light up the sample from top with a linear light source (Polytec, DCR3) and take pictures with a high-resolution digital-camera (Nikon, D200).
Initially, is set to zero. Grains and water are introduced in the cell. The grains consist of spherical glass-beads (USF Matrasur, sodosilicate glass) that are sieved in order to control their size (typical diameters, 100–125 or 400–500 m). Initially, after sedimentation, the grains sit at the bottom and we make use of a thin rod to level the immersed granular layer. We denote the height of grains above the bottom of the container and , that of the water free surface above the granular bed.
The initial condition consists thus in a horizontal and flat layer of grains. After the opening of the valve, one observes that air is creating several paths between the hole at the bottom and the free surface of the granular bed. During this transient regime, some air channels merge, or cannot reach the upper layer of grains (In this case, air bubbles remain trapped within the granular layer.) After several minutes, air crosses the granular bed along the vertical and bubbles are emitted in the water from an almost fixed position. Then, through time, a crater forms, the two piles on both sides growing and moving apart one from the other (see Fig. 1).
III Results
We shall report the dynamics of the crater formation in regard to the gas flow regimes. First, we shall describe qualitatively the gas flow regimes (Sec. III.1.1) and the associated mechanisms of the gas emission at the free surface (Sec. III.1.2). Then, we shall describe qualitatively the crater formation (Sec. III.1.3) and make use of these first observations to estimate the profile of the grain deposition. We shall also discuss the effects of the finite depth of the granular bed and of the finite water height (Sec. III.1.4). We finally quantitatively study the influence of the gas flux (Sec. III.2.1) and of the grain size (Sec. III.2.2).
III.1 Qualitative observations.
III.1.1 Gas flow regimes
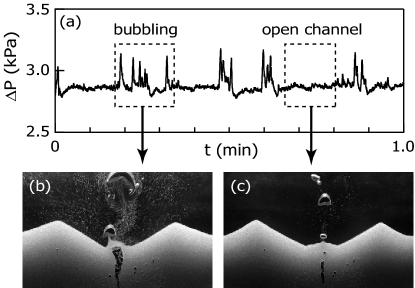
As already reported Gostiaux02 , depending on the flow rate , two main regimes of the air flowing through the granular layer are observed. (The existence of the two regimes and the transition between them are tightly related to the non-Newtonian rheology of the granular material as proven by an experimental study conducted in another non-Newtonian material Divoux08 .) On the one hand, the bubbling regime, which is typically observed at small , is characterized by a regular emission of successive bubbles, independent from one another. In this regime, the pressure signal exhibits successive rises and drops, the latter being associated with bubble emissions from the injector at the base of the granular layer. On the other hand, in the open-channel regime, which is typically observed at large , the system sustains a continuous air-flow through a channel crossing the whole granular layer. The overpressure associated with this continuous air emission is almost constant. In an intermediate range of , one observes a spontaneous alternation between the two regimes: The channel forms after the emission of several bubbles and subsequently spontaneously pinches off after a finite time, leading the system back to the bubbling regime. As a consequence, activity and rest periods are observed in the pressure signal [Fig. 2(a)]. The phenomenon is explained by the ability of the material to sustain a stable channel thanks to its peculiar rheology. At last, we point out that the deformation of the free surface of the granular bed does not seem to alter the gas flow process: It has been previously shown that the gas emission is mainly governed by local events occuring close to the free surface Gostiaux02 .
III.1.2 Bubble emission mechanisms
A close look at the free surface of the granular bed points out two different air-release mechanisms associated with the bubbling and open-channel regimes, respectively. In the bubbling regime, a gas bubble, while growing underneath the free surface, pushes up a thin layer of grains which forms the bubble head. Once it has crossed the interface, the bubble, while it rises up in the water, advects the grains in its wake [Fig. 2(b)]. In the open-channel regime, the air is released continuously through the channel whose walls remain at rest. The grains are advected upwards, from the free surface, by the water flow behind the small ascending gas bubbles [Fig. 2(c)]. From these observations, one could wonder about the relative efficiency of the two regimes in forming the crater. In particular, one could expect the bubbling regime to lead to a faster growth because the explosive bursting of the bubble apparently lifts a larger quantity of grains. In Sec. III.2, in order to answer the question, we shall report a quantitative study of the crater growth in large range of .
III.1.3 Geometrical description of the crater
The ejection of the grains from the free surface and the subsequent deposition of the granular ejecta lead to the rapid formation of a crater, which is formed by two granular piles symmetrically positioned on each flank. Due to the permanent grain transport, the crater grows: The piles height increases while they move symmetrically away from the center (Fig. 3).
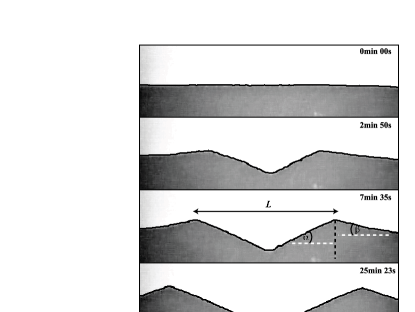
Before reporting quantitative measurements of the crater dynamics, let us mention some qualitative features of the crater formation. First, let us denote and the maximum angles that the piles make with the horizontal, respectively, inside and outside the crater. From direct observation [Fig. 3], one can notice immediately that and can differ significantly, especially at the early stages of the crater formation [Fig. 4(a)]. We note that the inner flanks of the crater are almost straight and that (about 28∘) remains constant during the whole crater growth. In contrast, the outer slopes are not straight, especially at the early stages of the crater formation, and evolves in time.
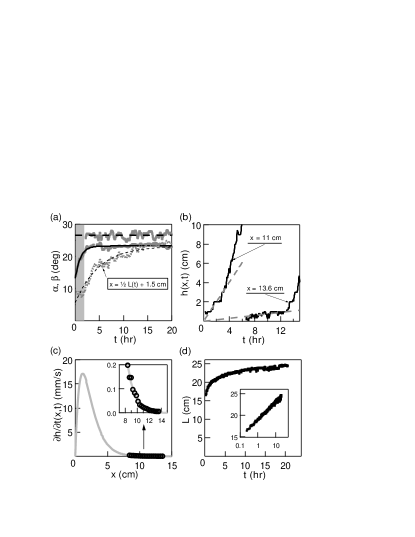
This behavior can be qualitatively accounted for by considering the grain flows (Fig. 5). Once lifted up by liquid flow, the grains are pushed away from the center by the liquid flow which mainly consists of two large convective rolls and then, subjected to gravity, deposit back onto the free surface at finite distance from the center. If the local slope is smaller than the angle of avalanche the grains do not move anymore once deposited. To the contrary, if the local slope is larger than the angle of avalanche, the grains flow downwards along the slope. At the center the grains are very locally torn off from the surface by the upward liquid flow. The local slope almost immediately exceeds the angle of avalanche and grains flow downwards on both inner flanks to replace the granular material missing at the center. Thus, if a grain deposits onto the inner flank, it flows downwards toward the center, which again explains why remains almost constant and only fluctuates between the angle of repose and the angle of avalanche [Fig. 4(a)]. In constrast, at the early stages of the crater formation, the outer flanks only result from the deposition of the granular material. The local slope of the outer flank being everywhere smaller than the angle of avalanche, a grain, once deposited, does not move anymore. However, at a finite time , reaches the value of the angle of avalanche, which results in surface flows along the outer flank. As a consequence, evolves in time [Fig. 4(a)] : Starting from a small value at the early stages of the crater formation, increases to reach a constant value after a finite time. We note here that then remains slightly smaller than , which is probably explained by the fact that significantly exceeds the angle of avalanche due to the continuous grain flow along the inner flanks.
At this point, it is particularly interesting to make use of these observations to estimate the spatial distribution of the deposited grains. To do so, let us now consider the local height of the free surface at the distance from the center at time [Fig. 4(b)]. Close to the center, exhibits a complex behavior which results from both the deposition and the surface flows. Far from the center, , which results from the deposition alone, evolves linearly in time. From this latter observation, we deduce that the advection is not significantly affected by the crater growth and that the distribution of the deposited grains, far away from the center, is almost constant in time. At an intermediate distance from the center, we observe a change in the temporal evolution of : At small times, the dynamics is only due to the deposition whereas later, when reaches the avalanche angle, the local dynamics results from both the deposition and the surface flows. The volume, , of granular material deposited at the distance from the center per unit distance and per unit time is proportional to the initial slope far away from the center [Fig. 4(c)]. Seeking for a simple mathematical description of the deposition flow, we guess that the grains, pushed away from the center by the liquid flow, have a negligible probability to deposit back at the center and we propose to interpolate by , which makes it possible to extract a characteristic length at which the grains are deposited away from the center. We shall show in Sec. III.2 that the shape of the distribution accounts for the evolution of the distance between the two summits as a function of the time [Fig. 4(d)].
III.1.4 Finite size effects
We aim at reporting the growth of the crater in an infinite surround, not limited by the finite depth of the granular bed, , or by the finite water height, .
The growth of the crater stops when the thickness of the granular bed at the center vanishes. Taking into account the angle of avalanche and the conservation of the granular-material volume, we can estimate the maximum accessible value of , . We shall report experimental results obtained for cm so that cm is about the lateral width of the cell. The growth of the crater shall thus not be limited by the finite depth of the granular bed.
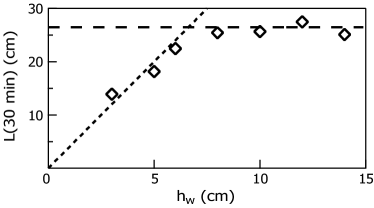
In the same manner, the height of the piles can obviously not exceed . We estimate, the maximum accessible value of , . However, we checked experimentally that largely underestimates the finite water-height effect: Reporting at a given, large, time min as a function of , we obtain experimentally that the growth of the crater is limited by the water height for (Fig. 6). Interestingly, we observe, in addition, that does not depend on if : The crater growth is not altered by the water height if the latter is large enough. We shall report experimental results obtained for cm so that cm is larger than the lateral width of the cell. The growth of the crater shall thus not be limited by the finite water height.
III.2 Influence of the gas flow and grain size
III.2.1 Dependence on the air flux
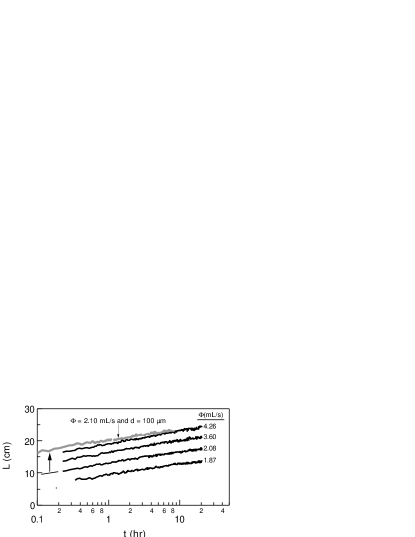
We report the distance between the piles as a function of time , for different air flow rates (Fig. 7). We observe that increases logarithmically with and we write , being a typical volume.
In the bubbling regime, when the gas emission at the free surface consists of the periodic emission of independent bubbles at the free surface, a simple argument can account for the proposed dependance on the total emitted gas volume, , alone: The dimensions of the piles, length or height, are expected to depend on the total number of grains displaced by the water flow. Thus, being proportional to the number of emitted bubbles, which itself, at a given time , is proportional to , we expect to be a function of alone, as observed experimentally. In addition, we observe that the relation holds true even at large when the system exhibits, almost always, the open-channel regime. Thus, contrary to the intuition, the small bubbles emitted by the open-channel are as efficient as the exploding bubble of the bubbling regime in lifting the grains: This observation is again in agreement with the fact that the grains are mainly lifted by the water flow and not expelled by the explosion of the bubbles Gostiaux02 .
III.2.2 Dependence on the grain size
From the interpolation of the exprimental data, one can estimate the typical length and the typical volume . One observes that the length does not depend significantly on the grain size (the slope in the semilog plot remains almost unchanged) and we estimate cm for m and m. In contrast, we estimate mL for m and a significantly smaller value mL for m. The precise dependence of and on is difficult to access experimentally as such measurements require precise knowledge of the origin of time (a delay alters significantly the slope and the offset in the semilog plot) which we are missing. Nevertheless, is observed to decrease drastically with the grain size whereas remains almost constant.
IV Discussion
The crater growth is due to the advection of the grains and to the subsequent deposition away from the location of the gas emission. From the observation of the deposit far away from the center (Sec. III.1.3), we propose that the deposited flow can be written, for large distance , . This relation accounts for the logarithmic growth of the crater. Indeed, assuming the angle on both sides of the piles, a simple geometrical analysis gives the volume, of the grains on the outer side of one pile (). Noting that only the deposition of grains on the outer flank of the pile contributes to its growth, we can write , which leads to the equation governing the pile growth,
| (1) |
Provided that (which is almost always satisfied experimentally), we obtain that, asymptotically, increases logarithmically with time according to with and . The experimental rough estimates, obtained for m, cm (Sec. III.1.3) and cm (Sec. III.2.1) are in fair agreement with this expectation. The same conclusion holds true for the smaller grains, m, as we measured cm for the same value of .
Finally, if we interpret the volume as the gas volume necessary to lift or move a given quantity of grains, one can easily understand that decreases with . Indeed, the advection process, whose associated force scales like , competes with the buoyancy force which scales like . As a result, large grains are more difficult to lift than small ones and the gaseous volume necessary to move them away is larger.
The advection process remains difficult to model in details. Indeed, the liquid flow in the wake of the bubbles is generally turbulent and it is barely possible to account for the advection of the solid particles in such a complex stream field. There also remains a very important open question: We observed that the growth of the crater is not altered by the water depth (if large enough). However, we observe that the vertical size of the large-scale convective rolls compares to , whereas their lateral size compares to . One thus would expect the typical distance to depend on and, even, on time. Our study does not display such an effect. The typical vertical distance to be taken into account is probably the distance over which a grain follows the bubble in its wake, in other words, the maximum accessed altitude.
In conclusion, we reported experimental data on the dynamics of a crater growth at the free surface of an immersed granular crossed by an upward gas flow. We observed that, due to the peculiar transport of the grains in the wake of the rising bubbles, the typical size of the crater increases logarithmically with time. The dynamics is demonstrated not to be altered by the gas flow regime and only to depend on the overall gas flow rate and the typical size of the grains. However, even if we clearly established that the global dynamics of the crater is compatible with the spatial structure of the grain deposition around the gas-emission locus, we are still missing a complete modeling of the grain advection by the turbulent flow, which deserves to be further investigated.
ACKNOWLEDGMENT
G.V. acknowledges a grant by CONICYT (Comisión Nacional de Investigación Científica y Tecnológica, Gobierno de Chile).
References
- (1) P. L. Evans, L. W. Schwartz, and R. V. Roy, J. Colloid Interface Sci. 227, 191 (2000).
- (2) Z. Insepov, L. P. Allen, C. Santeufemio, K. S. Jones, and I. Yamada, Nucl. Instrum. Methods Phys. Res. B 206, 846 (2003).
- (3) Y. Yamaguchi, J. Gspann, and T. Inaba, Eur. Phys. J D 24, 315 (2003).
- (4) T. Aoki, and J. Matsuo, Nucl. Instrum. Methods Phys. Res. B 241, 594 (2005).
- (5) A. W. Woods, and S. M. Bower, Earth Planet. Sci. Lett. 131, 189 (1995).
- (6) H. Obanawa, and Y. Matsukura, Geomorphology 97, 697 (2008).
- (7) C. Riedel, G. G. J. Ernst, and M. Riley, J. Volcanol. Geotherm. Res. 127, 121 (2003).
- (8) Y. Grasselli, and H. J. Herrmann, Gran. Matt. 3, 201 (2001).
- (9) J. S. Uehara, M. A. Ambroso, R. P. Ojha, and D. J. Durian, Phys. Rev. Lett. 90, 194301 (2003).
- (10) D. Lohse, R. Bergmann, R. Mikkelsen, C. Zeilstra, D. van der Meer, M. Versluis, K. van der Weele, M. van der Hoef, and H. Kuipers, Phys. Rev. Lett. 93, 198003 (2004).
- (11) X.-J. Zheng, Z.-T. Wang, and Z.-G. Qiu, Eur. Phys. J. E 13, 321 (2004).
- (12) K. Wada, H. Senshu, and T. Matsui, Icarus 180, 528 (2006).
- (13) S. J. de Vet, and J. R. de Bruyn, Phys. Rev. E 76, 041306 (2007).
- (14) A. M. Walsh, K. E. Holloway, P. Habdas, and J. R. de Bruyn, Phys. Rev. Lett. 91, 104301 (2003).
- (15) J.-F. Boudet, Y. Amarouchene, and H. Kellay, Phys. Rev. Lett. 96, 158001 (2006).
- (16) S. Yamamoto, K. Wada, N. Okabe, and T. Matsui, Icarus 183, 215 (2006).
- (17) S. M. Wu, H. P Zhu, A. B. Yu, and P. Zulli, Gran. Matt. 9, 7 (2007).
- (18) A. Suzuki, I. Kumagai, Y. Nagata, K. Kurita, and O. S. Barnouin-Jha, Geophys. Res. Lett. 34, L05203 (2007).
- (19) H. M. Fritz, W. H. Hager, and H.-E. Minor, Exp. Fluid 35, 505 (2003).
- (20) P. Rigord, A. Guarino, V. Vidal, and J.-C Géminard, Gran. Matt. DOI 10.1007/s10035-005-0214-1 (2005).
- (21) F. Zoueshtiagh, and A. Merlen, Phys. Rev. E 75, 056313 (2007).
- (22) L. Gostiaux, H. Gayvallet, and J.-C Géminard, Gran. Matt. 4, 39 (2002).
- (23) R. A. Bagnold. The Physics of Blown Sand and Desert Dunes. Chapman and Hall, London (1941).
- (24) K. Kroy, G. Sauermann and H.J. Herrmann, Phys. Rev. Lett. 88, 054301 (2002).
- (25) B. Andreotti, P. Claudin and S. Douady, Eur. Phys. J. B 28, 321 (2002).
- (26) P. Hersen, K.H. Andersen, H. Elbelrhiti, B. Andreotti, P. Claudin and S. Douady, Phys. Rev. E 69, 011304 (2004).
- (27) T. Divoux, E. Bertin, V. Vidal and J.-C. Géminard, Intermittent outgassing through a non-Newtonian fluid, arXiv:0810.3095v1 [cond-mat.stat-mech] (2008).