Deep wide-field GMRT surveys at 610 MHz
Abstract
The GMRT has been used to make deep, wide-field surveys of several fields at 610 MHz, with a resolution of about 5 arcsec. These include the Spitzer Extragalactic First Look Survey field, where 4 square degrees were observed with a r.m.s. sensitivity of about 30 Jy beam-1, and several SWIRE fields (namely the Lockman Hole, ELAIS-N1 and N2 fields) covering more than 20 square degrees with a sensitivity of about 80 Jy beam-1 or better. The analysis of these observations, and some of the science results are described.
1Cavendish Laboratory, 19 J. J. Thompson Avenue, Cambridge, CB3 0HE, United Kingdom
2SUPA, Institute for Astronomy, Royal Observatory Edinburgh, Blackford Hill, Edinburgh, EH9 3HJ, United Kingdom
1. Introduction
In recent years we have used the GMRT (e.g. Pramesh Rao 2002) to make relatively deep, wide area observations of several fields at 610 MHz, with a resolution of about 5 arcsec. The deepest of these fields is the Spitzer ‘Extragalactic First Look Survey’ (xFLS) region111See: http://ssc.spitzer.caltech.edu/fls/, which is about 4 square degrees in extent, and is in a direction with very little Galactic infra-red foreground emission. This field already has deep VLA observations at 1.4 GHz available with a resolution of about 5 arcsec (see Condon et al. 2003), for which the GMRT provides complementary 610-MHz observations at a similar resolution. The other fields are selected areas from the ‘SWIRE’ (Spitzer Wide-area InfraRed Extragalactic) survey (Lonsdale et al. 2003). These areas have deep infra-red observations from the Spitzer Space Telescope, and often other deep complementary optical observations, but do not have deep, wide-field radio observations available.
Table 1 gives a summary of the xFLS and SWIRE fields which were observed. Given the primary beam of the GMRT at 610 MHz is arcmin, each pointing covers degree2. For the ELAIS-N1 field, four of the nineteen pointings (which overlap regions where deeper optical observations are available; Warren et al. 2007) were observed more deeply, to provide a noise value of Jy beam-1, rather than the Jy beam-1 of the other pointings in this field. Also, observations of an additional 26 outer pointings in the Lockman Hole field have been obtained – in order to cover the whole degree2 observed with Spitzer – and analysis of these is ongoing. All of the observations were made with two 16-MHz sidebands, in both right and left circular polarised emission. Each sideband was divided into 128 spectral channels, so that any narrow band interference could be identified and removed.
2. Data Analysis
The analysis of these observations was performed using classic AIPS. Initial careful editing of the data was necessary in order to remove interference, and other bad data (e.g. a few systematically poor baselines, due to correlator hardware problems). Bright ‘primary’ calibrators (e.g. 3C286 and/or 3C48) were observed at the start/end of each observation run, in order to define the flux density scale, and also derive antenna-based bandpass corrections. The bandpass corrections were applied, and several central channels in each sideband were averaged together, in order to make a ‘pseudo-continuum’ channel (‘channel 0’ in VLA notation). The antenna-based amplitude and phase calibrations of the telescope were derived using the pseudo-continuum channel, from the observations of nearby, compact ‘secondary’ calibrators, which were observed every 30 min or so. The antenna-based amplitude/phase and bandpass corrections were then applied to the observed visibilities, and 10 channels were averaged together, in order to reduce the size of the datasets before imaging.
The wide field-of-view of the GMRT means that multiple small ‘facets’ need to imaged, and then combined together. Generally 19 facets were used (i.e. a central facet, 6 in a surrounding ring, and 12 in a larger ring on a hexagonal grid), to cover the full observed field. The quality of the synthesised images were improved by several cycles of self-calibration, at 10, 3 and 1 min for phase only, and finally 10 min for amplitude and phase. This lead to images with dynamic ranges – peak to r.m.s. away from bright sources – of several thousand to one, with r.m.s. noise values away from bright sources that are close to the expected thermal noise. Near bright sources, however, the quality of the images is limited, which is believed to be due to variations in the pointing of the telescope antennas (see below).
The early analyses of the overlapping pointings from the xFLS field revealed two problems: (1) the time stamps of -data were slightly wrong (by about 7 s), meaning that the coordinates were also slightly wrong, leading to a distortion (nearly a rotation) in the synthesised images; (2) comparison of the flux densities of compact sources in overlap regions between adjacent pointings showed systematic differences, which are thought to be due to antenna pointing offsets during the observations, particularly at low elevations. For the former problem, an AIPS task was written222See: http://www.mrao.cam.ac.uk/~dag/UVFXT/ to correct affected data, by adjusting the time stamps and recalculating the coordinates (and the real-time GMRT system was corrected in the summer of 2006). The latter problem was correctly empirically, using a slightly shifted effective primary beam position. An improved pointing model is currently being implemented at the GMRT to address this problem.
Further details of the analysis procedures used are given in Garn et al. (2007b) and Garn (2009). Users of classic AIPS should also note that there were problems with the tasks SPLIT and SPLAT which might result in incorrect frequency headers when averaging spectral channels together. These tasks were patched late in 2007333See: patches 17, 18 and 19 at http://www.aips.nrao.edu/31DEC06/patches.html.
3. Results and Discussion
Given the wide field of the 610-MHz images produced by these observations, it is not possible to show these in full (e.g. the xFLS field is degree across, so with 1.5 arcsec pixels to well sample the arcsec beam, the image is about 5000 pixels in each dimension). Figure 1 shows a small portion – only about 3 per cent – of the deep GMRT image of the xFLS field.
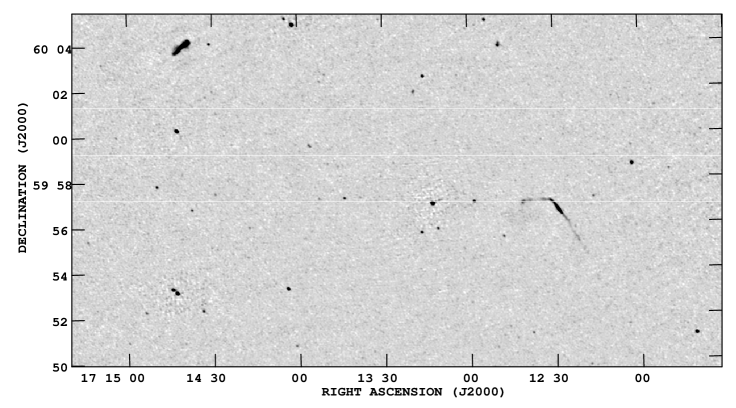
The GMRT results for the xFLS field are comparable in resolution, and in depth for synchrotron emission, to the available deep VLA 1.4-GHz survey of the same region: the GMRT observations, which took about 40 hours of observations, have an r.m.s. noise (but only away from the bright sources) of Jy beam-1; the VLA observations, which took about 200 hours of observations, have an r.m.s. noise of Jy beam-1.
These deep, wide-field surveys provide catalogues of radio sources, which then allow a variety of astrophysical studies to be made, including comparisons with the deep infra-red and other wavelength observations available for these fields. In particular, for the xFLS region, the existence of both the deep VLA 1.4-GHz and GMRT 610-MHz observations allow the properties of many sub-mJy radio sources – which are dominated by star forming galaxies, rather than AGN – to be studied, including their radio spectral indices. Some of these studies are described briefly below.
In the xFLS survey region it is possible to define a sample of 235 sources which are detected at both 610 and 1410 MHz in the radio and at 24 and 70 m in the infra-red, for which spectroscopic redshifts (up to ) are available. From these data it is possible to study the infra-red/radio correlation, applying ‘-corrections’ to provide rest-frame luminosities at the same frequencies (using the observed spectral indices in the radio, and model SEDs in the infra-red), see Garn et al. (2007a). Any cosmic evolution of the magnetic fields in galaxies would be expected to be reflected in changes in the comparative radio brightness of star-forming galaxies. The available data shows no evidence for such an effect, suggesting that there has been little evolution in the magnetic fields of galaxies since .
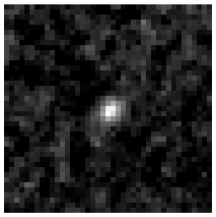
Although the GMRT observations provide deep images, it is possible to probe, statistically, the properties of sources that are too faint to be detected individually, using a median ‘stacking’ technique (see Garn & Alexander 2009). For example, stacking 591 sources from the xFLS field with Spitzer 24-m flux densities between 150 – 201 Jy leads to a median detected radio flux of Jy at 610 MHz, see Figure 2. Using this technique, the radio properties of sources with 24-m flux densities between 150 Jy and 2 mJy show no evidence for a change in the infra-red/radio correlation.
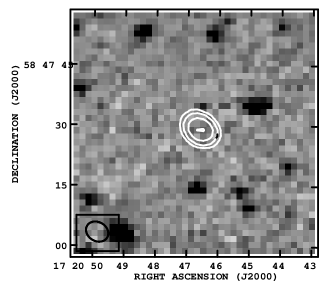
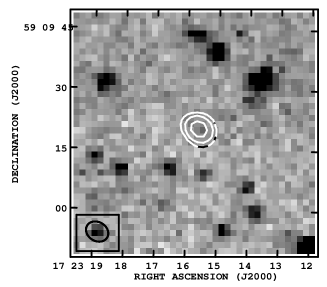
Almost all of the radio sources detected in these GMRT surveys are also detected in the infra-red due to the sensitivity of the Spitzer surveys, as is expected for local AGN or star-forming galaxies. However, there are a small number of relatively bright radio sources that are not detected in the infra-red (Garn & Alexander 2008). Two examples of such sources are shown in Figure 3. There are 14 of these infrared-faint radio sources in the xFLS field, 8 of which are detected near to the limiting magnitude (24.5) of a deep R-band image of the region. These sources can modelled as compact ( kpc) Fanaroff–Riley type II radio galaxies located at high redshift ().
These surveys have also been used to construct differential source counts at 610 MHz between 270 Jy and 200 mJy (Garn et al. 2008b). A flattening in the differential source counts is clearly visible below 2 mJy, and a three-component population containing steep and flat spectrum AGN, and starburst galaxies which undergo pure luminosity evolution is sufficient to model simultaneously both the 610-MHz source counts, and 1.4-GHz source counts from the literature.
Acknowledgments.
We thank the staff of the GMRT that made these observations possible. GMRT is run by the National Centre for Radio Astrophysics of the Tata Institute of Fundamental Research.
References
- Condon et al. (2003) Condon, J. J., Cotton, W. D., Yin, Q. F., Shupe, D. L., Storrie-Lombardi, L. J., Helou, G., Soifer, B. T., & Werner, M. W. 2003, AJ, 125, 2411
- Garn (2009) Garn, T. S. 2009, PhD thesis (University of Cambridge, UK)
- Garn & Alexander (2008) Garn, T., & Alexander, P. 2008, MNRAS, 391, 1000
- Garn & Alexander (2009) Garn, T., & Alexander, P. 2009, MNRAS, in press (arXiv:astro-ph/0812.0281)
- Garn et al. (2007a) Garn, T., Ford, D., Alexander, P., Green, D. A., & Riley, J. M. 2007a, in The Modern Radio Universe: From Planets to Dark Energy, Proceedings of Science, (http://pos.sissa.it/contribution?id=PoS(MRU)073)
- Garn et al. (2007b) Garn, T., Green, D. A., Hales, S. E. G., Riley, J. M., & Alexander, P. 2007b, MNRAS, 376, 1251
- Garn et al. (2008a) Garn, T., Green, D. A., Riley, J. M., & Alexander, P. 2008a, MNRAS, 383, 75
- Garn et al. (2008b) Garn, T., Green, D. A., Riley, J. M., & Alexander, P. 2008b, MNRAS, 387, 1037
- Lonsdale et al. (2003) Lonsdale, C. J., et al. 2003, PASP, 115, 897
- Pramesh Rao (2002) Pramesh Rao, A. 2002, in IAU Symposium 199, The Universe at Low Radio Frequencies, ed. A. Pramesh Rao, G. Swarup & Gopal Krishna (San Fransico: ASP), 439
- Warren et al. (2007) Warren, S. P., et al. 2007, arXiv:astro-ph/0703037