On the evolution of the molecular line profiles induced by the propagation of C-shock waves.
Abstract
We present the first results of the expected variations of the molecular line emission arising from material recently affected by C-shocks (shock precursors). Our parametric model of the structure of C-shocks has been coupled with a radiative transfer code to calculate the molecular excitation and line profiles of shock tracers such as SiO, and of ion and neutral molecules such as H13CO+ and HN13C, as the shock propagates through the unperturbed medium. Our results show that the SiO emission arising from the early stage of the magnetic precursor typically has very narrow line profiles slightly shifted in velocity with respect to the ambient cloud. This narrow emission is generated in the region where the bulk of the ion fluid has already slipped to larger velocities in the precursor as observed toward the young L1448-mm outflow. This strongly suggests that the detection of narrow SiO emission and of an ion enhancement in young shocks, is produced by the magnetic precursor of C-shocks. In addition, our model shows that the different velocity components observed toward this outflow can be explained by the coexistence of different shocks at different evolutionary stages, within the same beam of the single-dish observations.
Subject headings:
ISM: clouds — ISM: jets and outflows — physical data and processes: shock waves — ISM: individual (L1448)1. Introduction
Shocks are an ubiquitous phenomena in the interstellar medium. In molecular dark clouds where the fractional ionisation of the gas is very low (10-7; e.g. Caselli et al., 1998), shock waves develop a magnetic precursor that accelerates, compresses and heats the ion fluid before the neutral one, forming a C-type shock (see Draine, 1980; Flower & Pineau des Forêts, 1995; Flower et al., 1996; Lesaffre et al., 2004). The subsequent velocity decoupling between the ion and neutral components of the gas produces the sputtering of the mantles of dust grains, injecting large amounts of molecular material into the far downstream gas (e.g. Draine, Roberge & Dalgarno 1983; Caselli, Hartquist & Havnes 1997; Schilke et al. 1997).
Since silicon is heavily depleted onto dust grains in dark clouds such as L183 and L1448 (SiO abundance of 10-12; Ziurys, Friberg & Irvine, 1989; Requena-Torres et al., 2007), the detection of SiO is a strong indicator of the dust grain processing by C-shocks. The SiO abundances in molecular outflows such as L1448-mm/IRS3 are 10-6, and the typical SiO emission arising from the warm postshock gas shows broad line profiles red- or blue-shifted with respect to the velocity of the ambient cloud (e.g. Martín-Pintado et al., 1992).
Lefloch et al. (1998) and Jiménez-Serra et al. (2004) have reported the detection of very narrow SiO emission at ambient velocities with abundances of only 10-11-10-10, toward the NGC1333 and L1448-mm molecular outflows. For L1448-mm, it has been proposed that this emission, which is also correlated with an enhancement of the ion and electron densities (Jiménez-Serra et al., 2006), arises from material recently processed by the magnetic precursor of C-shocks (Jiménez-Serra et al., 2004).
Modelling of C-shock waves has traditionally focused on, and successfully reproduced, the SiO abundances and line profiles generated in the evolved postshock gas (Schilke et al., 1997; Gusdorf et al., 2008), but it has usually ignored that molecular abundances and line profiles must change as C-shocks evolve in very young outflows like that powered by L1448-mm. Jiménez-Serra et al. (2008, hereafter J08) have shown that the observed trend for the enhancement of the SiO and CH3OH abundances from the precursor to the high velocity components in this outflow (Jiménez-Serra et al., 2005), can be explained by the progressive sputtering of the grain mantles and cores as the shock evolves. However, no attempt has been made so far to predict the expected molecular line profiles, and their changes, produced by the propagation of shock waves through the unperturbed gas.
Here we present the first results of the evolution of the line profiles of SiO, H13CO+ and HN13C, produced by the propagation of C-shocks. The derived line profiles strongly suggest that the narrow SiO lines and the ion enhancement are fingerprints of the magnetic precursor of shock waves. They also reproduce the broader moderate and high velocity emission components arising from the postshock gas in L1448-mm at later stages of the evolution of the shock.

2. The model
We consider a plane-parallel C-shock propagating with a velocity through the ambient medium. The multi-layered steady-state physical structure of the shock in the frame of the preshock gas, is calculated by using the analytic approximation (fit) described in J08. Fig. 1 shows the shock field for , and , as a function of the flow time for two C-shocks with =30 and 70 km s-1, initial H2 density =105 cm-3, and magnetic field =450 ( is calculated following the relation = with 1. See also Sec. 2 in J08 for the details on the approximation). The Alfvén speed is =2.18 km s-1 (derived from and as =; see Myers & Goodman, 1988). This approximation has been validated in J08 (Sec. 4 in this work) and reproduces the physical structure of C-shocks for =104-106 cm-3. Hereafter, the term time evolution will be used for the variation of the molecular line emission as a function of the flow time, which corresponds to the characteristic dynamical time across the shock.
From Fig. 1, it is clear that the ion fluid is accelerated before the neutrals by the magnetic precursor at the early stages of the shock. Since dust grains are charged particles, they are coupled to the magnetic field and move with the ion velocity, . In the postshock gas, the velocities of the charged and neutral fluids re-couple again due to the transfer of momentum from the charged particles to the neutral fluid by collisions.
The line profiles of species linked to the grain chemistry such as SiO, are derived by considering the sputtering of the grain mantles and cores by collisions between dust grains and neutral particles such as H2, He and other heavier species including CO. As shown by Caselli et al. (1997) and J08, the abundances of sputtered material from dust grains, and in particular of silicon, hardly change with the initial H2 density of the gas. On the contrary, these abundances are drastically enhanced for increasing shock velocities due to the larger ion-neutral drift velocities, , achieved in the shock. We have assumed that a small fraction of Si (0.01% with respect to H2O; J08) is present in the grain mantles. Projection effects are also taken into account in the calculation of the SiO abundances by including the inclination angle of the outflow with respect to the line of sight, (J08). We consider that SiO is either directly released from the mantles (Jiménez-Serra et al., 2005) or rapidly formed by the oxidation of Si sputtered from the cores (25 yrs; Cabrit et al., 2007). The gas phase abundance of SiO, (SiO), is calculated as a function of the flow time, , and the SiO column density in each plane-parallel slab of gas within the shock, (SiO), is estimated as (SiO)=(SiO) (H2), where (H2) and are the H2 density and spatial width of the slab, respectively.
The level populations (i.e. excitation) of SiO in each slab of gas are calculated by using the LVG (Large Velocity Gradient) approximation. We use the H2 collisional coefficients of SiO derived by Dayou & Balança (2006). The line profiles are then obtained by making the radiative transfer through all individual slabs of material. The line peak optical depth, , in each slab of gas is calculated by means of the LVG approximation through the following expression:
| (1) |
where is the speed of light, and and are the frequency and Einstein coefficient of the molecular transition for which we calculate the line profiles. and are the level populations of the upper and lower energy levels respectively, and and , the degeneracy associated with them. is the radial velocity gradient along the propagation of the shock.
To determine the behaviour of the optical depth, , as a function of velocity, we convolve the peak optical depth, , at a given velocity (slab of material) with a Gaussian-like profile. The linewidth of every individual profile, , is estimated by assuming thermal and turbulent broadening, and . The thermal broadening depends on the temperature of the neutral fluid, , as:
| (2) |
where is the Boltzmann constant and is the mass of the molecule. The thermal broadening for the SiO emission at the precursor stage with =10 K, is only of =0.1 km s-1.
The turbulent linewidth is considered as a fixed parameter throughout the shock without largely affecting our estimates of the total linewidth. Although turbulence in shocks still remains poorly understood, Joulan et al. (1998) studied the effects of viscous dissipation and ion-neutral velocity decoupling on the chemistry and molecular line emission arising from turbulent flows (filamentary vortex) in the presence of magnetic fields in diffuse clouds. In their model, Joulan et al. (1998) determined that the maximum tangential velocity of the vortex filaments (which gives the rms velocity dispersion of the large scale turbulence; Jimenez, 1997; Belin et al., 1996) is close to the Alfvén velocity in the neutral fluid, . If we therefore assume that is directly proportional to , the increase of in the postshock gas can be estimated from the compression of the magnetic field and of the density of the gas at the late stages of the shock. This compression is given by the shock jump conditions = and =, where is the shock speed and depends on and as described in J08. From here, in the postshock gas ranges from 2.5 to 3.5 times larger than in the preshock gas for shock speeds between =30 and 70 km s-1. However, despite the increase by a factor of 3 in , the total linewidth of the SiO line profile only differs by a factor of 1.2 from that calculated assuming constant turbulent broadening, because thermal broadening is dominant.
For the ion and neutral species H13CO+ and HN13C, we assume that their flux density, and therefore, their abundances remain roughly constant across the shock. This is supported by the results of Markwick, Millar & Charnley (2000), in which HCO+ and HNC are chemically inert after the disruption of the grain mantles into the gas phase by the passage of a C-shock. The initial column densities for these molecular species are 1012 cm-2 (Jiménez-Serra et al., 2004), and as the line profiles of H13CO+ and HN13C get broader with the evolution of the shock, their peak column densities, , are re-scaled following =, where is the variation of the neutral/ion velocity from one slab of gas to the next one, and is the total increase of the neutral/ion velocity from the beginning of the shock to the current slab of material in the shock. The excitation of H13CO+ and HN13C has been derived by using the LVG approximation and the H2 collisional coefficients of Schöier et al. (2005). The line profiles are derived following the same procedure as that used for SiO. Finally, we assume that the emission of H13CO+ and HN13C, as well as that of SiO, has the same spatial extent and morphology. Beam filling factors have not been considered in these calculations. The line intensities therefore depend on the size of the shocked region.
A bow-shock morphology for the shock may lead to substantial variations on the derived SiO line profiles with respect to those calculated in the plane-parallel case. The planar geometry is however easier to handle in the calculation, and since the SiO bullets in L1448-mm only show a partial bow-shock morphology (see Dutrey, Guilloteau & Bachiller, 1997), the use of both model geometries are equally justified.
3. Time evolution of the molecular line profiles in C-shocks
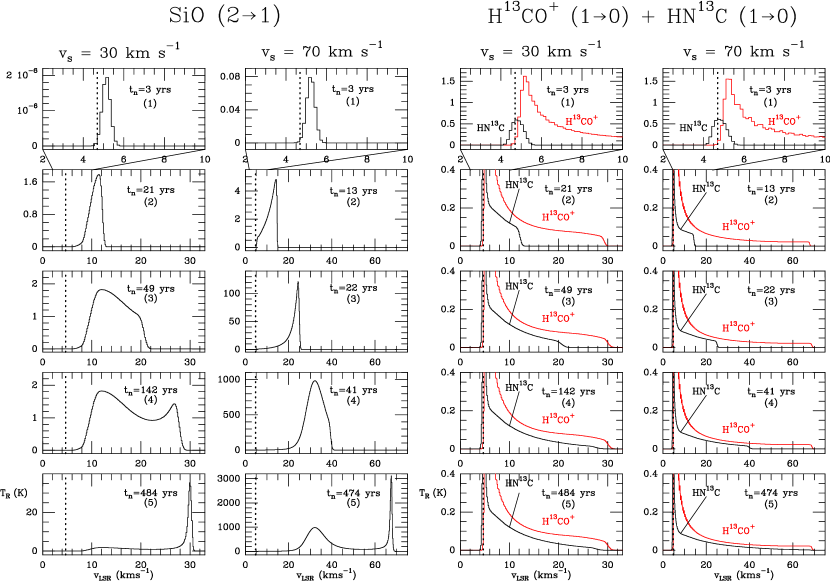
In Fig. 2, we show the evolution of the line profiles of SiO, H13CO+ and HN13C obtained by freezing the propagation of two C-shocks, one with =30 km s-1 and the other with =70 km s-1, at 5 different flow times (see dots in Fig. 1). In order to directly compare our results with observations, we have included the preshock gas velocity, , in the calculation of the molecular line profiles. For the L1448-mm outflow (Sec. 4), we assume that =4.7 km s-1 and the inclination angle is =70∘ (Girart & Acord, 2001). The SiO, H13CO+ and HN13C line profiles of Fig. 2 are then derived as a function of the radial velocity measured by the observer, . While for HN13C this velocity is =, for H13CO+ is . For SiO, one may think that this molecular species would move with the ion fluid once it is ejected from grains. However, since SiO is not coupled to the magnetic field, this molecule is rapidly slowed down by collisions with H2 to the velocities of the neutral fluid in time-scales, , of only few days. For a SiO molecule =210-12 sec-1. Assuming =105 cm-3, =10 K and =0.7414 Å as the internuclear distance for a H2 molecule (Huber & Herzberg, 1979), the slow down time is 20 days.
From Fig. 2, we find that the SiO emission generated in shocks has very different line shapes depending on the evolutionary stage of the shock. In particular, it is striking that the typical SiO line profiles arising from the magnetic precursor at =3 yrs, have very narrow linewidths of only 0.5 km s-1 and are slightly shifted in velocity (5.2 km s-1) with respect to the ambient cloud (4.7 km s-1). The narrow linewidths of this emission are due to the low temperatures of the neutral fluid at the magnetic precursor stage (=10 K; see Fig. 1), and the small velocity shift is explained by the fact that the sputtering of the grain mantles requires ion-neutral drift velocities of 6 km s-1 to generate SiO abundances of 10-12. This occurs when H13CO+ reaches velocities of 12 km s-1 that imply 7 km s-1 (see Fig. 1). The peak intensity of the narrow SiO line is 4 orders of magnitude larger for the =70 km s-1 shock (0.08 K vs. 210-6 K) due to the larger SiO abundances (10-8 vs. 10-11) injected from the grain mantles into the gas phase. This intensity is increased by only a factor of 3 if we consider that the fraction of silicon within the mantles is of 0.1% with respect to H2O (i.e. 1 order of magnitude larger than that assumed in Sec. 2). This is due to the fact that only a fraction of the grain mantles (50%) is released into the gas phase for the same flow time of =3 yrs.
For later flow times, the narrow SiO feature is swept out by the larger efficiency of the sputtering of the grain cores once the velocity threshold of 25 km s-1 is overcome (see e.g. Caselli et al., 1997; May et al., 2000). This enhances the gas phase abundances of SiO by several orders of magnitude. For the 30 km s-1 shock, these abundances are of 10-8 and 10-7 at =10 and 20 yrs (see J08). For the 70 km s-1 shock, the SiO abundances are enhanced up to 510-6 and 710-6 at =13 and 22 yrs, respectively. The increase of with the propagation of the shock leads to larger peak intensities and broader SiO line profiles. The SiO emission subsequently develops double peaked line profiles. The lower velocity peak is centred at 12 km s-1 for =30 km s-1 and at 32 km s-1 for =70 km s-1. This peak is correlated with the maximum ejection of silicon from the grain cores (10-7 and 710-6, i.e. 0.3% and 19% of all silicon locked in the cores for a 30 km s-1- and a 70 km s-1-shock, respectively), which happens as soon as the ion-neutral drift velocity reaches the threshold value of 25 km s-1. Since the fraction of silicon released into the gas phase is larger for the 70 km s-1 shock (by almost a factor of 100), the peak intensities therefore differ by more than 2 orders of magnitude from the =30 km s-1 shock. We note that the moderate velocity peak was also present in the Schilke et al. (1997) and Gusdorf et al. (2008) models, but averaged with and dominated by the brightest high velocity postshock emission. These moderate velocity profiles are similar in shape to those reported by Cabrit et al. (2007) for the young HH212 SiO microjet and by Lefloch et al. (1998) in the NGC1333 outflows.
The high velocity peaks at 30 and 70 km s-1 (500 yrs; Fig. 2), are produced by the large accumulation of SiO in the postshock wide layers (slabs) of gas. Although the derived brightness temperatures are very high, this velocity component qualitatively resembles the SiO line profiles obtained by Schilke et al. (1997) and Gusdorf et al. (2008), and those observed by Jiménez-Serra et al. (2004) and Nisini et al. (2007). The lack of SiO gas-phase chemistry or depletion onto grains in our model may account for the too strong emission predicted to arise from the high velocity postshock gas (see Sec. 4).
We note that discrepancies in do exist between the fit profile calculated with our approximation and the solutions derived from comprehensive MHD models where increases earlier in the shock (e.g. Kaufman & Neufeld, 1996, see also Fig. 2 in J08). This is not crucial for the precursor stage where MHD calculations predict an initial low-temperature plateau for (with 10-20 K; see e.g. Flower & Pineau des Forêts, 2003). However, for the moderate and high velocity components, the earlier increase of in the shock may produce significant variations in the peak intensity of the SiO line profiles compared to our results. While for the 30 km s-1 shock the SiO peak intensity could be increased by only a factor of 2, for the 70 km s-1 shock this intensity could be enhanced by more than 1 order of magnitude. Therefore, although quantitative results cannot be given for the moderate and high velocity components, specially for the 70 km s-1 shock (also note that out model lacks of SiO gas phase chemistry and freeze-out; see Sec. 4 for a more detailed discussion), the qualitative behaviour of the SiO line profiles is preserved. Quantitative predictions of the SiO line fluxes across the shock will be carried out in the future with a comprehensive MHD code including chemical processes.
Regarding the broadening of the SiO lines, the earlier increase of in the shock does not substantially affect the derived linewidths of the SiO line emission. Indeed, for both cases with =30 km s-1 and =70 km s-1, these linewidths differ by less than a factor of 1.4 from those shown in Figure 2 at every evolutionary stage within the shock.
For H13CO+ and HN13C, the differences in the line profiles of these species become apparent at the magnetic precursor stage. The line profile of HN13C peaks at the preshock velocity of 4.7 km s-1 at =3 yrs (stage 1), and has a linewidth of 0.7-0.8 km s-1. The line emission of H13CO+, however, is (red)shifted to =5.2 km s-1 and shows a moderate velocity wing with a terminal velocity (maximum velocity attained by the ion fluid at that certain flow time and reproduced in the molecular line profile) of 12 km s-1 for =30 km s-1, and of 23 km s-1 for =70 km s-1 (see Fig. 1). We note that the shift in velocity of the H13CO+ intensity peak is sensitive to the time step used in the calculation of the profiles. The line profiles of H13CO+ and HN13C get broader as the shock evolves. While the terminal velocity of the H13CO+ emission is reached at stage 2 (=21 and 13 yrs; see Fig. 2), the line profiles of HN13C require flow times of =500 yrs to show broad emission with a similar terminal velocity.
4. Observational fingerprints of the magnetic precursor of C-shocks
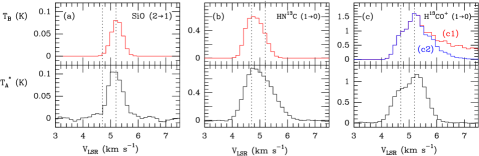
In panels (a), (b) and (c) of Fig. 3, we show the comparison between the line emission of SiO, HN13C and H13CO+ observed toward the L1448-mm outflow (Jiménez-Serra et al., 2004), and the line profiles obtained by our model for a C-shock with =70 km s-1, =105 cm-3, =450 , =10 K and =4.7 km s-1 at the magnetic precursor stage with =3 yrs. The shock velocity of 70 km s-1 is selected based on the terminal velocity of the SiO emission in L1448-mm. Although the time-scales of 3 yrs at the precursor are very short, they are consistent with the dynamical ages of the very young shocks detected in the vicinity of the L1448-mm source (90 yrs; Girart & Acord, 2001), and in the HH212 SiO microjet (25 yrs; Cabrit et al., 2007). The freezing flow time of =3 yrs implies a radial velocity of =5.2 km s-1 (i.e. =0.5 km s-1), at which the observed narrow SiO lines show their emission peaks toward L1448-mm. The predicted peak intensity for the =21 transition is of 0.08 K and implies a SiO abundance of 210-8. We note that we require a shock with =70 km s-1 in order to inject this SiO abundance at this early stage of the shock. One may think that SiO abundances of 10-8 could also be obtained at later flow times in the shock. However, the calculated line profile would be considerably broader and its emission peaks would be largely (red)shifted, which is not consistent with the narrow SiO emission observed toward this outflow. Therefore, the radial velocity and the narrow linewidth of the narrow SiO emission are strong constraints for the determination of the shock age associated with this emission.
The derived peak intensity of the narrow SiO emission shown in Fig. 3 only differs by 20% from the observed one. The estimated =32/=21 line intensity ratio (of 0.4) is, however, a factor of 3 smaller than that measured in L1448-mm (see Jiménez-Serra et al., 2004), suggesting that the H2 densities toward this outflow might be larger than those considered in our model. The low velocity resolution (of 1 km s-1 vs. 0.14 km s-1 shown in Fig. 3) of the Nisini et al. (2007) observations toward this outflow, prevents the direct comparison of these single-dish data with our results for high- SiO transitions. In any case, the derived line intensities of the SiO transitions with 5 are expected to be far below the 3 noise level of these observations.
The SiO gas phase abundance required to match the intensity of all narrow SiO lines is of 210-8, three orders of magnitude larger than that derived by Jiménez-Serra et al. (2004). Beam dilution could explain the discrepancies in the SiO abundances. If the emitting region of the narrow SiO =21 emission is 1′′ (of 1.5-31015 cm for the magnetic precursor at the distance of 200 pc; see J08), the predicted abundance of 210-8 is diluted to 10-11, which is of the same order of magnitude as that measured in this outflow (Jiménez-Serra et al., 2004).
From Fig. 3, we also find that the difference between the H13CO+ and the HN13C line profiles observed by Jiménez-Serra et al. (2004) toward L1448-mm, are reproduced by the model. While the neutrals (HN13C; panel b) remain unperturbed at the early stages of the shock (their line profiles are centred at the velocity of the preshock gas of 4.7 km s-1), the ion H13CO+ fluid (panel c) has slipped to larger velocities (with its line peak centred at 5.2 km s-1) and shows an ion enhancement in the precursor component that is consistent with that measured in L1448-mm (Jiménez-Serra et al., 2004).
In contrast with the observed line profile of H13CO+, however, the calculated line of this species shows redshifted broad emission with terminal velocities of 12 km s-1 (red c1 histogram; Fig. 3). The observational procedure, frequency-switched mode, could be the responsible of the missing broad emission in the final spectrum of H13CO+. Another possibility could be that H13CO+ rapidly recombines in the magnetic precursor due to the large electron density enhancement at this stage of the evolution of the shock (Flower & Pineau des Forêts, 2003). If we assume that the H13CO+ abundance decreases by ion recombination with the flow time (we consider a fractional ionisation of 510-5 in the precursor component; Jiménez-Serra et al., 2006), the broad H13CO+ wing emission vanishes, leading to a narrower H13CO+ line profile that mimics the observed one (terminal velocity of 7 km s-1; blue c2 histogram). In the final derived spectrum of H13CO+, we have also included the ambient cloud component at 4.7 km s-1 with a H13CO+ peak column density of 51011 cm-2 (Jiménez-Serra et al., 2004). The calculated line intensities of H13CO+ and HN13C differ by 13-50% from those measured toward L1448-mm. Variations by a factor of 2 in the molecular column densities and initial H2 density would lead to H13CO+ and HN13C line intensities that differ by less than a factor of 2 from the ones calculated for (H13CO+)=(HN13C)=1012 cm-2 and =105 cm-3. Interferometric observations that provide the morphology and spatial extent of this emission are therefore required to solve the discrepancies in both the molecular abundances and line peak intensities of H13CO+ and HN13C in the magnetic precursor.
Jiménez-Serra et al. (2004) discussed the possibility that narrow SiO could be generated by the evaporation of the icy grain mantles by the illumination of UV radiation in Photon Dominated Regions, or PDRs (Walmsley, Pineau des Forêts & Flower, 1999). Schilke et al. (2001) reported the detection of narrow SiO emission with SiO abundances of 10-11 toward a sample of PDRs such as the Orion Bar or S 140. The linewidth of this emission is however of 2-3 km s-1, a factor of 5 broader than those measured toward L1448-mm. Furthermore, HCO, one of the main products of the UV photo-chemistry (see e.g. Schenewerk et al., 1988; Gerin et al., 2008) is not detected in the precursor component of this outflow, which allows to rule out the PDR origin for the narrow SiO emission.
Alternatively, narrow SiO emission may arise from an intervening cloud where turbulence motions of at least 6 km s-1 would be efficient enough to erode the grain mantles and inject detectable abundances of SiO into the gas phase. However, in contrast with the large-scale morphology expected from this scenario, the narrow SiO emission is not widespread around L1448-mm as shown by the low upper limits of the SiO abundance of 10-12 found in the regions with no precursor interaction (Jiménez-Serra et al., 2004, 2005). We note that these upper limits are of the same order of magnitude as those measured in the quiescent gas of the L183 dark cloud by the high-sensitivity 30 m observations of Requena-Torres et al. (2007). This indicates that the lack of SiO emission toward these regions is caused by a real lack of SiO in gas phase. From all this, we propose that the most likely explanation for the narrow SiO lines detected toward L1448-mm, is the interaction of the magnetic precursor of C-shocks in very young outflows.
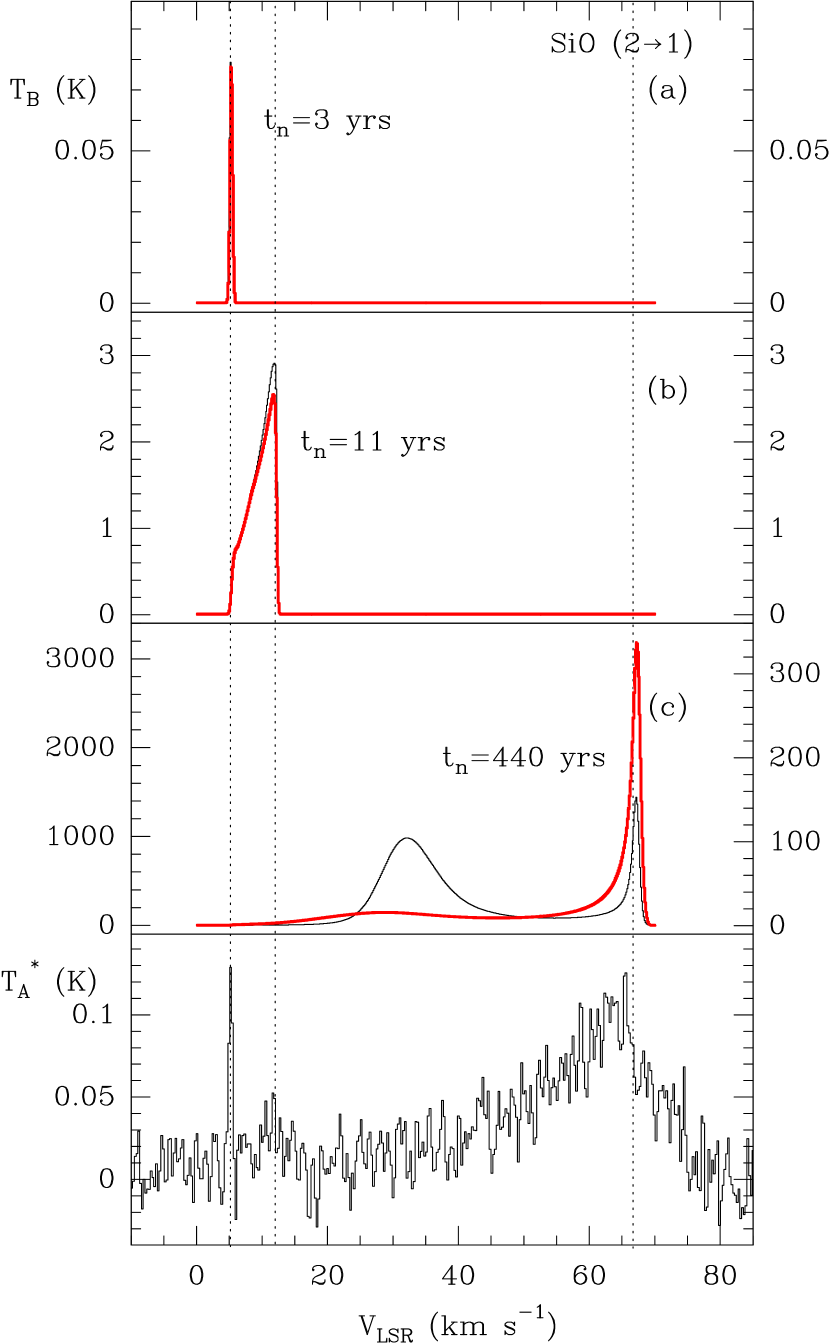
The line profiles calculated across our parametric C-shock structure also suggest that the moderate and high velocity SiO components observed toward L1448-mm are linked to later stages in the evolution of the shock. In Fig. 4, we show the comparison between the full SiO line profile in L1448-mm (lower panel), and the SiO line emission predicted for a shock with =70 km s-1 and =105 cm-3 at three different evolutionary stages (black solid lines). The narrow SiO emission is exactly the same as that shown in panel (a) of Fig. 3 for =3 yrs, and the moderate velocity component is reproduced by a C-shock at =11 yrs. We note that the discrete nature of these two components is a direct consequence of the assumed chemical structure of dust grains: icy mantles surrounding the silicate/graphite cores, which have different binding energies (of 0.53 eV and 50 eV for the mantles and the cores, respectively; see Tielens et al., 1994; May et al., 2000). The high velocity gas emission is matched with a C-shock at =440 yrs.
Although the model fails to reproduce the peak intensity of the moderate and high velocity SiO components, the line shapes are qualitatively similar to those observed in L1448-mm. At =440 yrs, however, the moderate velocity emission shows an excess in intensity which is difficult to match with the observations. The facts that depletion of Si/SiO onto dust grains and/or that silicon gas-phase chemistry have not been taken into account in our model, could explain these discrepancies. Including the depletion rate of Tielens & Hollenbach (1985, see Eq. 4 in this work) with a sticking coefficient of 1, the depletion of SiO onto dust grains reduces the abundance of this molecule by a factor of 1.2 for intermediate flow times and by a factor of 5 in the far postshock gas. More dramatically, the conversion of silicon into SiO via gas-phase reactions with OH and O2 (e.g. Si+OH SiO+H and Si+O2 SiO+O) is known to be not 100% efficient for high densities (of =105-106 cm-3), for which OH and O2 are partially destroyed by the atomic hydrogen generated in the shock (Gusdorf et al., 2008). This may lead to significantly lower SiO abundances (by more than 1 order of magnitude; see Gusdorf et al., 2008) than those obtained directly from the sputtering of dust grains.
If we now consider that the gas-phase abundance of SiO cannot exceed 10-6 (note that this is the maximum SiO abundance estimated in L1448-mm; see Martín-Pintado et al., 1992), the SiO line profile derived at =440 yrs mimics the emission observed toward this outflow (see red solid line in panel (c) of Fig. 4). The decrease of the gas-phase abundance of SiO does not largely affect the SiO lines calculated for the precursor and moderate velocity components at =3 and 11 yrs, because the grain core sputtering is not efficient enough to inject SiO abundances larger than 10-6 (see panels (a) and (b) in Fig. 4). Beam filling factor corrections could also account for the different peak intensities obtained from the model for the moderate and high velocity emission of SiO, assuming that both components show different spatial extents. High-angular resolution observations with interferometers such as the PdBI and the SMA, are therefore strongly required not only to better constrain the initial conditions and the evolutionary stage of the different shocks suggested by the model, but also the chemical properties of the dust grains present in this star forming region.
Finally, shock velocities of 70 km s-1 clearly exceeds the critical velocities of C-shocks (of 45-50 km s-1; Draine et al., 1983). Le Bourlot et al. (2002) have shown that these critical velocities can be increased to few 100 km s-1 for moderate H2 densities and high magnetic fields (of few ) as those observed toward low mass star forming regions such as NGC1333 (Girart et al., 2006). However, we cannot rule out the possibility that the high velocity SiO emission toward L1448-mm is associated with a J-type discontinuity within the postshock gas in this outflow (Chièze, Pineau des Forêts & Flower, 1998).
In summary, we have modelled for the first time the expected evolution of the line profiles of SiO, H13CO+ and HN13C as C-shocks propagate through the ambient medium. The model suggests that the narrow SiO emission and the ion enhancement found in the young shocks of the L1448-mm outflow, are signatures of the magnetic precursor of C-shocks. The different velocity components (precursor, moderate velocity and high velocity gas) observed toward this outflow could be explained by the coexistence of C-shocks with =70 km s-1 at different evolutionary stages within the single-dish beam of the SiO observations. The model will be used in the future to reproduce the molecular line emission observed toward a sample of molecular outflows under different physical conditions and different evolutionary stages.
References
- Belin et al. (1996) Belin, F., Maurer, J., Tabeling, P., Willaime, H. 1996, J. Physique II 6, 573
- Cabrit et al. (2007) Cabrit, S., Codella, C., Gueth, F., Nisini, B., Gusdorf, A., Dougados, C., & Bacciotti, F. 2007, A&A, 468, L29
- Caselli et al. (1997) Caselli, P., Hartquist, T. W., & Havnes, O. 1997, A&A, 322, 296
- Caselli et al. (1998) Caselli, P., Walmsley, C. M., Terzieva, R., & Herbst, E. 1998, ApJ, 499, 234
- Chièze, Pineau des Forêts & Flower (1998) Chièze, J.-P., Pineau des Forêts, G., & Flower, D. R. 1998, MNRAS, 295, 672
- Dayou & Balança (2006) Dayou, F., & Balança, C. 2006, A&A, 459, 297
- Draine (1980) Draine, B. T. 1980, ApJ, 241, 1021
- Draine et al. (1983) Draine, B. T., Roberge, W. G., & Dalgarno, A. 1983, ApJ, 264, 485
- Dutrey, Guilloteau & Bachiller (1997) Dutrey, A., Guilloteau, S., & Bachiller, R. 1997, A&A, 325, 758
- Flower & Pineau des Forêts (1995) Flower, D. R., & Pineau des Forets, G. 1995, MNRAS, 275, 1049
- Flower et al. (1996) Flower, D. R., Pineau des Forêts, G., Field, D., & May, P. W. 1996, MNRAS, 280, 447
- Gerin et al. (2008) Gerin, M., Goicoechea, J.R., Pety, J., & Hily-Blant, P. 2008, A&A, in press
- Girart & Acord (2001) Girart, J. M., & Acord J. M. P. 2001, ApJ, 552, L63
- Girart et al. (2006) Girart, J. M., Rao, R., & Marrone, D. P. 2006, Science, 313, 812
- Gusdorf et al. (2008) Gusdorf, A., Cabrit, S., Flower, D. R., & Pineau des Forêts 2008, A&A, 482, 809
- Huber & Herzberg (1979) Huber, K. P. & Herzberg, G. 1979, in Molecular Spectra and Molecular Structure IV. Constants of Diatomic Molecules. New York: Van Nostrand Reinhold
- Jimenez (1997) Jimenez, J. 1997, in Dynamics and statistics of concentrated vortices in turbulent flows, Euromech Coll. 384
- Jiménez-Serra et al. (2004) Jiménez-Serra, I., Martín-Pintado, J., Rodríguez-Franco, A., & Marcelino, N. 2004, ApJ, 603, L49
- Jiménez-Serra et al. (2005) Jiménez-Serra, I., Martín-Pintado, J., Rodríguez-Franco, A., & Martín, S. 2005, ApJ, 627, L121
- Jiménez-Serra et al. (2006) Jiménez-Serra, I., Martín-Pintado, J., Viti, S., Martín, S., Rodríguez-Franco, A., Faure, A., & Tennyson, J. 2006, ApJ, 650, L135
- Jiménez-Serra et al. (2008) Jiménez-Serra, I., Caselli, P., Martín-Pintado, J., & Hartquist, T. 2008, A&A, 482, 549
- Joulan et al. (1998) Joulain, K., Falgarone, E., Pineau des Forêts, G., & Flower, D. 1998, A&A, 340, 241
- Kaufman & Neufeld (1996) Kaufman, M. J., & Neufeld, D. A. 1996, ApJ, 456, 250
- Le Bourlot et al. (2002) Le Bourlot, J., Pineau des Forêts, G., Flower, D. R., & Cabrit, S. 2002, MNRAS, 332, 985
- Lefloch et al. (1998) Lefloch, B., Castets, A., Cernicharo, J., & Loinard, L. 1998, ApJ, 504, L109
- Lesaffre et al. (2004) Lesaffre, P., Chièze, J.-P., Cabrit, S., & Pineau des Forêts, G. 2004, A&A, 427, 147
- Markwick, Millar & Charnley (2000) Markwick, A. J., Millar, T. J., & Charnley, S. B. 2000, ApJ, 535, 256
- Martín-Pintado et al. (1992) Martín-Pintado, J., Bachiller, R., & Fuente, A. 1992, A&A, 254, 315
- May et al. (2000) May, P. W., Pineau des Forêts, G., Flower, D. R., Field, D., Allan, N. L., & Purton, J. A. 2000, MNRAS, 318, 809
- Myers & Goodman (1988) Myers, P.C., & Goodman, A. A. 1988, ApJ, 329, 392
- Nisini et al. (2007) Nisini, B., Codella, C., Giannini, T., Santiago Garcia, J., Richer, J. S., Bachiller, R., & Tafalla, M. 2007, A&A, 462, 163
- Flower & Pineau des Forêts (2003) Flower, D. R., & Pineau des Forêts, G. 2003, MNRAS, 343, 390
- Requena-Torres et al. (2007) Requena-Torres, M. A., Marcelino, N., Jiménez-Serra, I., Martín-Pintado, J., Martín, S., & Mauersberger, R. 2007, ApJ, 655, L37
- Schenewerk et al. (1988) Schenewerk, M. S., Jewell, P. R., Snyder, L. E., Hollis, J. M., & Ziurys, L. M. ApJ, 328, 785
- Schilke et al. (1997) Schilke, P., Walmsley, C. M., Pineau des Forêts, G., & Flower, D. R. 1997, A&A, 321, 293
- Schilke et al. (2001) Schilke, P., Pineau des Forêts, G., Walmsley, C. M. & Martín-Pintado, J. 2001, A&A, 372, 291
- Schöier et al. (2005) Schöier, F. L., van der Tak, F. F. S, van Dishoeck, E. F., & Black, J. H. 2005, A&A, 432, 369
- Tielens & Hollenbach (1985) Tielens, A. G. G. M., & Hollenbach, D. 1985, ApJ, 291, 722
- Tielens et al. (1994) Tielens, A. G. G. M., McKee, C. F., Seab, C. G., & Hollenbach, D. J. 1994, ApJ, 431, 321
- Walmsley, Pineau des Forêts & Flower (1999) Walmsley, C. M., Pineau des Forêts, G., & Flower, D. R. 1999, A&A, 342, 542
- Ziurys, Friberg & Irvine (1989) Ziurys, L. M., Friberg, P., & Irvine, W. M. 1989, ApJ, 343, 301