Heavy Quark Production at HERA \runauthorIan C. Brock
Heavy Quark Production at HERA
Abstract
Heavy flavour production is one of the key components of the HERA II physics programme. While most of the results presented use leptons or the reconstruction of charmed mesons to identify heavy flavour production, both the H1 and ZEUS experiments now have working microvertex detectors that are being used more and more. In this talk I will summarise a selection of the recent results obtained by the two collaborations.
1 Introduction
The study of heavy flavour production at HERA provides an important test of perturbative Quantum Chromodynamics (pQCD) and also valuable information for the measurements to be made at the LHC. I will discuss a small selection of the many measurements of heavy flavour production that have been made at HERA, concentrating on the more recent results.
HERA running started in 1992 and the accelerator stopped running at the end of June 2007. HERA collided 27.5 GeV electrons or positrons111Hereafter unless explicitly stated both electrons and positrons are referred to as electrons. with 920 GeV (820 GeV until the end of 1997) protons, giving a centre-of-mass energy of 318 GeV. A long shutdown in 2000 and 2001 was used to upgrade the machine and the detectors, with the aim of increasing the luminosity by about a factor of 4. The period up to 2000 is usually called HERA I and after 2001 HERA II. By the end of the running both of the colliding beam experiments, H1 and ZEUS, had collected about 0.5 fb-1 of data.
Several kinematic variables are used to characterise the scattering process:
-
•
, the negative squared four-momentum exchanged at the electron or positron vertex;
-
•
, the Bjorken scaling variable;
-
•
, the inelasticity;
-
•
, the invariant mass of the hadronic final state.
The measurements are usually separated into the deep inelastic scattering (DIS), , or photoproduction, , regimes, depending on whether the scattered electron is detected in the in the main calorimeter or not.
The main production mechanism for heavy quarks is the so-called Boson Gluon Fusion (BGF) process which is illustrated in Figure 1.
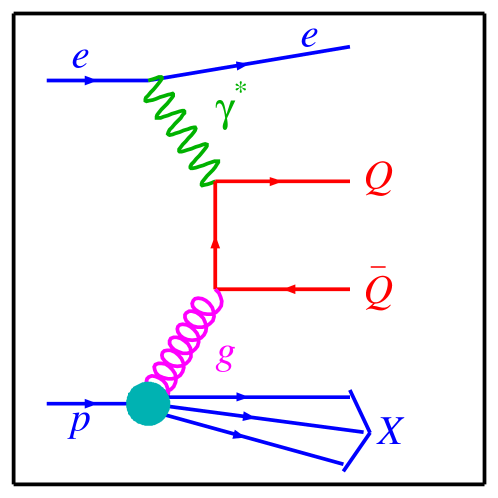
In practice higher order contributions also have to be taken into account. The photon can fluctuate into a pair and one of the quarks then participates in the hard interaction (resolved photoproduction); or in so-called excitation the scattering from charm or beauty can take place with intrinsic charm or beauty inside the proton or photon. Monte Carlo models usually include these process in addition to the direct boson-gluon fusion. These higher order processes are also sometimes referred to collectively as non-direct.
Next-to-leading oder (NLO) QCD calculations exist for heavy quark production at HERA. These are implemented for photoproduction in the FMNR programme [1, 2] and for DIS in the HVQDIS programme [3]. The programmes include simple independent fragmentation of the or quark, but on their own are not able to give predictions for correlations between final-state particles. The FMNR programme has been interfaced [4] to the Pythia Monte Carlo and its predictions have been used for studies of dimuon final states.
Most heavy flavour measurements rely on the central tracking detectors and are helped significantly by the presence of a microvertex detector. H1 had such a detector for some of the HERA I running, while both ZEUS and H1 had such detectors for the HERA II running period.
Several different methods have been used by the collaborations to identify the production of heavy quarks. Each of them has its advantages and disadvantages and often cover different kinematic ranges. Traditionally the identification of mesons and semileptonic decays have been used most often. With the advent of microvertex detectors lifetime information is being used more and more often. This works best for events with high energy jets, while tagging with semileptonic decays to electrons or double tags enables one to go to lower transverse momenta.
2 Production
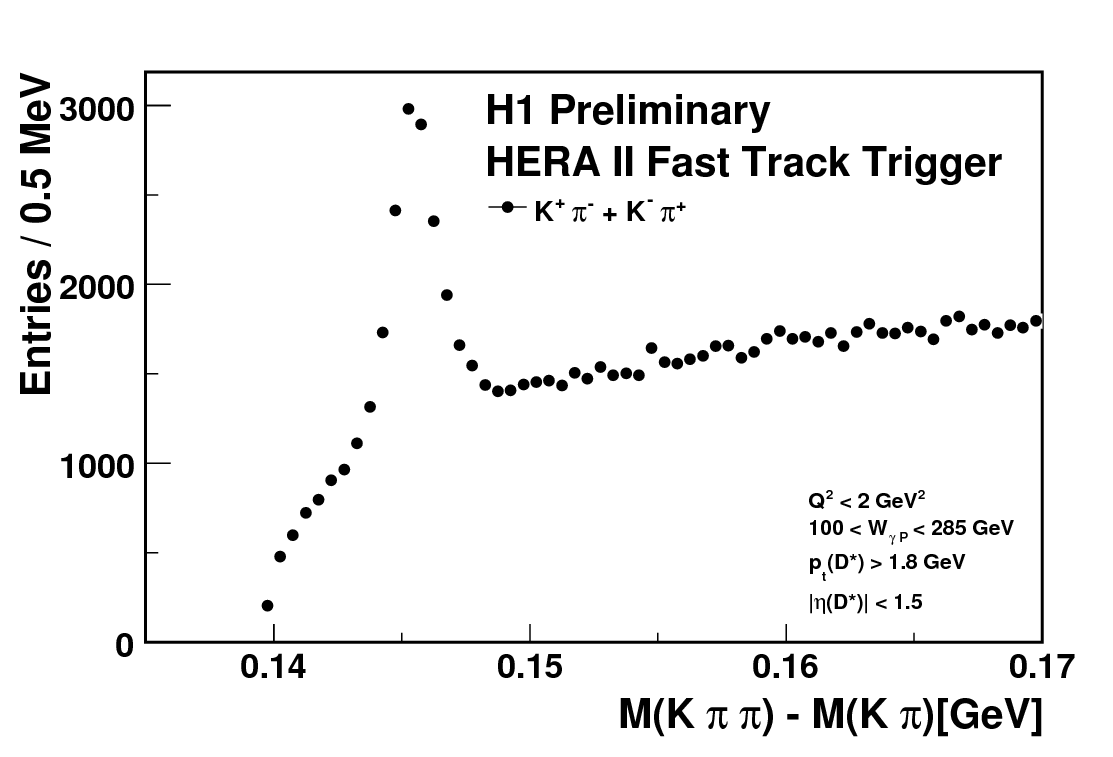
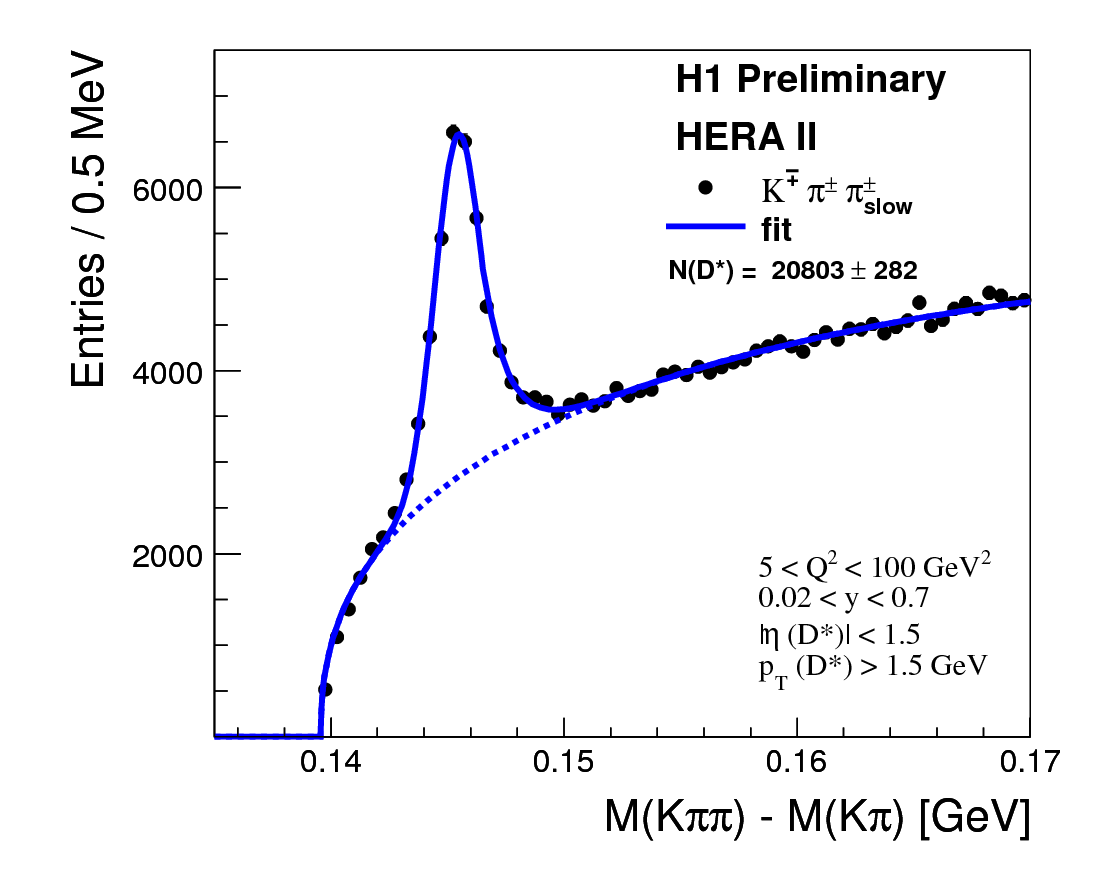
The H1 collaboration has made a series of measurements of production both in the photoproduction [5] (96 pb-1 of data taken in 2006 and 2007) and the DIS [6] (347 pb-1 from the HERA II running period) regimes. For these measurements they make use of their new Fast Track Trigger, which enables events with candidates to be selected early in the trigger chain. In both photoproduction and DIS clear signals are seen as illustrated in Figure 2. The kinematic cuts are indicated in the figures.
Differential cross-sections as a function of a wide range of variables have been determined. The cross-section as a function of is shown in Figure 3.
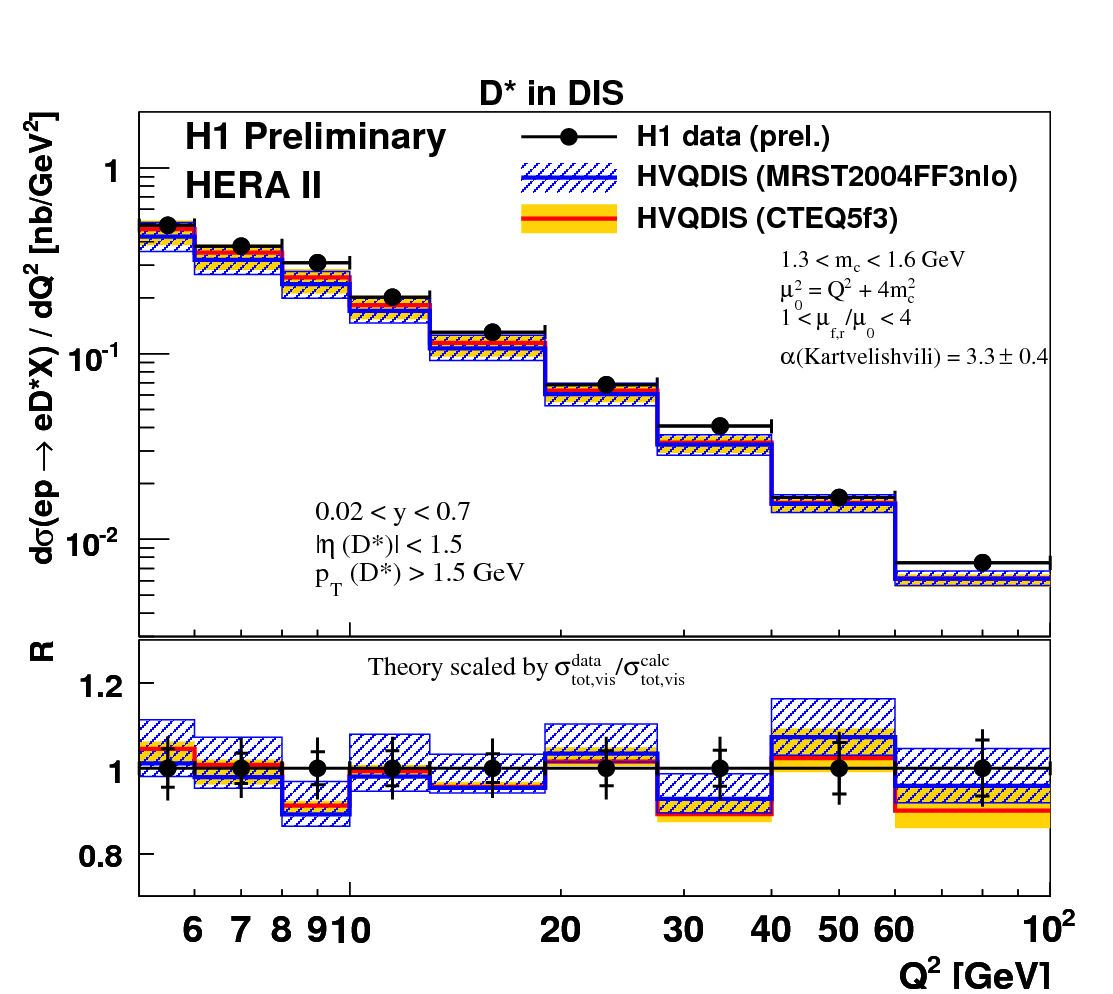
The measurements are compared to the predictions of the HVQDIS programme using two different Parton Distribution Functions (PDF). The different PDFs show a very similar behaviour as a function of .
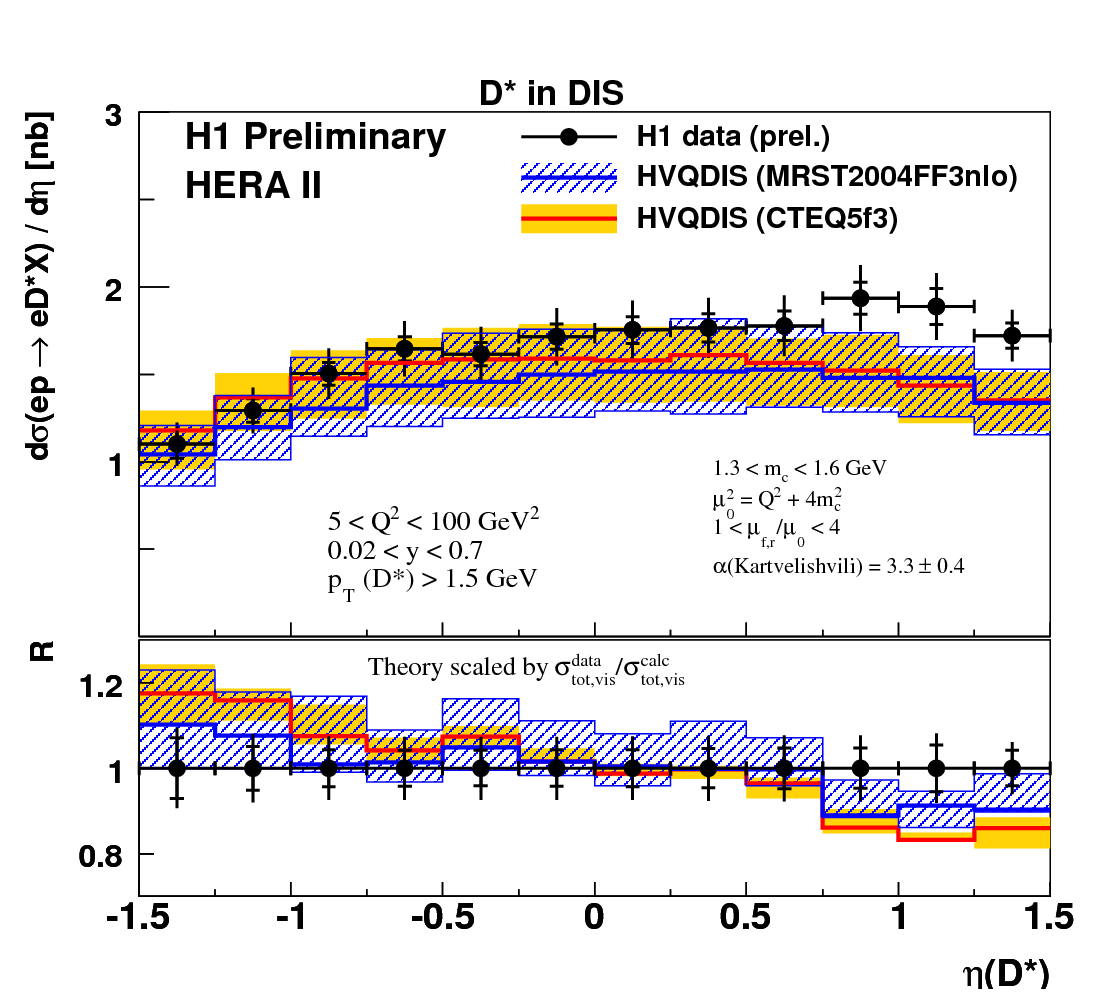
In contrast the cross-section as a function of the pseudorapidity, , shows a clear dependence (see Figure 4), demonstrating the sensitivity of charm production to the gluon structure function.
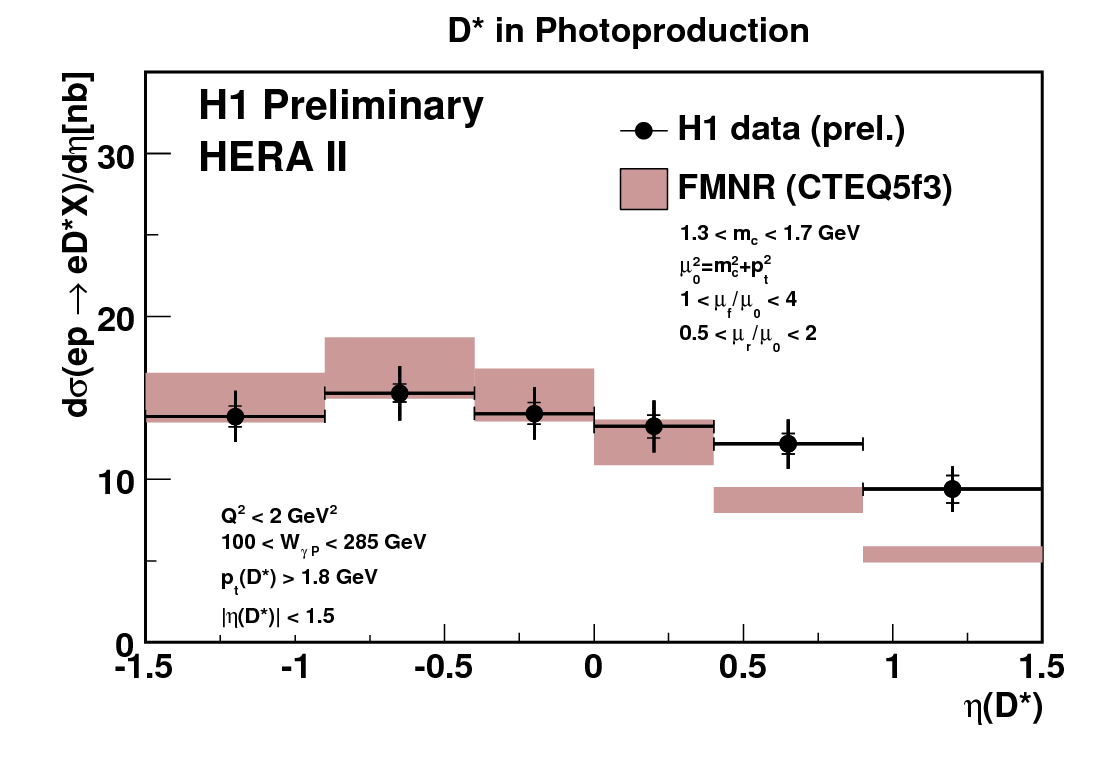
Making the same comparison for photoproduction one sees that the NLO QCD prediction underestimates the data in the forward direction (see Figure 5).
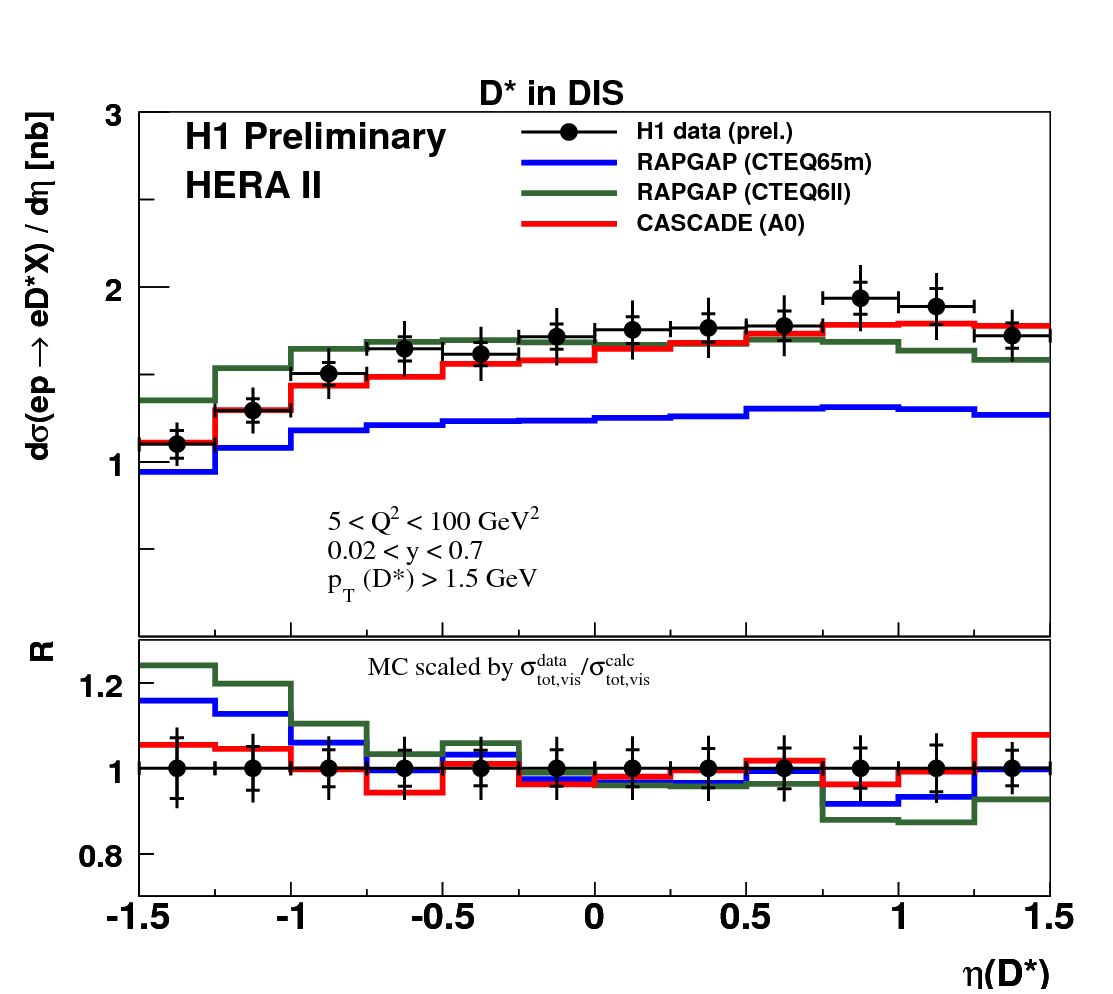
Comparing the data to Monte Carlo predictions, the Cascade generator, which is based upon -factorisation, is able to provide a better description of the data in DIS than RAPGAP with two different PDFs (see Figure 6).
However, in photoproduction Pythia, using the massless scheme for the generation of the heavy quarks, provides the best description of the data, while Cascade and Pythia in the massive mode both undershoot the data in the forward direction.
3 Beauty in Photoproduction
The ZEUS collaboration recently reported two new measurements of -quark production in photoproduction. The first measurement uses semileptonic decays to muons [7] to identify heavy quark decays, while the second one uses electrons [8]. Dijet events are selected by requiring at least two jets with and a transverse momentum (muon measurement) or energy (electron measurement) greater than 7 GeV for the highest transverse energy and 6 GeV for the 2nd highest transverse energy jet.
The first measurement uses 124 pb-1 of data collected in 2005 and requires a well identified muon with and . The microvertex detector is used to measure the impact parameter () of identified muons. This is combined with the transverse momentum of the muon with respect to the jet axis () to separate -quark events from background. The cross-sections as a function of the transverse momentum and pseudorapidity of the muon are shown in Figures 7 and 8.
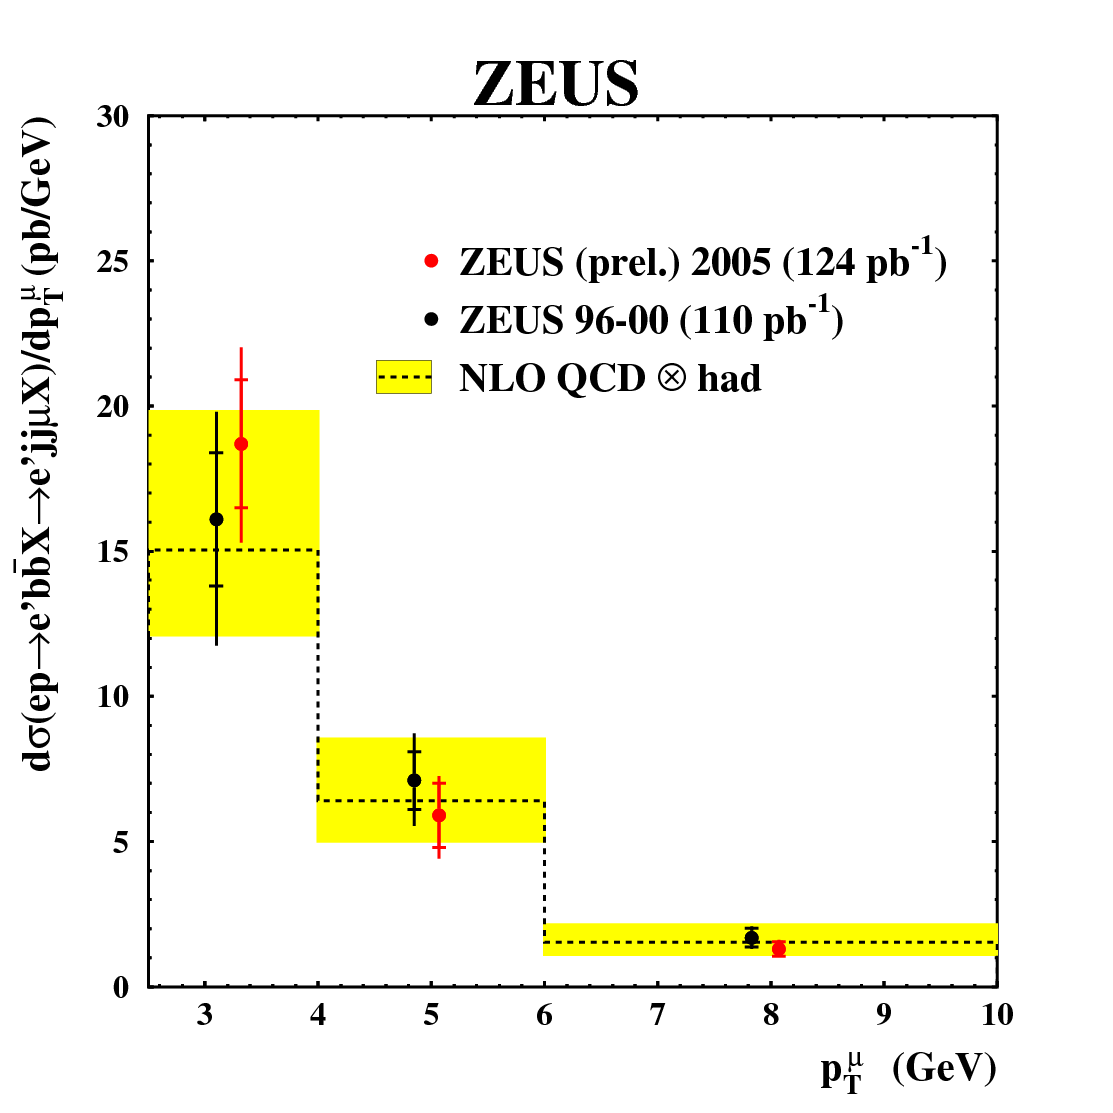
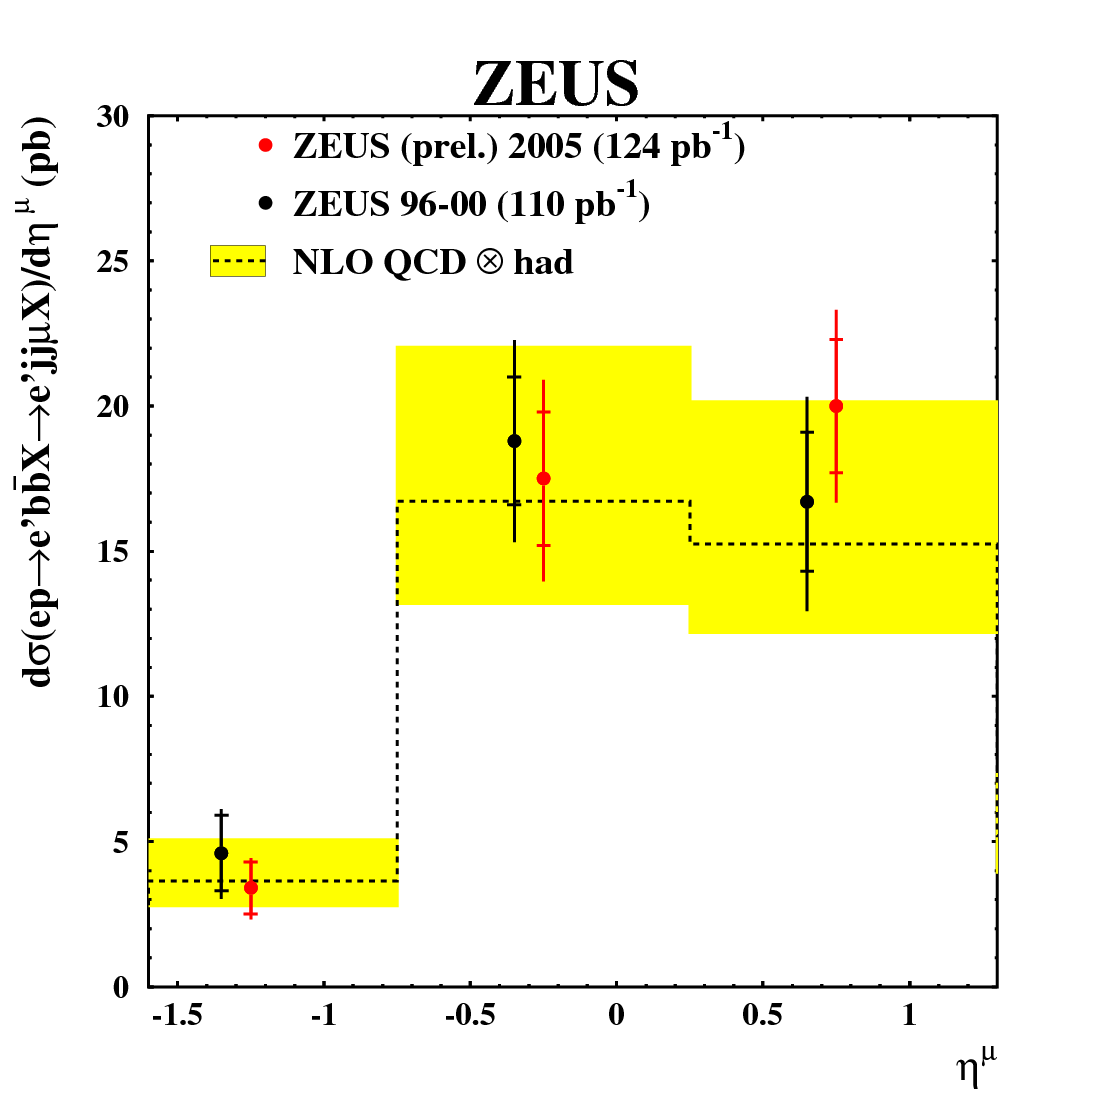
Both the charm and beauty contributions are left free in the fit. The figures also show the results of an analysis using the HERA I data [9], which only used for separation. For this earlier analysis the charm content was fixed. Good agreement between the analyses is seen. The predictions of the NLO QCD prediction are also in good agreement with the data.
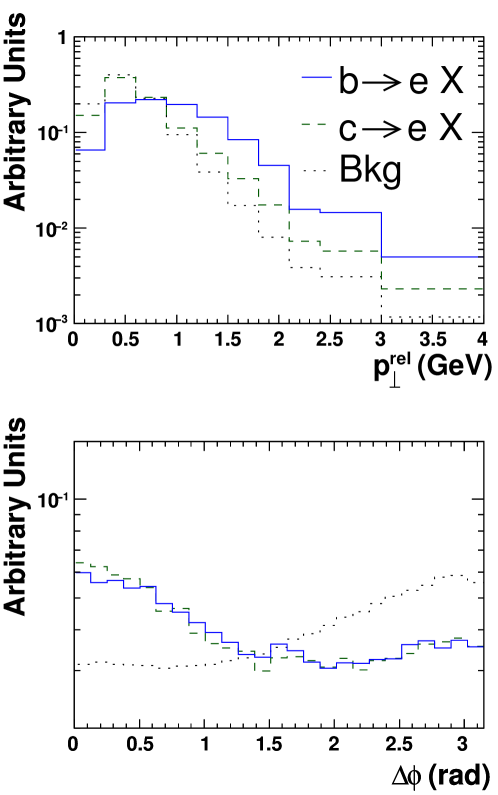
The second measurement identifies electrons from the semileptonic decays of heavy quarks using an integrated luminosity of 120 pb-1 collected during the HERA I running period. Electron identification uses the measurement of the specific energy loss, , in the Central Tracking Detector, CTD, the fraction of the energy deposited in the electromagnetic calorimeter as well as the ratio of the energy deposited in the calorimeter to the momentum measured in the tracking detectors. Semileptonic decays are separated from background using and the azimuthal angle between the electron direction and the missing transverse momentum vector, . As illustrated in Figure 9, can separate -quark from -quark decays, while separates semileptonic decays from background.
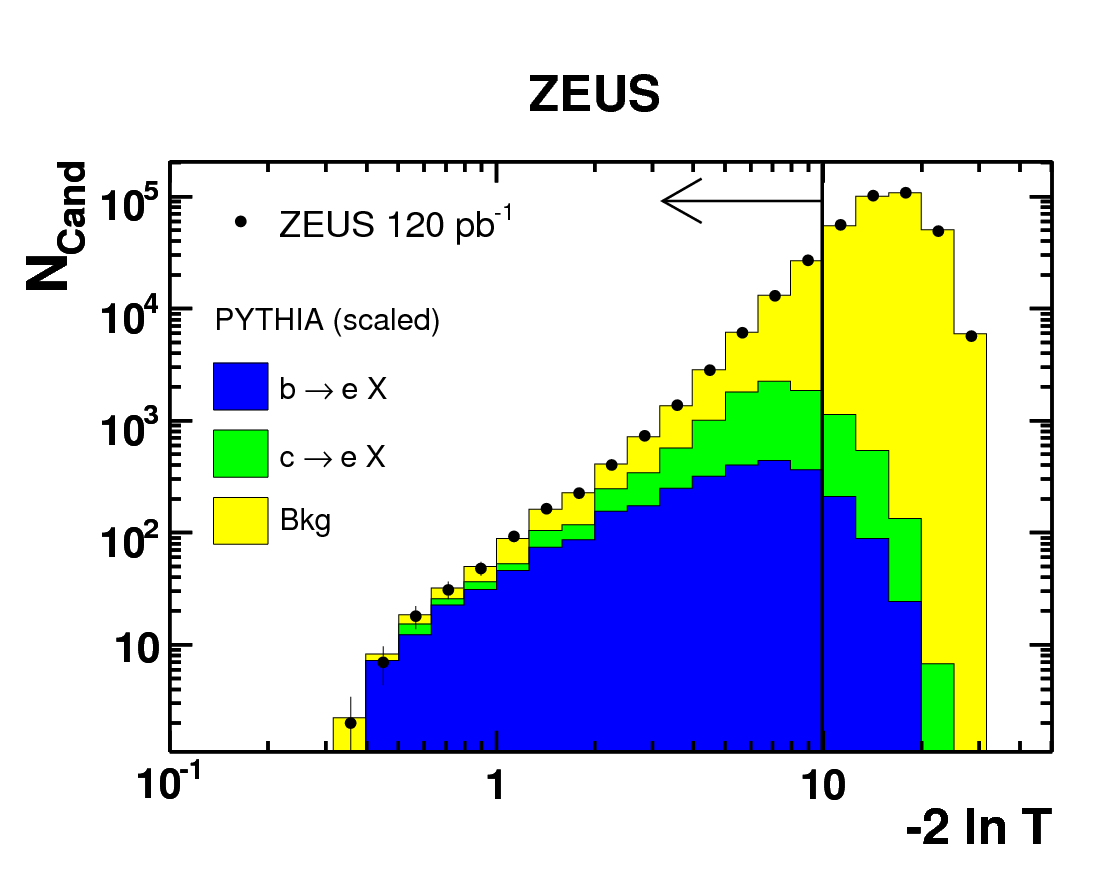
The variables are combined using a likelihood ratio method, which is optimised for the identification of electrons from semileptonic -quark decays. The distribution of the likelihood ratio is shown in Figure 10. The distribution is fit using the expected distributions for beauty, charm and background to determine the fractions of events from each source. The fit provides a very good description of the data.
The visible cross sections (at hadron level) for -quark and -quark production and the subsequent semileptonic decay to an electron with in the range in photoproduction events with and and at least two jets with , were determined separately for and . For the complete data set () the cross-sections evaluated at are
These cross-sections are in agreement with the corresponding NLO QCD predictions:
The cross-sections as a function of the transverse momentum and pseudorapidity of the electron are shown in Figure 11.
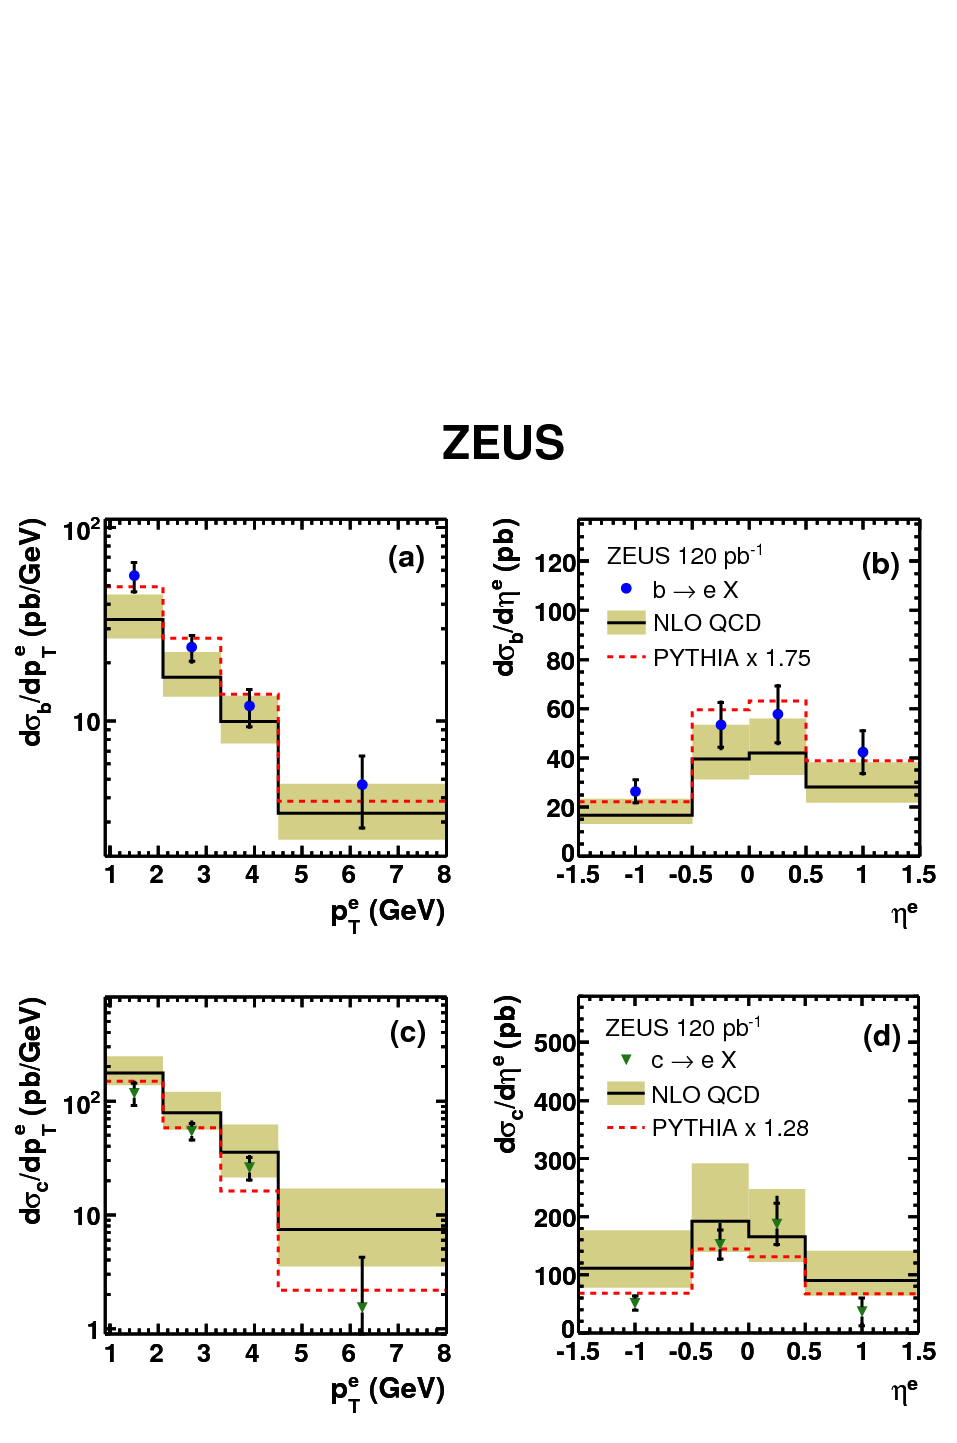
Good agreement with the NLO QCD prediction is seen. The data also agree well with the Pythia prediction scaled by a factor of 1.75 for -quark production and 1.28 for -quark production.
4 Beauty Correlations
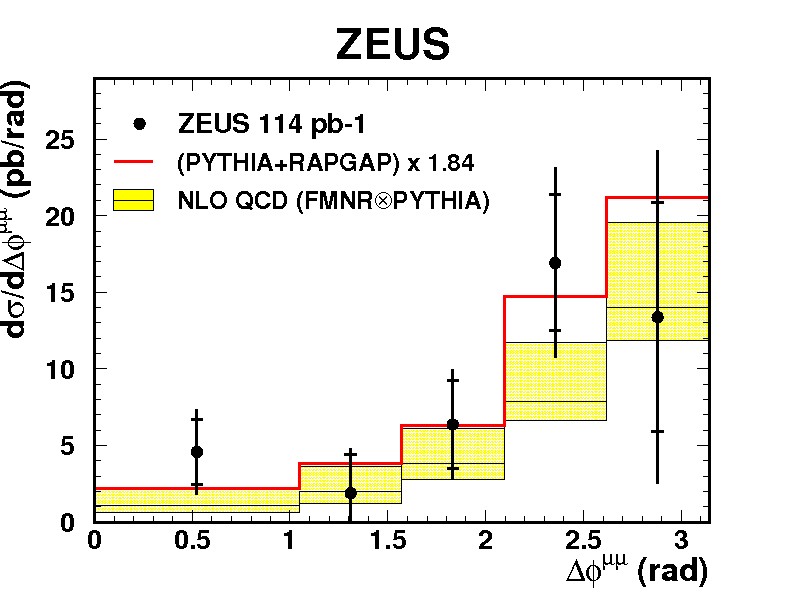
The identification of both heavy-quark decays in an event has several advantages: the background is reduced substantially and the kinematic range accessible is larger. The disadvantage is a significant reduction of statistics. If both -quark jets can be identified, dijet correlations can be directly measured which probe next-to-leading order effects. The ZEUS collaboration used the HERA I data sample to select events with and two identified muons [10]. Separating the samples according to the relative charge of the muons as well as their invariant mass allows much of the background to be evaluated directly from the data.
The extracted cross-section is shown in Figure 12. It is compared with the NLO QCD prediction as well as with a leading order Monte Carlo. Given the limited statistics it is not possible to say whether the NLO calculation provides a better description of the data.
5 and
The H1 collaboration have used the impact parameter significance to determine and for and using 56 pb-1 of data taken in 2006 [11]. The distribution of the impact parameter in the transverse plane is shown in Figure 13.
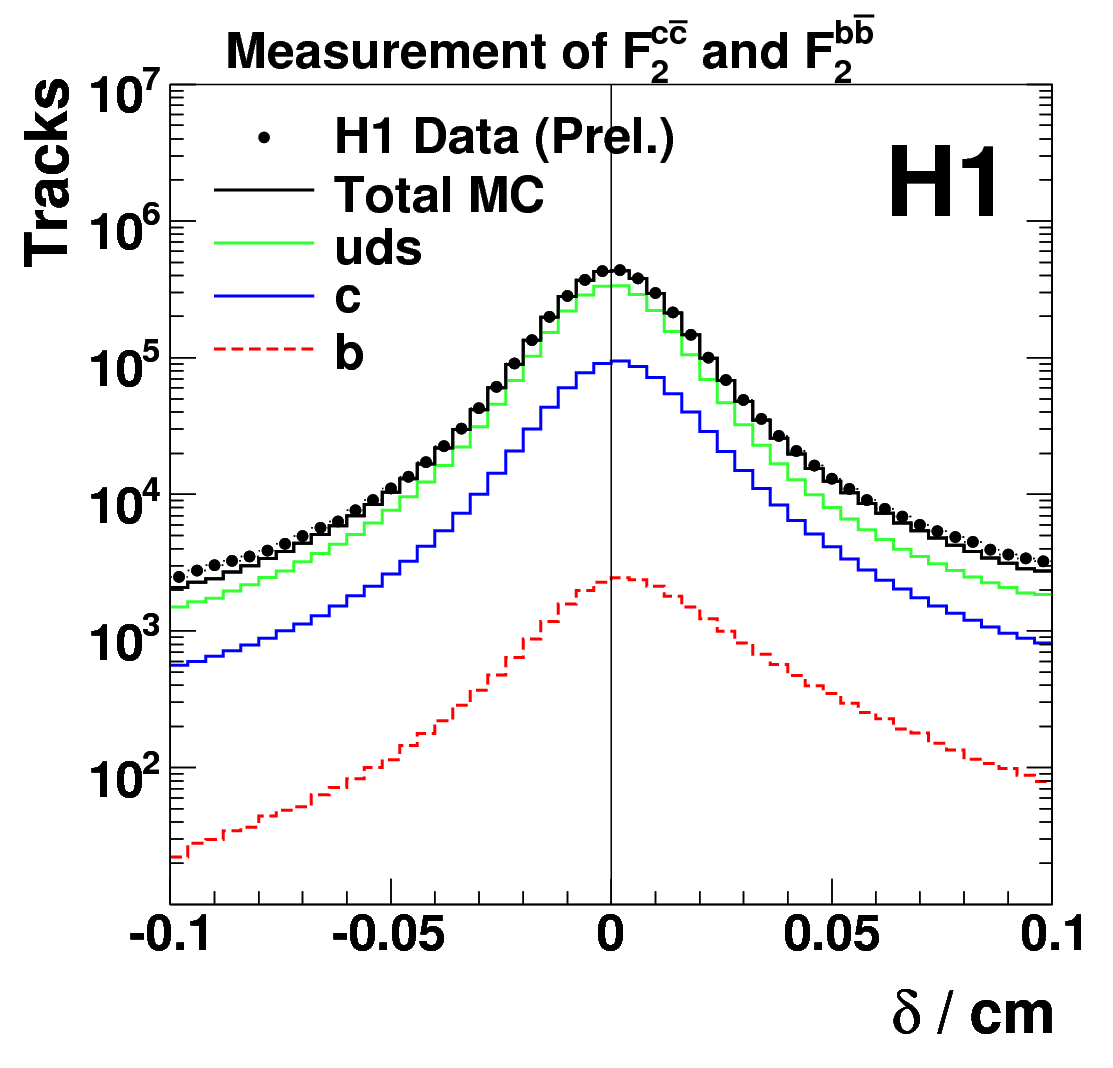
In order to separate beauty and charm from background the two tracks with the most significant impact parameters ( and respectively) are selected, rejecting events where the signs of the impact parameters differ. The significance is defined as , where is the error on . Events with one good track are used to make the distribution; all other events are used for the distribution.
The contents of the negative significance bins are subtracted from the corresponding positive significance bins. This yields the distribution of shown in Figure 14.
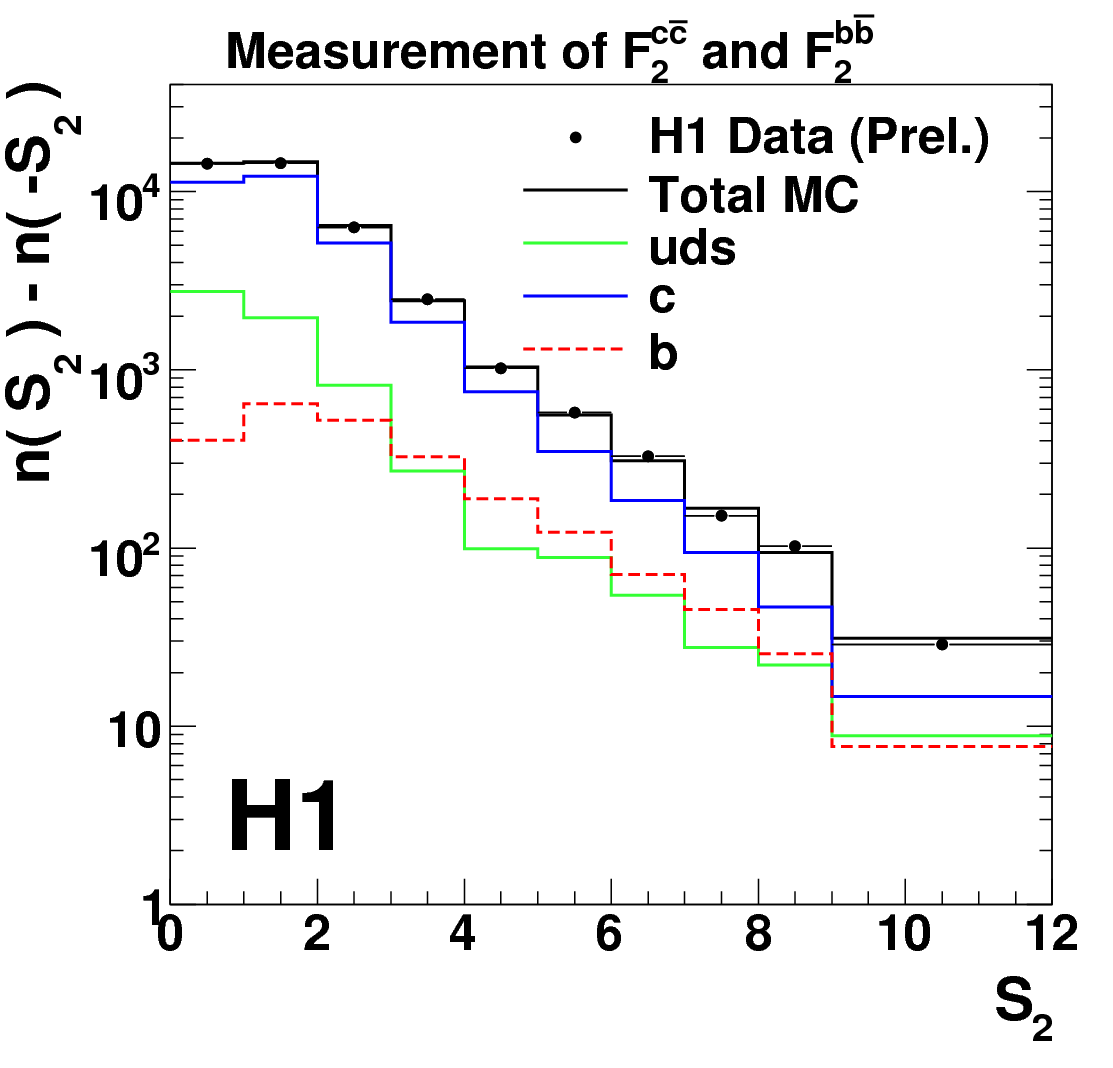
The charm contribution dominates the distribution. At high significance the beauty contribution becomes larger. The data are split into bins in and and the contributions of beauty and charm are determined separately in each bin using a least squares simultaneous fit to the and distributions. The overall normalisation is determined by also including in the fit the total number of inclusive events without any cut on the impact parameter significance. The results of the fit in each bin are converted to a “reduced cross-section” using
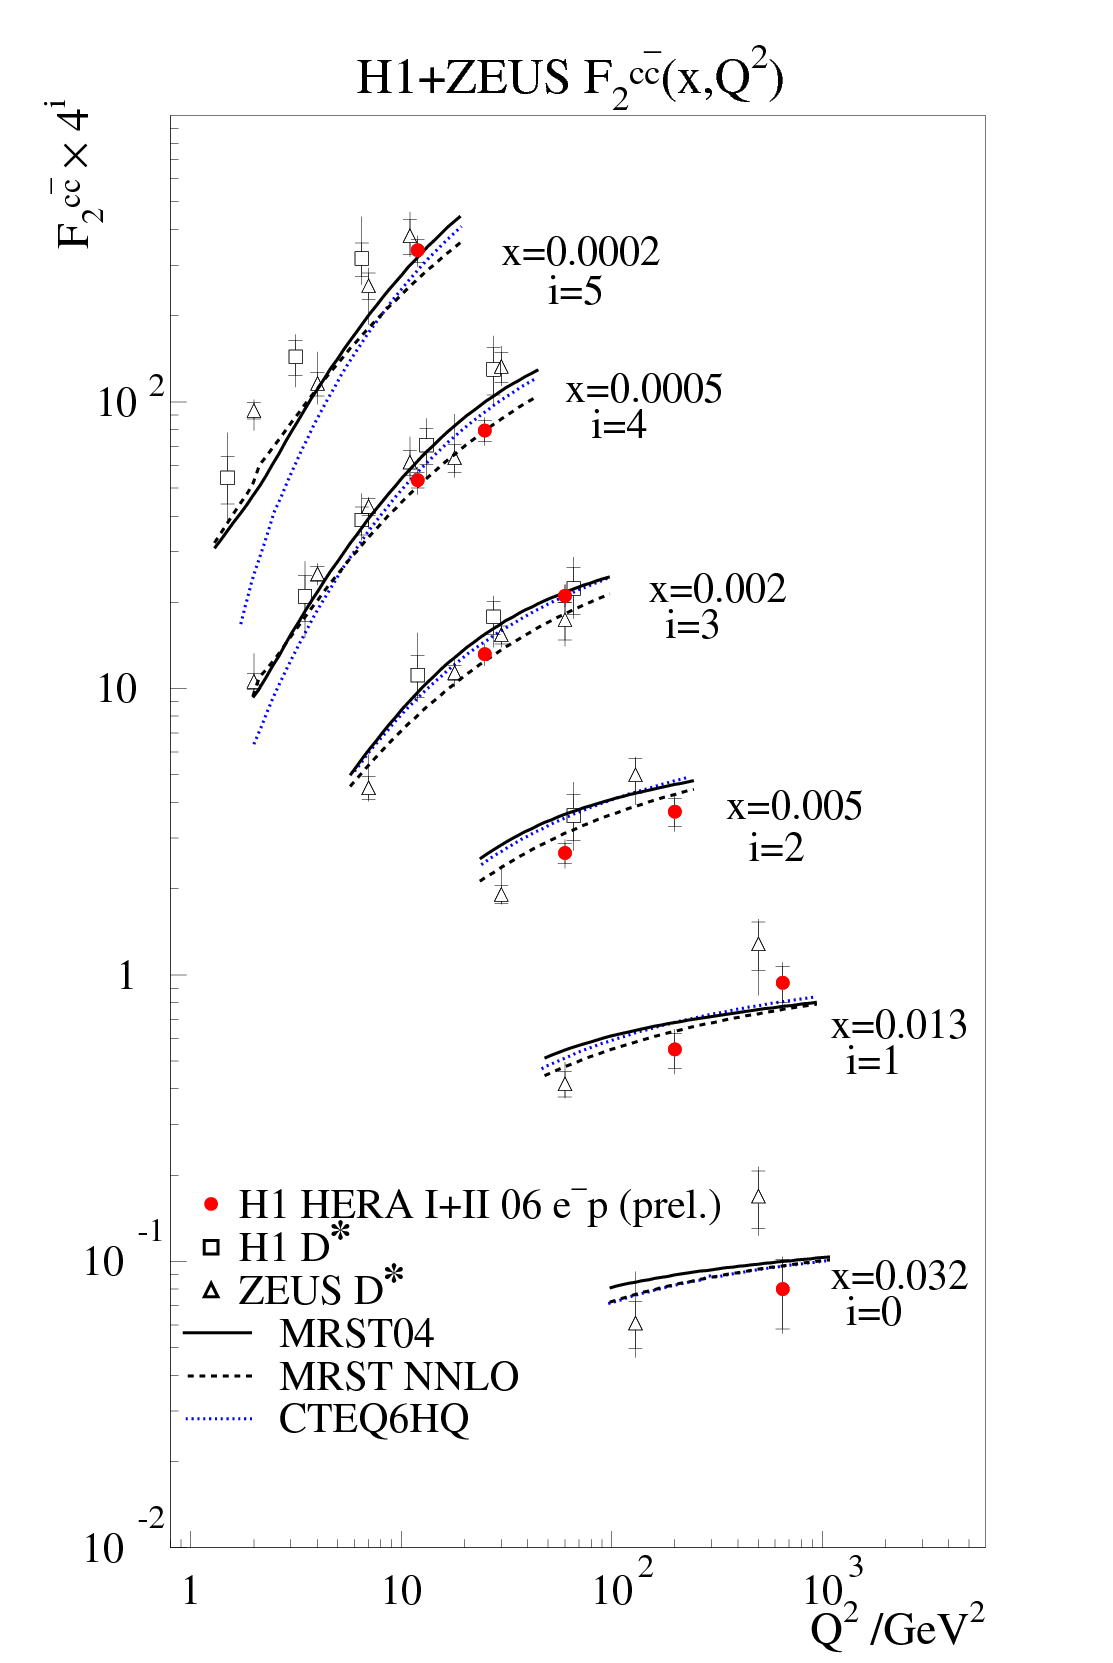
The reduced cross section for production as a function of in different bins is shown in Figure 15.
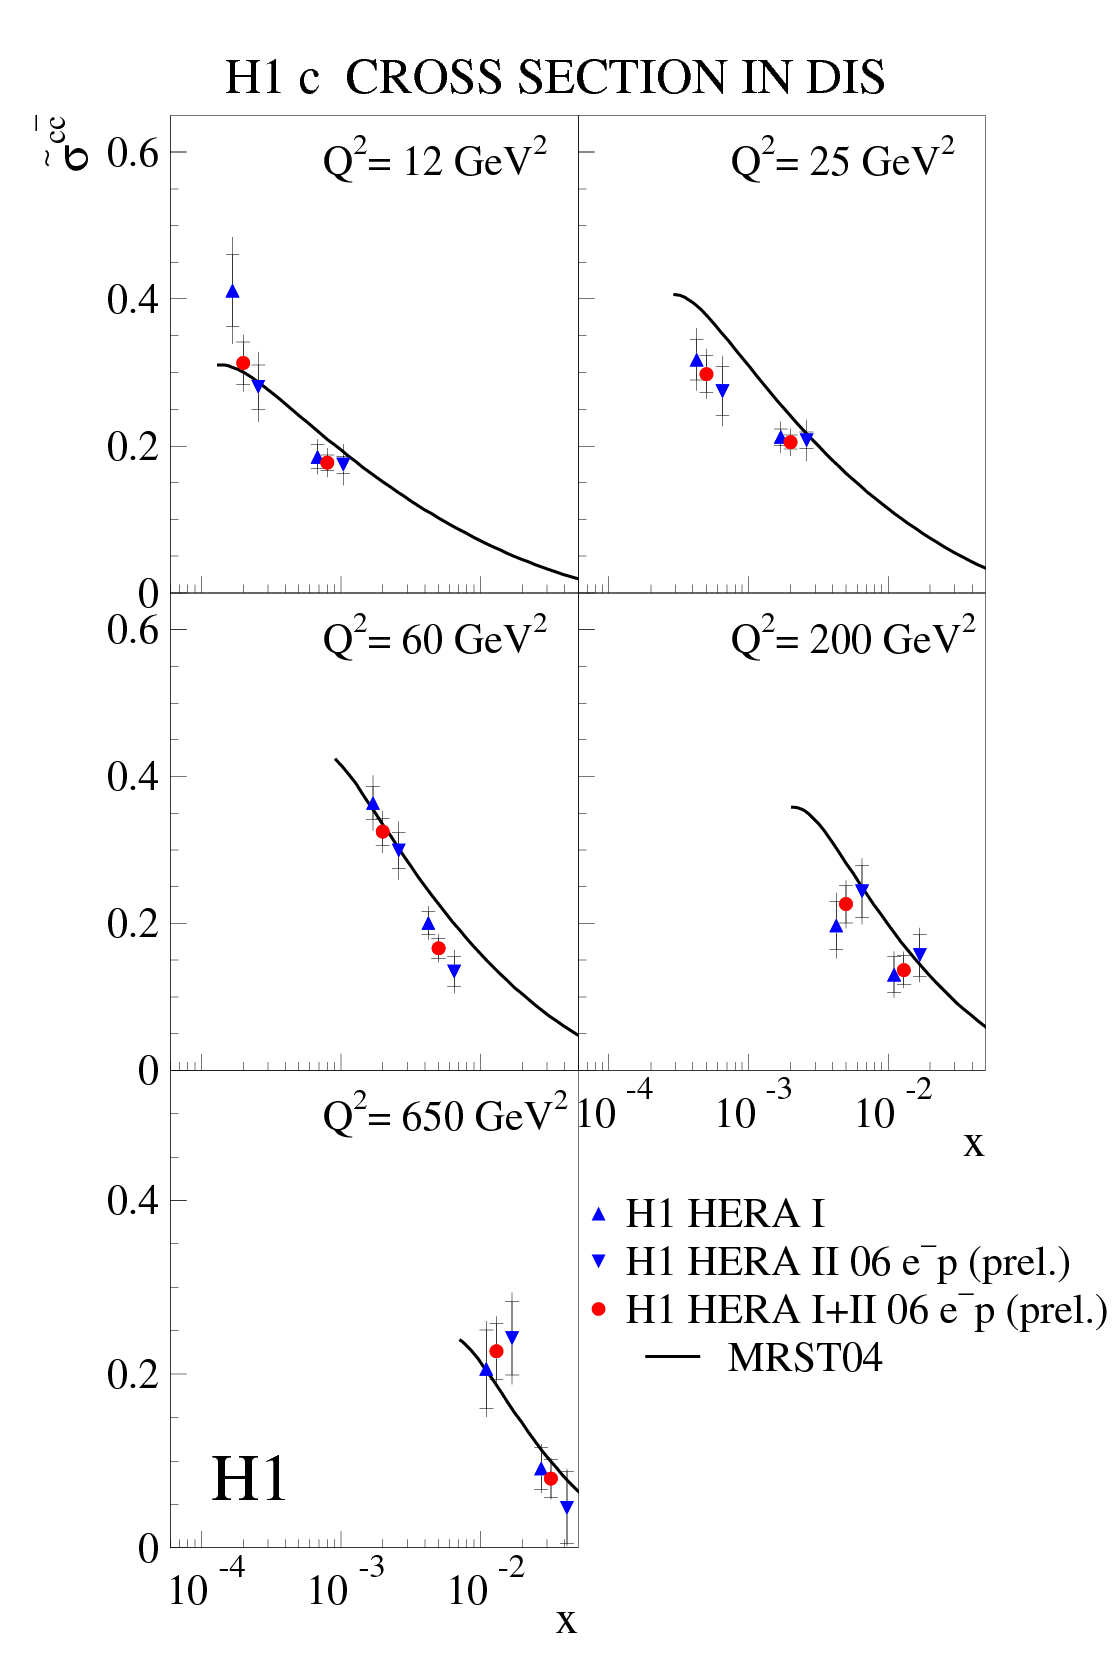
Measurements made with the HERA I data in the same kinematic range are also shown in the figure. The results are in good agreement with each other and can be combined, taking into account the correlated systematic errors. The prediction using the Variable Flavour Number Scheme (VFNS) in the MRST04 PDF agrees well with the data.
From the reduced cross-section can be extracted:
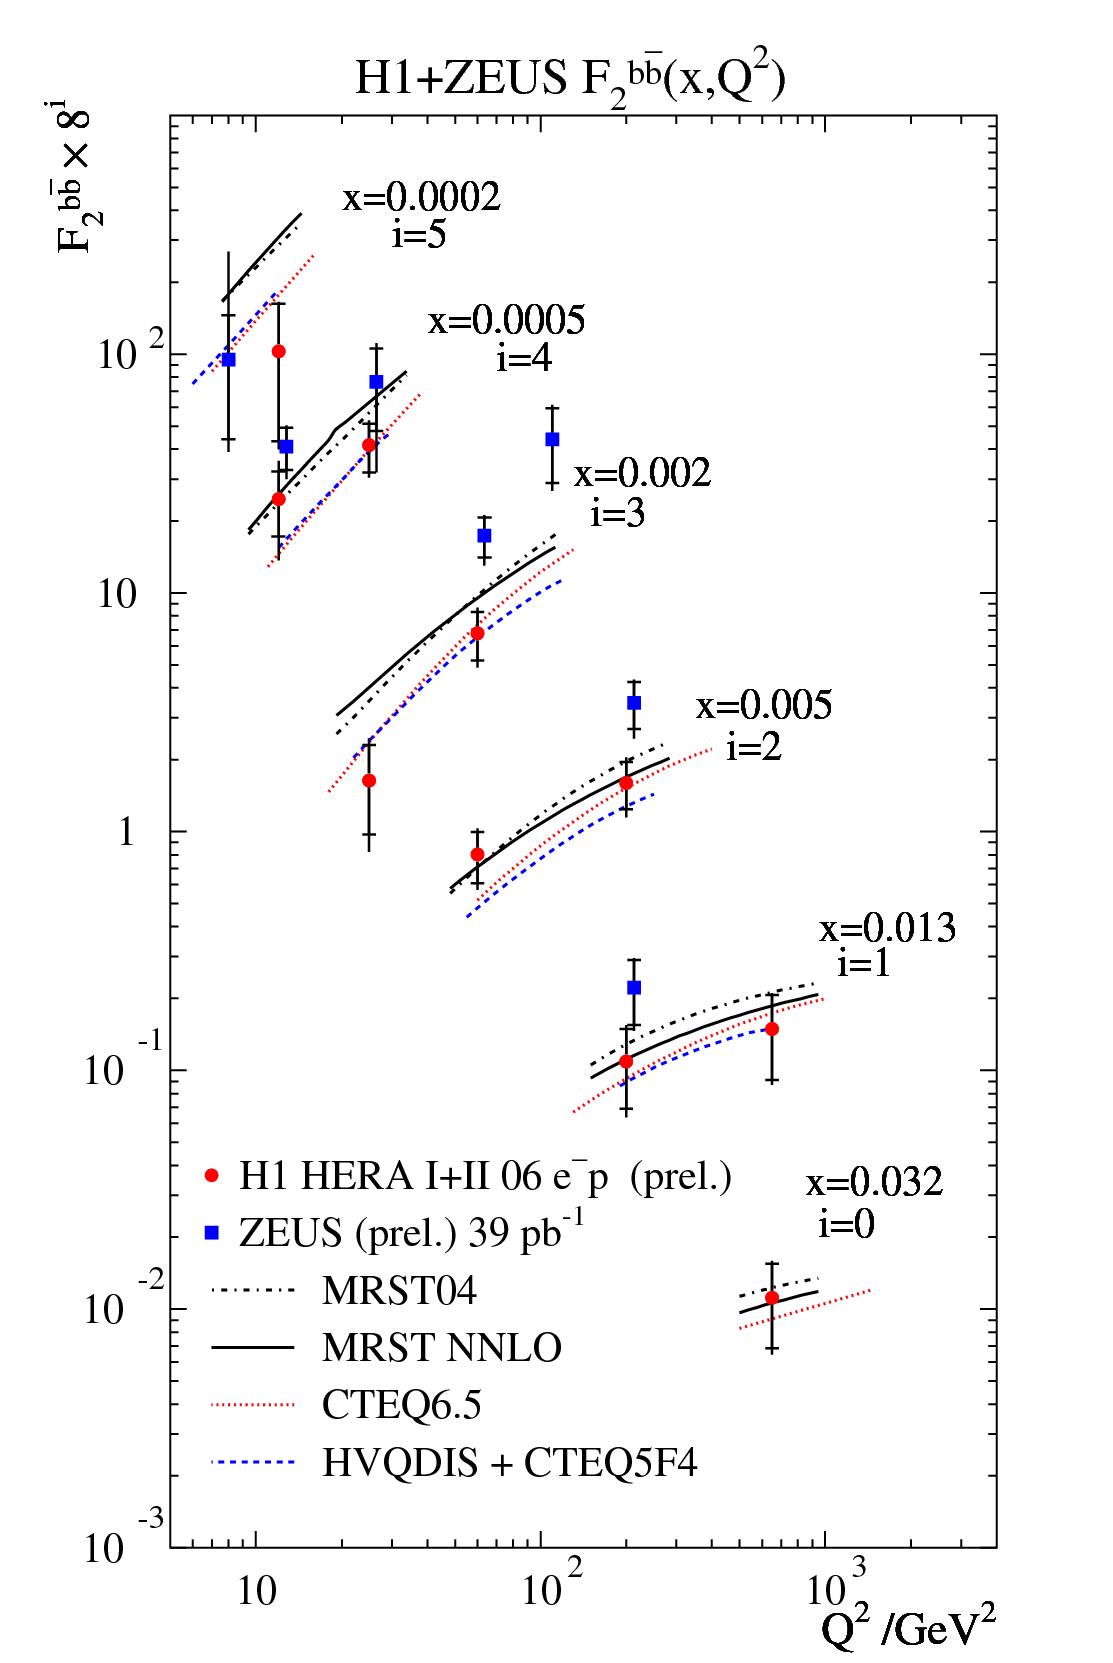
The correction due to the longitudinal structure function, , is small. The same formulae with replaced by can be used to extract and . The measurements of and are shown in Figures 16 and 17, respectively.
The rapid increase in as a function of at low is clearly visible. The measurements are consistent with the same trend, but are less precise.
6 Conclusions
The many HERA measurements of beauty production in photoproduction are compared in Figure 18.
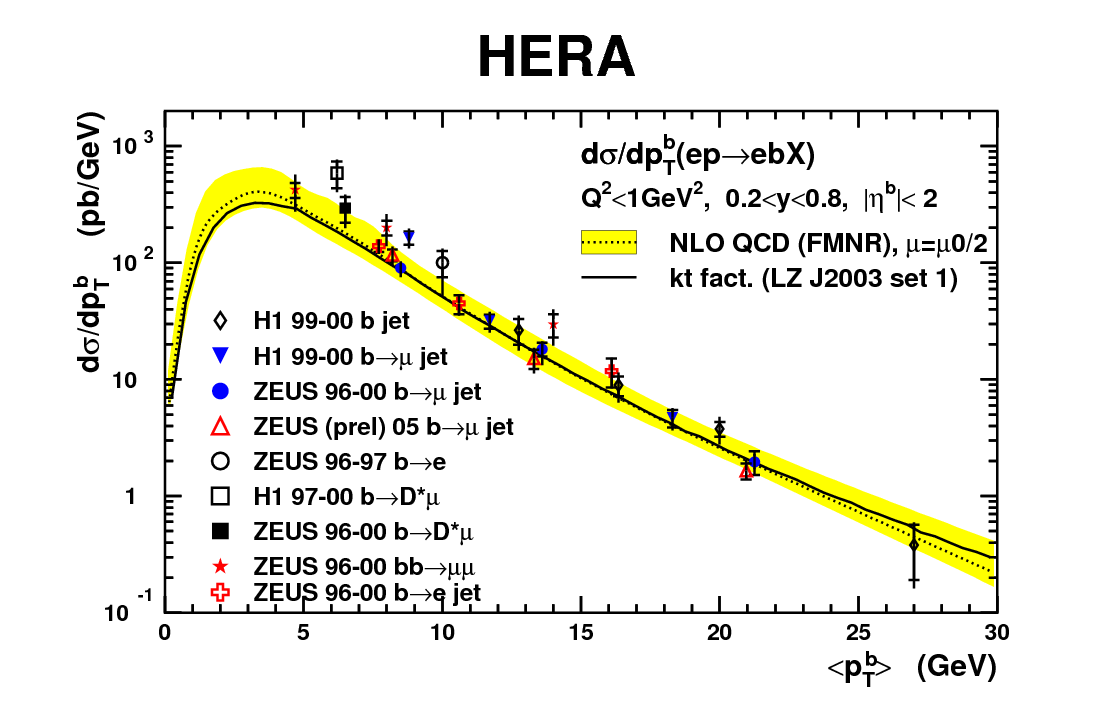
The measurements presented here agree well with the previous values, giving a consistent picture of -quark production in collisions in the photoproduction regime, and are well reproduced by the NLO QCD calculations. For all the measurements leading order Monte Carlo predictions also describe well the shapes of the distributions.
There is a tendency for the charm measurements to overshoot the predictions in the forward direction. Comparing charm quark predictions using different PDFs shows that the cross-section is, as expected, sensitive to the gluon PDF.
In the near future a number of final HERA I measurements will be published. With the HERA II data the kinematic range of the measurements can be extended and a combination of different tagging methods should increase the precision of the measurements. The improved HERA II forward tracking will allow much improved studies of heavy quark production in the forward direction.
Acknowledgements
It is a pleasure to thank the organisers for making this an informative and enjoyable conference. I would like to thank Cristi Diaconu, Achim Geiser, Markus Jüngst, Monica Turcato, André Schöning and Matthew Wing for their help in preparing this talk.
References
- [1] S. Frixione, M. Mangano, P. Nason, G. Ridolfi, Heavy-quark correlations in photon-hadron collisions, Nucl. Phys. B 412 (1994) 225.
- [2] S. Frixione, M. Mangano, P. Nason, G. Ridolfi, Heavy-quark production, Adv. Ser. Direct. High Energy Phys. 15 (1998) 609. arXiv:hep-ph/9702287.
- [3] B. W. Harris, J. Smith, Charm quark and cross sections in deeply inelastic scattering at DESY HERA, Phys. Rev. D 57 (1998) 2806.
- [4] A. Geiser, A. E. Nuncio Quiroz, The FMNRxPYTHIA interface for heavy quark production at HERA, J. Phys. Conf. Ser. 110 (2008) 022036. arXiv:0707.1632, doi:10.1088/1742-6596/110/2/022036.
- [5] H1 Coll., F. D. Aaron, et al., Measurement of meson production in photoproduction, prepared XVI International Workshop on Deep-Inelastic Scattering, DIS2008 (Apr. 2008).
- [6] H1 Coll., F. D. Aaron, et al., production at low with the H1 detector, prepared XVI International Workshop on Deep-Inelastic Scattering, DIS2008 (Apr. 2008).
- [7] ZEUS Coll., S. Chekanov, et al., Measurement of beauty photoproduction at HERA II, prepared for EPS 2007 conference (Jul. 2007).
- [8] ZEUS Coll., S. Chekanov, et al., Beauty photoproduction using decays into electrons at HERA, Phys. Rev. D 78 (2008) 072001. arXiv:0805.4390.
- [9] ZEUS Coll., S. Chekanov, et al., Bottom photoproduction measured using decays into muons in dijet events in collisions at , Phys. Rev. D 70 (2004) 012008. arXiv:hep-ex/0312057.
- [10] I. Bloch, Measurement of beauty production from dimuon events at HERA / ZEUS, Ph.D. thesis, Hamburg University (2005).
- [11] H1 Coll., F. D. Aaron, et al., Measurement of and using the H1 vertex detector at HERA, prepared for 23rd International Symposium on Lepton-Photon Interactions at High Eneergy, LP2007 (Aug. 2007).