Pulsar glitch substructure and pulsar interiors
Abstract:
Pulsar timing at the Mt Pleasant observatory focused on Vela, which could be tracked for 18 hours of the day. These nearly continuous timing records extend over 24 years allowing a great insight into details of timing noise, micro glitches and other more exotic effects. It has been found that the spin up for the Vela pulsar occurs instantaneously to within the uncertainties of the data. The potential for new, higher resolution data, to unveil insights of the Neutron Star interiors is discussed.
1 Introduction
Mount Pleasant observatory, just outside Hobart in Tasmania, Australia, has a 14-metre dish that was dedicated to tracking the Vela pulsar for two decades. This telescope was able to monitor the pulsar for eighteen hours every day, and therefore has caught many glitches ‘in the act’. As a crosscheck the older, but glitching, PSR J1644-4559 (B1641-45) was observed for the six hours when Vela was set. There is no comparative dataset, and the conclusions we draw puts extremely tight conditions on the pulsar Equation of State (EOS) placing a number of constraints on the models. An example of these would be that if the spin-up is very fast the crust has to have a low moment of inertia, therefore be very thin, and the coupling between the crust and the interior super-fluid has to be strong (see, for example, discussion of these issues in [5, 1]).
Three uncooled receivers were mounted at the prime focus of the 14-metre to allow continuous dispersion measure determination. Two used stacked disk, dual polarisation feeds with central frequencies of 635 MHz and 990 MHz additional to a right hand circular helix at 1391 MHz. Bandwidths were 250 kHz, 800 kHz and 2 MHz respectively, limiting pulse broadening from interstellar dispersion to less than 1%. The output was folded for two minutes giving an integrated pulse profile of 1344 pulses. The backend to the 990 MHz receiver also had incoherent dedispersion across 8 adjacent channels allowing a study of individual pulses. Results from these systems have been reported, respectively, in [9] and [3].
A new system, based on the PC-EVN VLBI interfaces [2], could produce TOA’s with accuracy of the order of 0.1 msec every second (as opposed to every 10 seconds with the single pulse or 120 seconds with the multi-frequency systems). This interface was adapted from the Metsähovi Radio Observatories linux-based DMA, data collector, card designed for VLBI digital inputs. The two 40 MHz IFs from the 635 MHz feed provide the two polarisations, and the data were recorded in a continuous loop two hours long. This could be halted by the incoherent dedispersion glitch monitoring program. Coherent dedispersion was to be performed off-line, for the data segment covering the glitch.
2 Pulsar Glitches as Transient events
Transient science is formed of tough targets. By definition the source is not continuous, and so (in most cases) one does not know when the event will occur. Even less, in these early days of the field, one does not really know what many of the targets are. Therefore neither do we know where to look for them, nor how to interpret the results. Pulsar glitches, as well as RRAT bursts, and other similar events, have the advantage that we do know where they occur (on the pulsar obviously) and they are reasonably repeatable (Vela glitches every days), and most importantly there exists models of the Neutron Star EOS which are directly testable with the new systems being developed. This paper will review the results from the Hobart system and make suggestions as to which of, and how, the new instrumentation could be used to provide the clear results that our systems have hinted at.
3 The Glitch in 2004
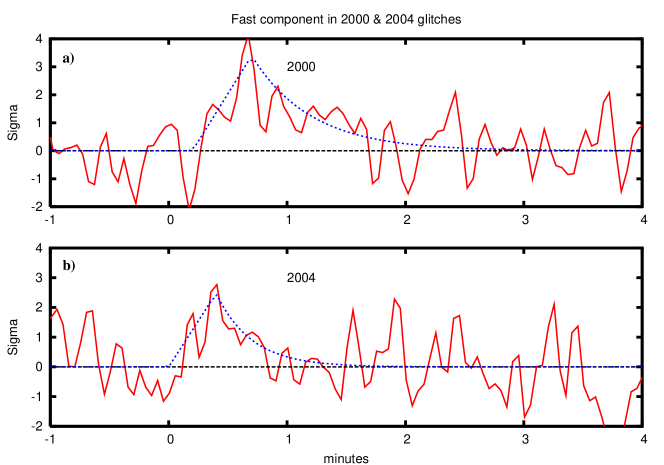
The glitch of 2004 occurred while the telescope was recording data. Unfortunately the new coherent de-dispersion system was not running at that moment and the results obtained from the old incoherent system are more or less a repeat of those in 2000. The instantaneous fractional glitch size was . A similar fast decaying term as reported in the 2000 glitch can be seen in the data after the usual model is subtracted, see Figure 1, but it is only a few sigma above the noise. This usual model consists of permanent glitch components in the frequency and frequency deviate, and other components which are co-temporal jumps in frequency which decay away. A number of these are required to fit the data and the decay timescales are denoted with . Three decaying terms have been known for sometime and these make up the usual model. In [3] a fourth short term component was identified. For a fuller discussion see that paper. In Figure 1 the longer timescale terms are subtracted (see [4] for details), and the residuals are plotted scaled against the RMS. Time zero is the intercept of the post-glitch model with the pre-glitch model, i.e. assuming an instant spin-up. The indication of a spin-up would be negative residuals, of which there is no sign. The positive residuals seen are modelled as a later glitch epoch and a very fast decaying term. Figure 1a shows the glitch of 2000, where the signal from the fourth component was clearly above the noise, Figure 1b shows the glitch of 2004, where the similar signal is barely above the noise. We present it as supporting evidence for the similar signal seen in the 2000 data, but we are unable to draw more detailed conclusions from such weak data.
4 Potential for new observations
As we have confirmed that at least something similar to the event seen in 2000 occurred in 2004 we are confident that there is a trail worth following. Unfortunately it seems very unlikely that the 14-m in Hobart will continue this work, as it has been upgraded for higher frequency, non-pulsar, work. Therefore we list what we consider to be necessary and compare this to facilities available, or soon to be available.
-
•
Base Band Recording
-
•
Near Real Time Detection
-
•
Best possible sensitivity
-
•
Near Continuous Monitoring
The first is driven by the ease with which one can collect and record a very significant portion of the Radio Spectrum, for post processing. The second is because of the limitations of storage space that recording such unprocessed data requires. The next sets the minimum detection time, and thus is the real limit to the timing resolution of the data. In the PC-EVN based system we recorded two polarisations of 40 MHz, at 2 bit resolution which could be stored for several hours. We used the existing systems to provide the trigger to freeze the recording, which would have detected a glitch in about 20 minutes. For best possible sensitivity we worked at the lowest frequency, 635 MHz. The final is of course because we can not predict when the event will occur. The Hobart system, being dedicated, tracked the source for the whole time it was up: eighteen hours. This is unlikely to be possible, if this proposed experiment was a piggy back project. However, as the glitch event we wish to study occurs over seconds to a minute, occasional sampling will not be sufficient. It needs to be tracked continuously. Phase tracking on several of the proposed SKA demonstrators does allow the formation of separate beams which could track the pulsar position, or multiple positions. As the demonstration of this capability is an important part of many of the proposals this project could be an attractive one. Any replacement system will have to be able to recover the data from a buffer, which could pre-fold the data – or pulsar gate – to reduce the data size. If pre-folding is used the de-dispersion will have to be applied, and this is quite computationally intensive. If gating is applied one needs to be very sure of the pulsar phase for an experiment which will not get much attention until the pulsar glitches. In our opinion the best option is to collect all the raw samples. It needs to be possible to access this data, or a subset of it, to form a monitoring profile. Whilst 40 MHz was recorded in Hobart we never processed it in real-time. This could be a major simplification of the system and it would provide a continuous health-check. To avoid the computationally expensive de-dispersion a sub-band would be (digitally) selected, folded and detected for the pulsar phase. Any sudden (and sustained) deviation from the expected values would provide the trigger. The size of the sub-band taken, limited by the dispersion bandwidth, is a function of the sky frequency used. Selecting the sky frequency requires a compromise of lowest possible (for best signal to noise) against scatter smearing which limits the gains from de-dispersion, and the sensitivity in general.
Scattering will be a severe problem for transient science, as very short signals may well be scattered and spread beyond recovery, see [8] in these proceedings. For our case we will not be additionally hindered by dispersion, as we know the dispersion measure (DM) for the target. Scattering smears the time signal and the timescale for the scattering, from [10], follows the formula:
where the screen distance, is a constant from the integration over the path length, is the wavelength and the speed of light. In the case of Vela this scales as msec [7]. If we aimed at a limit of 1 msec this requires a frequency of 525 MHz.
We now address these limitations in light of two potential instruments; MWA and KAT.
MWA (Murchison Widefield Array [6]) is being built in West Australia and follows the ‘magic tile’ design concept. It is constructed of active dipoles, and uses phase tracking to follow the sources on the sky. It has a frequency range of 80 to 300 MHz, with a maximum recorded bandwidth of 32 MHz. Even at the top frequency the pulsar scattering is 11% of the profile, which will reduce the signal to noise and thus the TOA accuracy. The latitude is S. The tracking, however, will be limited as the beam can only be formed close to the zenith; at 150 MHz. The Tant is not a specification which is easy to derive, but will be around the sky temperature, which we approximate as 150 K at 300 MHz. The effective area of each tile will be , and there will eventually be 500 tiles. We have assumed 16 tiles are combined to give a SEFD of 4000 Jy , two polarisations of 32 MHz and using 7 Jy for the flux we can expect a SNR of 42 in one second.
KAT (Karoo Array Telescope [6]) is being built in South Africa and follows the small D-large N design concept. It will be constructed of dishes of 12m. KAT-7, a rollout prototype, is being built now. The frequency range is 700 (or perhaps 500) to 1700 (or perhaps 2500) MHz. There are no available specifications for the sensitivity or the bandwidth. Nevertheless we can assume some typical values for these parameters. 700 MHz will be the best for the project we have in mind, with the scattering limited to 0.3 msec for Vela. Assuming a SEFD of 2000 Jy (or a Tant of about 70 K), two polarisations of 32 MHz and using 2.5 Jy for the flux we can expect a SNR of 65 in one second. The latitude, S, is well placed for tracking Vela (and other sources towards the galactic centre). The disadvantage is that we would require a dedicated dish – the single beam option is not possible. This may preclude the project, unless there was considerable downtime in the testing phase of KAT-7.
5 Conclusions
The Vela pulsar was timed for more than twenty years, and provided new insights into the pulsar EOS by, for example, providing very low limits for the spin-up time and therefore the crust thickness. There is clearly a need to observe a glitch with higher sensitivity and time resolution to investigate both the fast decay term and to detect the spin-up. Both of these values relate directly to the pulsar EOS and will provide rich fodder for theoretical analysis by allowing the measurement of the moment of inertia of the crust. With the termination of the observation program this effect is a ripe target for the next generation of pulsar telescopes that could monitor a large number of targets simultaneously with new beam forming techniques. Two next generation telescopes were considered, MWA and KAT. Both would be capable of detecting the pulsar with sufficient signal to noise to track the very short term behaviour of the pulsar after a glitch. The MWA, however, would have trouble tracking the pulsar for a large fraction of the day, and therefore we feel the most suitable instrument for continuing this work will be subsections of KAT-7, when not being used for SKA development.

References
- [1] Bildsten, L. and Epstein, R. I., Superfluid dissipation time scales in neutron star crusts Astrophys. J. 342, 951–957 (1989)
- [2] Dodson, R., Tingay, S., West, C., Phillips, C., Tzioumis, A.K., Ritakari, J., Briggs, F., The Australian experience with the PC-EVN recorder. In: R. Bachiller, F. Colomer, J.F. Desmurs, P. de Vicente (eds.) EVN on New Developments in VLBI, pp. 253–255 (2004)
- [3] Dodson, R., McCulloch, P.M., Lewis, D.R. High Time Resolution Observations of the January 2000 Glitch in the Vela Pulsar. Astrophys. J. 564, L85–L88 (2002)
- [4] Dodson, R., Lewis, D.R., McCulloch, P.M., Two decades of pulsar timing of Vela. ApSS 308, 585 (2007)
- [5] Epstein, R. I. and Baym, G., Vortex drag and the spin-up time scale for pulsar glitches Astrophys. J. 387, 276–287 (1992)
- [6] Greenwood, C., Status of Pathfinder Telescopes and Design Studies Int. SKA Project Office, 1.7.1, 2007
- [7] Komesaroff, M. M., Hamilton, P. A., Ables, J. G., Linear polarization and spectrum of PSR 0833-45 and the effects of scattering. Australian Journal of Physics 25, 759, 1972
- [8] Macquart, J.P., Limits on the Detection of Transients Imposed by Scattering PoS(Dynamic2007) 022, 2008, [arXiv:0711.2535]
- [9] McCulloch, P.M., Hamilton, P.A., McConnell, D., King, E.A., The VELA glitch of Christmas 1988. Nature 346, 822–824 (1990)
- [10] Rickett, B. J., Interstellar scattering and scintillation of radio waves ARAA, 15, 479, (1977)