VLBI Polarisation with the Yebes (EVN) and Hobart (LBA) antennae
Abstract:
Work has been on-going for the development of the required code for full polarisation processing of VLBI data using some new antennae mounts. The extensions of AIPS allows the support of two new mount types; the left-handed and right-handed Nasmyth antennae (Pico Veleta in the GMVA and Yebes-40m in the EVN) and the EW-mount (Hobart in the LBA). The data handling process is seamless, once the correct mount type has been selected. All subsequent calls to the parallactic angle subroutine PARANG will return the feed angles for Left or Right Nasmyth or EW-mount. These are required, respectively, for Pico Veleta, Yebes-40m (low frequency branch) and Hobart.
Introduction
To solve for the VLBI polarisation calibration terms one needs to remove the rotation of the feed. Until now the only feed terms supported in AIPS, and there could be solved for, were the Cassegrain and Equatorial types. The Giant mm-VLBI array (GMVA), the European VLBI network (EVN) and the Australian Long Baseline Array (LBA) included feed types which were not supported in AIPS; that is the Nasmyth (Pico Veleta and Yebes) and EW-mount (Hobart) types. New additions to the AIPS code, now included in the general distribution, will allow the full polarisation calibration of these antennae, and their respective arrays. These routines have been used to calibrate the LBA and to produce the first polarised VLBI images of Methanol Masers (Dodson 2008). Followup EVN and LBA observations are being made for this project. Preliminary results from EVN network experiment N08K2 show successful feed angle calibration. Here we present recent results from test-time LBA experiment VX014, showing the comparison of the polarised flux seen by these observations and those of the MOJAVE survey (with the VLBA).
Yebes first VLBI fringes with the EVN
As part of the first VLBI light of the new 40m antenna at Yebes, Spain, observations were performed at 22-GHz in the network monitoring experiment N08K2. Fringes were obtained between Yebes and the other antennae. In Figure 1 we present the phase difference between the RCP and LCP data after the feed angle phases have been corrected for, showing that this was successful. It was not possible to take this analysis further, as the amplitude calibration was poor, which makes the seperation of the contributions from source polarisation and instrument polarisation difficult.

Comparisons of the LBA with ATCA
We have used the new code to successfully map the polarisation direction of the magnetic fields of the Methanol Masers in G339.88-1.26 (experiment V148). Methanol Masers, it has been claimed, lend important support to the model of the formation of Massive Stars from in-falling disks (Norris et al., 1993). The magnetic fields found via VLBI are not consistent with the masers being in the disks, and therefore remove this strong support for the disk model. As part of this analysis we compared the integrated spectral line fluxes from ATCA and LBA data which showed agreement between the ATCA detection of the polarised flux by velocity channel and that found with the LBA. See Dodson (2008) for the figures and details of the analysis.
Comparisons of the LBA with VLBA
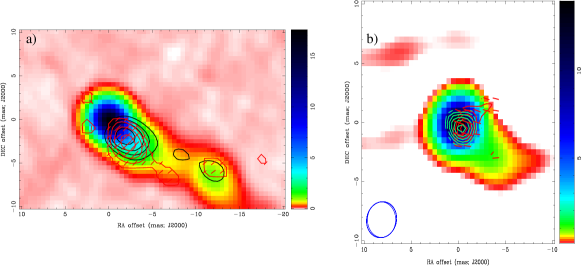
Four sources were observed in VX014, of which two are in the MOJAVE program (Lister et al., 2005); the Monitoring Of Jets and AGNs with VLBA Experiments. We compared the images of these two sources, 3C273 and 3C279, despite the differences in resolution and frequency between the two observations. The LBA at 8.4-GHz has a resolution of 3 mas and the VLBA at 15-GHz has a resolution of 0.5 mas. Nevertheless we smoothed the VLBA images to the resolution of the LBA, and amplitude scaled the LBA data to match the fluxes; assuming a simple spectral index between the two frequencies. With these simple corrections the total power images from the two instruments are in very good agreement, giving us the confidence to compare the polarisation.
The images in Figure 2 show the total power, with a log scaled colour index. Overlaid are the contours from the linear polarised flux for LBA and VLBA data. The vectors are the field directions for the LBA data, these are in good agreement with those of the VLBA data. However this is not total independent, as the VLBA image was used to provide the calibration in LPCAL. The D-term solutions for the two sources (both assuming a polarised source and an unpolarised source) were in agreement to a few percent, dominated by the errors in Mopra. It is notable to the first order that there is a good match between the results from the LBA and the VLBA, but at the second order there are notable differences. These will need further investigation, as it is possible that they are due to the second order effects from the very high polarisation feed correction in the LBA calibration terms. Work is undergoing to improve these, particularly for Mopra, which were known to be anomalous.
References
- [1] R. Dodson, 2007, IT-OAN-2006-16, Informé Technico, “On the solution of the polarisation gain terms for VLBI data collected with antennae having Nasmyth or E-W mounts.”.
- [2] R. Dodson, 2008, AA, 480, 767, “First VLBI observations of methanol maser polarisation, in G339.88-1.26”
- [3] M. Lister, D. Homan, 2005, AJ, 130, 138, “MOJAVE, 1. VLBA First-Epoch 15 GHz images”
- [4] R. Norris, et al., 1993, ApJ, 412, 222, “Synthesis images of 6.7 GHz methanol masers”