Electron Temperatures of Planetary Nebulae Determined from the He i Discontinuities
Abstract
We have used the He i discontinuities at 3421 Å to determine the electron temperatures, designated (He i), for a sample of five Galactic planetary nebulae (PNe). We compared (He i) with the electron temperatures derived from the hydrogen Balmer jump at 3646 Å, designated (H i), and found that (He i) are generally lower than (H i). There are two possible interpretations, a) the presence of substantial He2+ zone, or b) the presence of hydrogen-deficient cold clumps within diffuse nebulae. A series of photoionization models were constructed to test the two scenarios. We found that the observed (He i)/(H i) discrepancies are beyond the predictions of chemically homogeneous models. Our modelling shows that the presence of a small amount of hydrogen-deficient inclusions seems to be able to reproduce the observed intensities of He i discontinuities. We stress the value of He i discontinuities in investigating nebular physical conditions. Albeit with some observational and technical limitations, He i discontinuities should be considered in future modelling work.
1 Introduction
The accurate determination of chemical abundances of planetary nebulae (PNe) is of fundamental importance to the understanding of the nucleosynthesis of low- and intermediate-mass stars and the chemical evolution of galaxies. However, one of the main problems in nebular astrophysics is that the heavy element abundances derived from collisionally excited lines (CEL) are often lower than those derived from optical recombination lines (ORLs). The typical ORL/CEL abundance discrepancy factor (ADF) is for general PNe. The most extreme case to date is Hf 2-2, which has a ADF of about 70 (Liu et al., 2006). Recent reviews on this problem have been presented by Liu (2006) and Peimbert & Peimbert (2006) (see also the references therein). There are two possible solutions: (1) the presence of temperature and density variations in chemically homogeneous nebulae; (2) the two-component nebular model with hydrogen-deficient inclusions embedded in the diffuse nebula. In order to test the two scenarios, we need to further investigate nebular physical conditions, in particular for the regions that ORLs originate in. For this purpose, new plasma diagnostic tools rather than the classical CEL diagnostics are badly required.
Zhang et al. (2004) applied the hydrogen Balmer jump to determine the electron temperatures – hereafter (H i) – for a large sample of PNe. They found that (H i) is systematically lower than that derived from the ratio of nebular to auroral lines of [O iii] – hereafter (O iii), consistent with previous results by Liu & Danziger (1993). The discrepancies between (H i) and (O iii) were first studied by Peimbert (1967, 1971), who found that temperature variations within nebulae may lead to higher (O iii) compared to (H i). To quantitatively study the problem, they defined the mean square temperature variation, . Photoionization models of chemically and spatially homogeneous nebulae yielded typical values of between 0.003–0.015 (see Peimbert & Peimbert, 2006). However, the observations by Liu & Danziger (1993) and Zhang et al. (2004) indicated to considerably large temperature variations, which are far beyond the predictions of typical photoionization models. This can be ascribed to either additional energy inputs for chemically homogeneous nebulae or chemical inhomogeneities.
Zhang et al. (2005a, b) developed a method to use the He i recombination line ratios to diagnose electron temperatures – hereafter (He i). The comparison between (He i) and (H i) is essential to discriminate between the two-abundance model and chemically homogeneous nebulae with temperature and density variations as responsible for the CEL/ORL abundance problem since the two scenarios predict different relations between (He i) and (H i). From a study of a sample of 48 PNe, Zhang et al. (2005a) (hereafter Paper i) found that (He i) is significantly lower than (H i), in favor of the two-abundance model. However, there are two arguable problems. Peimbert & Peimbert (2006) found that for some PNe the (He i) values derived from the He i 3889, 4471, and 7069 are different with those derived from the He i 6678,7281. This might be partially caused by the uncertainties of the density of He+ zones and/or the optical depth effects on the He i 3889. Peimbert & Peimbert (2006) proposed that at least 10 different He i lines are required to accurately deduce these parameters. Moreover, for high-excitation PNe the He+ and H+ zones are not identical, and the presence of a substantial He2+ zone may partially contribute to the difference between (He i) and (H i).
These methods have also been used to determine the electron temperatures of H ii regions (García-Rojas et al., 2005; Guseva et al., 2006, 2007). These authors found that the temperature differences in H ii regions are not so obvious as those found in PNe.
In this paper, we use an alternative method, fitting the He i discontinuities, to determine (He i) for five Galactic PNe. This method is made possible by the availability of high signal-to-noise spectra of these nebulae resulting in a clear detection of the helium jump. The current study allows us to further investigate the relation between (He i) and (H i). We examine the two-abundance models and photoionization models of chemically homogeneous nebulae as the explanation of the observed (H i)/ (He i) discrepancies. This paper is a complement to the authors’ work on recombination spectra as probes of physical conditions of PNe (Liu & Danziger, 1993; Zhang et al., 2004, 2005a, 2005b).
2 Observations and data reduction
The sample includes two low-excitation PNe and three high-excitation PNe (see Table 1). The long-slit spectra were obtained using the f-18 Nasmyth focus of the 2.3 m Advanced Technology Telescope at Siding Spring Observatory on March 2000. Both arms of the Double Beam Spectrograph (DBS) were used with the 1200B grating in the second order to give spectral resolution of 0.3 Å/pixel. The dichroic may be removed or replaced with a flat mirror allowing the use of either arm independently. The detector was a SITE chip, giving a spectral coverage from 3240–8520 Å. In order to avoid loss of light due to atmospheric refraction each PN was observed with the spectrograph slit aligned to the parallactic angle. Furthermore, all the observations were carried out under the best seeing conditions, along with airmass around 1.2 to ensure the total UV light into the spectrograph slit. For each PN, the exposure time was 1500 s.
The long92 package in midas111midas is developed and distributed by the European Southern Observatory. was used for the data reduction following the standard steps, including bias subtraction, flat-field correction, cosmic-ray rejection, and wavelength calibration with a helium-argon calibration lamp. Flux calibration was conducted using the spectroscopic standards EG 131 and LTT 4364. Finally, the spectra were dereddened using the standard Galactic extinction law for a total-to-selective extinction ratio of (Howarth, 1983) and the extinction coefficients given by Cahn et al. (1992).
3 Analysis and results
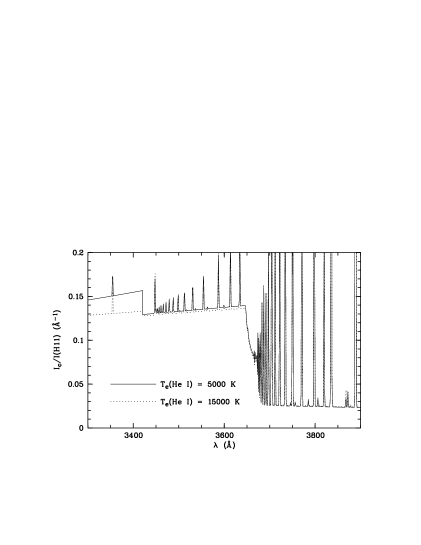
The spectra allow us to simultaneously determinate (He i) and (H i) in terms of the He i discontinuities at 3421 Å (), produced by He+ recombination to the He i 2p 3Po level, and the H i Balmer discontinuities at 3646 Å (). Note that we do not distinguish between the electron temperatures derived from the He i discontinuities and from the He i lines and use (He i) to denote both of them. The method is similar to that used to obtain (H i) in Zhang et al. (2004). To synthesize the spectra, we consider the contributions from the free-free, free-bound, and bound-bound emission from H i, He i, and He ii and the two-photon decay from the 2 level of hydrogen. The coefficients of the H i, He i, and He ii continuous emission as functions of temperature are available in Ercolano & Storey (2006). The scattering from the central star is simulated using a modified black-body function, , where is the spectral index ( for stardand black-body spectrum), is the Planck function, and is the temperature of the central star. We refer the reader to Zhang et al. (2004) for a detailed description of our fitting procedure. In order to illustrate our method, Fig. 1 gives the theoretical spectra at different (He i). It is clear that increasing of (He i) will decrease the He i discontinuities. This is a consequence of the fact that the number of the lowest-energy free electrons, which is proportional to the intensity of the He i free-bound emission at 3421- Å, decreases with increasing electron temperature. For the same reason, the H i Balmer discontinuities decrease with increasing (H i). Note that the values may slightly change with (He i) because of a small contribution from the He i discontinuity at 3680 Å produced by recombination to the 2 1P level.
Consequently, (He i) and (H i) can be derived by fitting the theoretical to the observed spectra. Before the fitting, we require to measure the He+/H+ and He2+/He+ abundance ratios. The He+/H+ ratios are obtained from a few strong He i lines around the He i discontinuities. The deduced He+/H+ ratios are relatively insensitive to the adopted electron temperatures and densities. The flux uncertainties of the He i lines are less than 15. The He2+/He+ ratios are taken from Cahn et al. (1992) (see Table 1). The errors in temperature determination caused by uncertainties of the He2+/He+ ratios are negligible since the contribution from He ii to the continuum emission is much smaller than that from H i and He i.
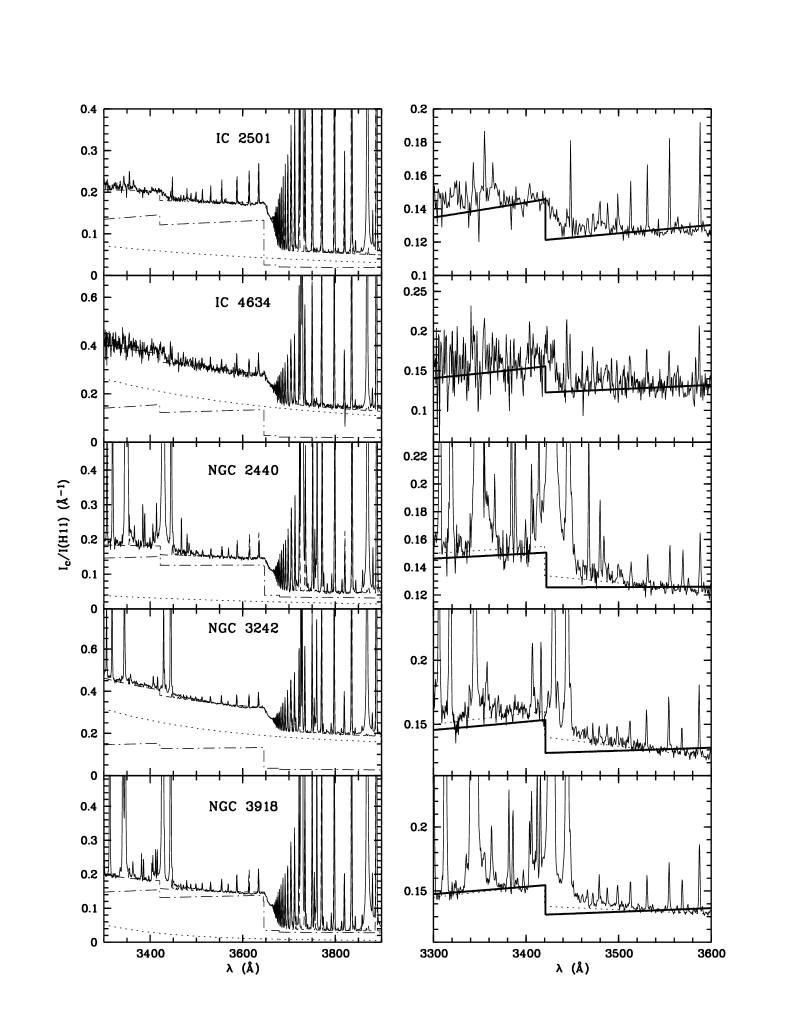
Figure. 2 shows the fitting results for the five PNe. In order to reduce the errors caused by uncertainties in the reddening correction and flux calibration, we have normalized all the spectra to H 11 . The resultant (He i) and (H i) are given in Table 1. Given the relations , where , the errors introduced by measurement uncertainties can be estimated through
| (1) |
where is the rms noise derived from the spectral regions free of emission lines, which cover a wide wavelength range. We found that for all the nebulae the 3 values are well below the values. Another error source arises in the uncertainties of the He i line emission coefficients, which might introduce an error in the He i temperature determination of about according to a comparison of the atomic data given by different authors (Brocklehurst et al., 1999; Benjamin et al., 1999; Bauman et al., 2005). For high-excitation PNe, additional errors are caused by the strong O iii Bowen lines around the He i discontinuities. In such cases, our fittings were based on the spectral regions with wavelengths departing from 3421 Å, introducing a errors in derived (He i) caused by uncertainties in flux calibration. The emission efficient of hydrogen two-photon continuity was deduced under Case A assumption and might be significantly underestimated under Case B conditions due to the collisional excitation from 2 to 2. However, the excess emission of two-photon process can be mostly compensated by the simulated scattering continuities, and we do not require accurate estimate of the absolution magnitude of two-photo emission. The uncertainties in the smooth continuities hardly affect our results mainly based on the 3421 Å discontinuity.
The right panels of Figure. 2 give zoom-in views of the spectra around the He i discontinuities. For some PNe, the narrow spectral ranges from 3421–3500 Å cannot be well fitted by our models due to the facts that the models did not treat the extended wings of O iii Bowen lines and the blended high- He i lines at the red side of the 3421 Å discontinuity, and the low sensitivity near the CCD edges leads to a larger slope. Nevertheless, these effects on our results should be somewhat insignificant since the deviations exist only in a relatively limited wavelength range. Of course, if our models merely take into account the spectra from 3300–3600 Å, we can achieve a better fitting in such a narrow wavelength range by adjusting the contribution from scattering continuities. However, this will result in a failed fitting of the global spectra. Modelling different spectral ranges to a reasonably good extent, we have assessed the errors in (He i). In Figure. 2, we overlaid the best fitting to the narrow spectral ranges (3300–3600 Å) of NGC 2440, NGC 3242, and NGC 3918, which results in (He i) K, 7500 K, and 8250 K for the three high-excitation PNe, respectively. We noted that these values, which should be larger than the real (He i) values, are still lower than (H i).
Three of the PNe in the recent sample have been studied in Paper i. For comparison, Table 1 gives (H i) and (He i) determined in Paper i. Considering the error bars, they are in agreement with the results derived in the recent work. Note that the (He i) in Paper i were derived from He i lines ratios and might possibly be different with those from He i discontinuities due to the effects of radiative transfer and temperature inhomogeneities.
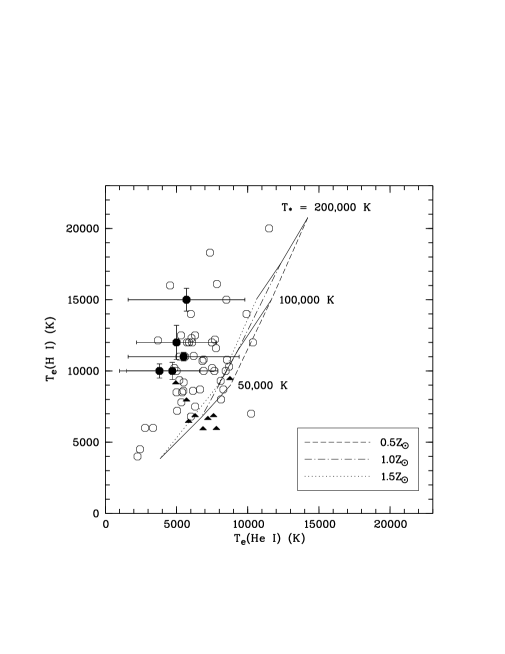
In Fig. 3, we compare (H i) and (He i). These points derived in the recent work and those derived in Paper i are located at approximately the same position in this figure. An inspection of Fig. 3 shows that (He i) is consistently lower than (H i), confirming our previous results in Paper i. In the scenario of the two-abundance model, the He i emission are significantly contaminated by emission from the extremely cold hydrogen-deficient inclusions while the H i recombination spectra dominantly originate in the normal component under a typical temperature of K. This provides a plausible explanation for the lower (He i) compared to (H i). In Fig. 3, we also overplot the results for H ii regions obtained by García-Rojas et al. (2005), which are located at a more compact area in this figure and indicate to a smaller (He i)/(H i) discrepancy in H ii regions compared to PNe.
4 Discussion
4.1 He i lines
A few strong He i lines have been clearly detected in the red arm. They allow an independent examination of our results derived from the He i discontinuities. This is non trivial in that density inhomogeneities and radiative transfer effects could affect our results to some extent.
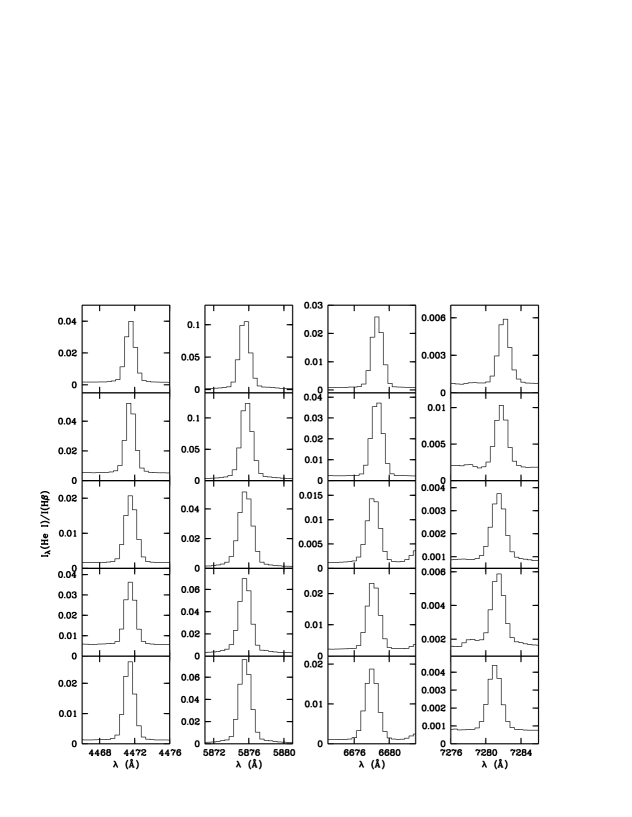
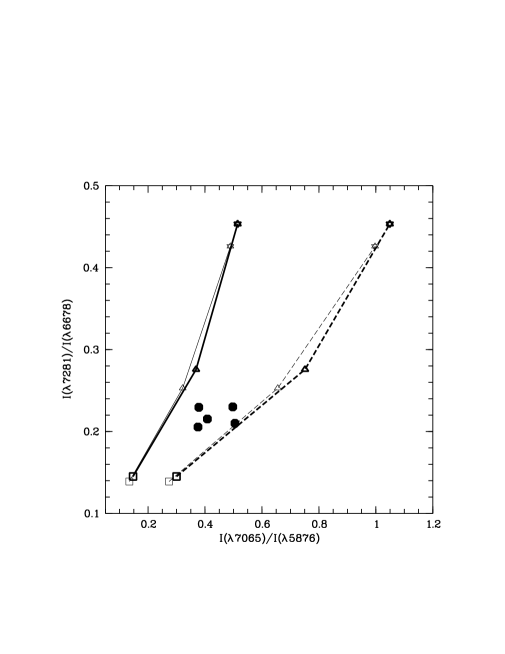
Here we took into account the four strongest He i lines in the red arm, , 6678, 7065, and 5876, as shown in Fig. 4. Their intensities are listed in Table 2. In Paper i, we have shown that the He i ratio provides an useful temperature diagnostic. According to Benjamin et al. (2002), the He i lines are from triplet states and are essentially affected by the optical depth of the 2s3S level. Fig. 5 gives the theoretical predictions of the He i ratio versus He i ratio at different electron temperatures, electron densities (), and optical depths of the He i 2s3S–3p3Po3889 line (). The observed values for our sample are also shown in this figure.
The diagram is useful to investigate nebular physical conditions. An inspection of Fig. 5 shows that the (He i) values are consistently lower than 10 000 K, which represents the lowest value of (H i) in our sample, supporting the conclusion drawn from the He i discontinuities. We also found that the values range from 0 to 10. These line ratios have only weak dependence on electron densities and are hardly used to determined (He i).
Table 2 gives the (He i) values derived from the He i line observations. The uncertainties of electron densities and optical opacities introduce an error of about 1500 K. Using the spectral lines falling in the overlapping wavelength region of two adjacent orders, we estimated the uncertainties in flux calibration to be about 5. The combined errors of the resultant (He i) amounts to about 2200 K. The (He i) deduced in this paper are biased to larger values compared to those in Paper i (although they are marginally consistent with each other considering the error bars). This is partly attributed to the fact that in the present observation the slit was put in a position closer to the center. However, the primary cause might be that the uncertainties in flux calibration of the red arm are probably larger than expect. We performed a comparison of the present spectra and our previous long-slit spectra and found that the former have systematical higher line fluxes in very red wavelength regions. Therefore, we suppose that the fluxes of the He i might have been significantly overestimated, and the (He i) in Table 2 should be treated as upper limits, which are still lower than (H i). A detailed discussion of He i lines requires more precise observations in the red arm and is beyond the focus of the present paper.
One should bear in mind that the electron temperatures derived from the He i discontinuities and those from the He i line ratios are not necessary identical since they have different temperature dependences, and thus weight different regions if large temperature fluctuations exist. The comparison of He i discontinuity- and line-temperatures is a potentially intriguing subject for future research.
4.2 Model tests
An issue is invited, whether the large (H i)/ (He i) discrepancies in high-excitation PNe can be ascribed to the presence of substantial He2+ zone which has a higher temperature than He+ zone. In order to investigate the problem, we first compare the observed results with the predictions by 1D photoionization models of chemically homogeneous nebulae. We then construct 3D photoionization models to test the two-abundance model as the explanation of the temperature discrepancies.
4.2.1 Chemically homogeneous model
To date, the published photoionization models for certain PNe with a chemically homogeneous medium predict only minor discrepancy between (He i) and (H i). For example, the classic photoionization model of NGC 7662 (catalog ) constructed by Harrington et al. (1982) yields (H i)(He i) K. To investigate the case of general PNe, we use the cloudy code (Ferland et al., 1998) to construct a series of 1D photoionization modellings of chemically homogeneous nebulae. In order to compare the modelling results with the observed ones, we define modelled (He i) and (H i) by
| (2) | |||||
where is the position vector, is the electron density, and is the number density of He+ or H+ atoms. Then (He i) and (H i) can be simulated from the modelled , , and . The temperatures defined in Eq. (2) are similar to those derived from the observed He i and H i discontinuities.
For the modellings, a black-body spectral energy distribution with a luminosity erg s-1 is assumed for the central star. We assume that the nebula has a homogeneous density structure with a hydrogen density of cm-3. The assumed represents the lower limit of typical PNe. At a given UV radiation field, increasing will decrease the ionization parameter and the He2+/He+ ratio, and thus decrease the contribution of He2+ zone to the (He i)/(H i) discrepancies.
Our modellings reproduce the (He i) and (H i) values in different nebular metallicities () and effective temperature of the ionizing star (). The results are illustrated in Fig. 3. These modellings show that the presence of He2+ zone can cause a higher (H i) compared to (He i). The (H i)/(He i) discrepancies sharply increase with increasing and have only weak dependency on . Nevertheless, the large differences between the observed (He i) and (H i) are obviously beyond the model predictions although the claim is probably not applied for H ii regions. An inspection of Fig. 3 suggests that chemically homogeneous models are unable to reproduce the extremely low (He i) measured in PNe. The observed (H i) values can be well reproduced by using appropriate and . However, in order to match the observed (He i) for most PNe, we require extremely high ( K) and ( ), which are unlikely real for our sample.
Our models do not include the photoelectric heating by dust grains, which can efficiently enhance the temperature in the nebular regions close to the central star (Stasińska & Szczerba, 2001). In addition, there might be other unexpected heating sources that lead to greater temperature fluctuations. It is too early to conclude with certainty that chemical inhomogeneities must be introduced to explain the observed temperature discrepancies. In any case, a more comprehensive photoionization model including extra heating mechanisms should take into account the He i discontinuities.
4.2.2 The two-abundance model
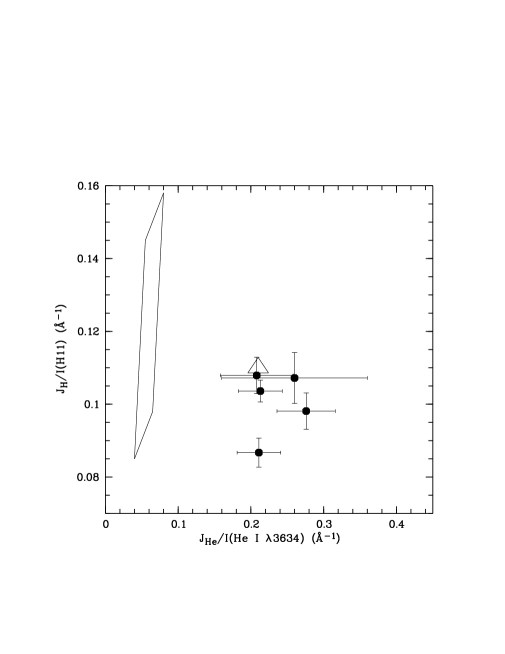
To test the two-abundance model, we use the 3D photoionization code mocassin (Ercolano et al., 2003a), which is capable of treating nebular geometric asymmetries, density and composition inhomogeneities as well as the diffuse radiation fields self-consistently, and thus enables to more rigorously study the physical properties and chemical composition of the postulated hydrogen-deficient component compared to 1D model. A series of two-abundance models are constructed and the reproduced and are compared with the observed values. We found that the presence of a very small amount of hydrogen-deficient material is enough to interpret the observations. An example is given in Fig. 6, where we compare the normalized and observed for our PN sample and those predicted by one of the mocassin models. For this two-abundance model, we have assumed that the diffuse nebula has a spherical structure, a (H) value of 103 cm-3, and a metallicity of , where is the average metallicity of the Galactic PNe (Kingsburgh & Barlow, 1994). The hydrogen-deficient inclusions have a filling factor of and a (H) value of 70 cm-3, and are enhanced by a factor of 200 in He and by a factor of 800 in CNONe compared to the diffuse gas. An effective temperature of 120,000 K is assumed for the central star. According to our modelling, the electron temperature of the hydrogen-deficient inclusions is about 500 K, which is much lower than the average temperature of the diffuse gas of 10,770 K. The cold hydrogen-deficient inclusions contribute about and of He i and H i line emission intensities, respectively. As shown in Fig. 6, the model result can closely match the observed and .
For comparison, we construct a series of chemically homogeneous models using mocassin in the parameter ranges K K, cm-3 cm-3, and . The predicted region of and is given in Fig. 6. Again it is confirmed that even for high-excitation PNe chemically homogeneous models are unable to reproduce the observed He i discontinuities.
The two-abundance model can provide a natural solution for the observed (He i)/(H i) discrepancies. Nevertheless, we have noted some problems in our two-abundance modelling. In order to explain the low (He i), we require to assume a low density and high enhancement factor of heavy elements for the hydrogen-deficient inclusions to get effective cooling. Such a low-density and low-temperature component is unstable inside the nebulae. Moreover, our models yield an ADF of 10–20, higher than the typical value for general PNe. Probably, these imply to the presence of some additional coolants inside hydrogen-deficient inclusions.
The hydrogen-deficient inclusions postulated in the current study have similar properties to Abell 30’s knots, which show extremely He-rich (Wesson et al., 2003; Ercolano et al., 2003b). However, the properties of the hydrogen-deficient inclusions in different PNe are probably not identical. A complete understanding of the hydrogen-deficient component requires detailed modelling and precise measurements of heavy-element ORLs for individual PNe, which is beyond the scope of this paper. Our results show that the observations of He i discontinuities can provide some constraints on future study of the hydrogen-deficient inclusions.
5 Conclusions
Based on a high signal-to-noise spectroscopy of a sample of PNe, we explored the possibility of using the He i discontinuities at 3646 Å as probe of nebular physical conditions. (He i) is found to be systematically lower than (H i), confirming the results of Paper i, in which we determined (He i) using the He i recombination lines. We have investigated the contribution of He2+ zone on the (He i)/(H i) discrepancies by constructing a series of photoionization models. We have shown that the chemically homogeneous models predict too small temperature discrepancies as compared to the observations. The observations, however, can be naturally interpreted if one assumes the presence of a small amount of hydrogen-deficient cold inclusions within the diffuse nebula. Our results thus provide a possible evidence in favor of the two-abundance model as the explanation of the CEL/ORL abundance problem. Nevertheless, we cannot completely rule out the scenario of temperature fluctuations if some extra heating mechanisms exist.
To completely understand the properties of the postulated small hydrogen-deficient inclusions, we need to construct detailed 3D photoionization models with very fine mesh grids and take account of the ORLs from helium and heavy elements. For that, an enormous amount of computer time is required. The detailed two-abundance models for individual objects will be reported in forthcoming papers (e.g. Yuan et al. in preparation).
In the current paper, we show that the He i discontinuities, notwithstanding some observational and technical limitations, provide a valuable probe of nebular physical conditions and can place a tight constraint for the modelling. The method proposed in this paper is particularlly appropriate for studying low-excitation PNe and H ii regions that are free from the effects of strong O iii Bowen lines. Instrument development and atomic data improvement will be invaluable to provide more robust conclusion.
References
- Bauman et al. (2005) Bauman, R. P., Porter, R. L., Ferland, G. J., MacAdam, K. B. 2005, ApJ, 628, 541
- Benjamin et al. (1999) Benjamin, R. A., Skillman, E. D., & Smits, D. P. 1999, ApJ, 514, 307
- Benjamin et al. (2002) Benjamin, R. A., Skillman, E. D., & Smits, D. P. 2002, ApJ, 569, 288
- Brocklehurst et al. (1999) Brocklehurst, M. 1972, MNRAS, 157, 21
- Cahn et al. (1992) Cahn, J. H., Kaler, J. B., & Stanghellini, L. 1992, A&AS, 94, 399
- Ferland et al. (1998) Ferland, G. J., Korista, K. T., Verner, D. A., Ferguson, J. W., Kingdon, J. B., & Verner, E. M. 1998, PASP, 110, 761
- Ercolano et al. (2003a) Ercolano, B., Barlow, M. J., Storey, P. J., & Liu, X.-W. 2003a, MNRAS, 340, 1136
- Ercolano et al. (2003b) Ercolano, B., Barlow, M. J., Storey, P. J., Liu, X.-W., Rauch, T., & Werner K. 2003b, MNRAS, 344, 1145
- Ercolano & Storey (2006) Ercolano, B., & Storey, P. J. 2006, MNRAS, 372, 1875
- García-Rojas et al. (2005) García-Rojas, J., Esteban, C., Peimbert, A., Peimbert, M., Rodríguez, M., & Ruiz, M. T. 2005, MNRAS, 362, 301
- Guseva et al. (2007) Guseva, N. G., Izotov, Y. I., Papaderos, P., & Fricke, K. J. 2007, A&A, 464, 885
- Guseva et al. (2006) Guseva, N. G., Izotov, Y. I., & Thuan, T. X. 2006, ApJ, 644, 890
- Stasińska & Szczerba (2001) Stasińska, G., & Szczerba, R. 2001, A&A, 379, 1024
- Harrington et al. (1982) Harrington, J. P., Seaton, M. J., Adams, S., & Lutz, J. H. 1982, MNRAS, 199, 517
- Howarth (1983) Howarth, I. D., 1983, MNRAS, 203, 301
- Kingsburgh & Barlow (1994) Kingsburgh, R. L., & Barlow, M. J. 1994, MNRAS, 271, 257
- Liu (2006) Liu, X.-W. 2006, in IAU Symp. 234 Planetary Nebulae, eds. M. J. Barlow, & R. H. Méndez (Cambridge: Cambridge University Press), P.219
- Liu et al. (2006) Liu, X.-W., Barlow, M. J., Zhang, Y., Bastin, R. J., & Storey, P. J. 2006, MNRAS, 368, 1959
- Liu & Danziger (1993) Liu, X.-W., & Danziger, I. J., 1993, MNRAS, 263, 256
- Peimbert (1967) Peimbert, M. 1967, ApJ, 150, 825
- Peimbert (1971) Peimbert, M. 1971, Bol. Obs. Tonantzintla Tacubaya, 6, 29
- Peimbert & Peimbert (2006) Peimbert, M., & Peimbert, A. 2006, in IAU Symp. 234 Planetary Nebulae, eds. M. J. Barlow, & R. H. Méndez (Cambridge: Cambridge University Press), P.227
- Wesson et al. (2003) Wesson, R., Liu, X.-W., & Barlow, M. J. 2003, MNRAS, 340, 253
- Zhang et al. (2004) Zhang, Y., Liu, X.-W., Wesson, R., et al. 2004, MNRAS, 351, 935
- Zhang et al. (2005a) Zhang, Y., Liu, X.-W., Liu, Y., & Rubin, R. H. 2005a, MNRAS, 358, 457 (Paper i)
- Zhang et al. (2005b) Zhang, Y., Rubin, R. H., & Liu, X.-W. 2005b, RevMaxAA, 23, 15
| Source | He2+/He+a | (He i)b (K) | (H i) (K) | |||
|---|---|---|---|---|---|---|
| This work | Paper i | This work | Paper i | |||
| IC 2501 | 0.002 | 47003200 | … | 10000600 | … | |
| IC 4634 | 0.000 | 38002800 | 50001000 | 10000500 | 8500400 | |
| NGC 2440 | 0.401 | 57004100c | … | 15000800 | … | |
| NGC 3242 | 0.230 | 50002800d | 45001000 | 120001200 | 102001000 | |
| NGC 3918 | 0.303 | 55003900e | 60001000 | 11000300 | 123001000 | |
-
a From Cahn et al. (1992).
-
b Note that the (He i) values given by Paper i are derived from He i line ratios.
-
c If merely the spectral range from 3300–3600 Å is taken into account, we derived a value of 6840 K, which represents the upper limit of (He i) (see the dotted lines in the rigth panel of Figure 2).
-
d The upper limit is 7500 K. Details are as indicated in Footnote .
-
e The upper limit is 8250 K. Details are as indicated in Footnote .
| Transition | IC 2501 | IC 4634 | NGC 2440 | NGC 3242 | NGC 3918 |
|---|---|---|---|---|---|
| Singlets | |||||
| 6678 | 0.0400 | 0.0590 | 0.0244 | 0.0381 | 0.0331 |
| 7281 | 0.0086 | 0.0142 | 0.0056 | 0.0082 | 0.0068 |
| Triplets | |||||
| 5876 | 0.1790 | 0.2125 | 0.1039 | 0.1210 | 0.1367 |
| 7065 | 0.0904 | 0.1057 | 0.0393 | 0.0494 | 0.0513 |
| (He i)a | 7500 K | 8400 K | 8000 K | 7400 K | 7100 K |
-
a Bears an error of K.