Measurement Limits to 134Cs Concentration in Soil
Abstract
We investigate the caesium concentrations in soils in mountain areas near Gori nuclear power plant in Korea, focusing on the measurement limits to the . In order to lower the minimum detectable amount (MDA) of activity for the , we have used the ammonium molybdophosphase (AMP) precipitation method to get rid of the 40K existing in natural radioactivity, which reduces the MDA activity about ten times smaller than those without the AMP precipitation method. The MDA results for the were found to be in the range between and Bq/kg-dry weight. In order to diminish the background, we also have measured a part of the soil samples in Yangyang, a small town in the east coast of Korea. However, it turns out that in order to detect the in the samples the MDA should be reduced to the level of mBq/kg-dry weight.
keywords:
134Cs , 137Cs , ammonium molybdophosphate (AMP) precipitation method , minimum detectable amount (MDA)1 Introduction
It is of great importance to study the anthropogenic caesium radioisotopes and , since their production and emission rates are much higher than other radioisotopes from nuclear fissions at nuclear power plants (NPP) and they have rather low mobility in soils (Tranter et al., 2002; Zehnder et al., 1995; Yoshida and Muramatsu, 1998). Thus, 137Cs are widely used as tracer radionuclides for monitoring the NPP-related environmental radioactivity (Mahara, 1993). The 137Cs nucleus (y) is a long-lived beta emitter decaying a branching ratio to the metastable state (m) of 137Ba∗ at 661.7keV. While the 134Cs nucleus is also a beta emitter, its decay time (y) is much shorter than that of the 137Cs and emits many gamma-rays correlated with the beta electron. Due to these different life-times, it is possible to date the anthropogenic radioactivity with the ratio of 134Cs to 137Cs concentrations in soil measured. However, since the 134Cs has much shorter half life-time compared to the , the dating range depends solely on a minimum detectable amount (MDA) of activity for the short-lived 134Cs radioisotope.
Moreover, it is well known that the contamination arises mainly from three different sources: Atmospheric nuclear weapon tests (NWT) in the period of the late 1950s and early 1960s, in particular, in the nothern hemisphere (UNSCEAR, 2000; Renaud and Louvat, 2004), the Chernobyl accident taken place in May 1986, and discharges from nuclear power plants (NPPs) (Isaksson et al., 2001; Robison et al., 2003). On the contrary, the does not come from the NWT, since it is induced only by the neutrons impinged on the fission radionuclide , which rarely occurs in the course of a nuclear explosion due to a lack of the reaction time. However, the can be produced in reactors at NPPs. Thus, knowing the ratio of 134Cs to 137Cs concentrations in soil may determine their origin. Note that the fallout ratio of the Chernobyl explosion is known to be about in 1986 (Thomas and Martin, 1986).
In order to determine the ultra-low level caesium concentrations quantitatively in soil, it is essential to understand the natural background originated mainly from uranium-, thorium-, actinum-series nuclides, and the potassium 40K. The -ray peaks of the , in particular, those at 604.7 keV and 795.6 keV are overlapped with a great deal of -ray peaks from natural radionuclides. Moreover, strong peaks such as a 1460 keV line of the 40K at high energies produce the Compton-continuum background that covers the wide range of the gamma energies for caesium decays. Thus, we need to get rid of the natural background as much as possible. One of the best ways known to eliminate the is to use the ammonium molybdophosphase (AMP) precipitation method. AMP is an inorganic compound that selects the caesium exclusively and has high adsorption capacity (Suss and Pfrepper, 1981). This method has been widely applied to sea-water samples in order to enrich the Cs concentration (Aoyama et al., 2000; Nabyvanets et al., 2000; Djingova and Kuleff, 2002; Baskaran et al., 2003). However, this radiochemical extraction for a soil sample should be emphasized by its effective background suppression, thereby significantly lowering the minimum detection limit.
In the present work, we want to investigate the minimum detection limit to the measurement of the in surface soils in mountain areas near the Gori NPP in Korea, aiming at determining the ratio of the to . In Korea, eighteen nuclear reactors are being operated at four different NPP sites. One of the NPP sites is located in Gori, a small town in the south-east coast of Korea, where four pressurized-water reactors are in operation. The first Gori reactor has been operated first time in Korea since 1978. The environmental radioactivity in the vicinity of the Gori NPP has been monitored last years. The samples were taken from soils, rain water, sea water, surface water, milk, seaweed, egg, etc. Recently, high concentrations of the 137Cs were first reported in the soil samples from the mountain areas near the Gori NPP in the range of Bq/kg-dry, while the 137Cs concentrations in surface soils of Korea are known to range from to Bq/kg-dry with a mean value of Bq/kg-dry (Kim et al., 1998).
In order to clarify why the soil samples from the mountain areas near the Gori NPP turn out to be larger than those from other places in Korea, it is essential to measure the concentrations in the samples in addition to those of . Since the NWTs produce almost no , we may conceive two difference sources for it: The Chernobyl accident and the NPPs in Korea. However, the Chernobyl accident took place only 24 years ago, which implies that the 134Cs concentration was reduced by three orders of magnitude while only about of the Chernobyl-derived 137Cs concentration remains in the environment (Pourcelot et al., 2003). Moreover, it is known that the Chernobyl accident did not impact much on Korean soils (Kim et al., 1998).
Thus, one way to figure out the reason for higher concentrations of is to conduct a comparative study: We take samples from distant areas from the Gori NPP and compare their ratios of 134Cs to 137Cs with those of the sample taken from the mountain areas near the Gori NPP. If the ratio of 134Cs to 137Cs is higher than the average ratio to be mapped out for the distant areas from the Gori NPP, we may find a clue for the origin of higher concentrations of 137Cs in the samples. In this regard, it is of great significance to conduct the methodological study for the measurement of the ultra-low level concentration of 134Cs in its own right.
The present work is organized as follows: In Section 2, we briefly explain the process of the experiment. In Section 3, we discuss the detection limits to the concentration. In the final Section, we summarize and draw conclusions of this work.
2 Experiment
2.1 Sampling and Preparation
Soil samples were collected from 96 sites at top areas of four different mountains near the Gori NPP: Mt Daleum (, ), Mt Ilgwang (, ), Mt Samgak (, ), and Mt Daewoon (, ). All these mountains are located within 7-12 km distance from the Gori NPP. Uncultivated soil was sampled from the layer. Each sample was taken in close proximity to give approximately to kg. Since we are mostly interested in measuring both and , we have selected the samples with the highest concentration: Bq/kg-dry. From that sample, we took two samples for the measurement and prepared them with different methods: Sample A was air-dried at 65 ∘C for 10 hours and sieved with 2mm mesh size. It was then transferred to a 450ml Marinelli beaker. On the other hand, Sample B was heated at 450 ∘C for 10 hours. One liter of HCl solvent was added to Sample B, and the solution was stirred with heat for 4 hours. Soil contents in the sample solution were sieved through two layers of the normal filter(5C, 125mm) and the glass-fiber filter(GF/C, 110mm) in the Buhner filtering system. Unfiltered sediment was washed out with hot water.
For precipitation with ammonium-molybdophosphate(AMP), the sample was stirred with 80g AMP solution at PH2 for 10 hours. The sample was then sieved with a membrane filter of 0.45m pore size, and after cleansing the sample bottle with 1% HCl solution, the cleansing solution was put to the filter to sieve remaining contents. After the AMP precipitation, the sample was dried under infrared light, and put into a standard 55ml Marinelli beaker for -ray measurement.
2.2 Gamma-ray Detection
We have measured the 137Cs concentration in the soil samples by directly measuring the 661.7 keV, 604.7 keV, and 795.8 keV gamma rays with an HPGe detector. The HPGe -ray detector has a 30% relative efficiency at 1330 keV of 60Co, and the schematic setup of the detector and the shielding system is shown in Fig. 1.

The HPGe detector was coupled to standard NIM electronics and a PC with Gamma-VisionTM spectroscopy software. The system was shielded with a uniform lead castle of 10cm in thickness. Certified reference materials (CRM) of mixed gamma-ray sources from KRISS (Korea Research Institute of Standards and Science) were employed for the efficiency calibration of the system. The CRM provides with 13 gamma-ray peaks from 10 radioactive elements: 241Am (59.5 keV), 109Cd (88.0 keV), 57Co (122.1 keV, 136.5 keV), 139Ce (165.86 keV), 51Cr (320.08 keV), 113Sn (391.70 keV), 85Sr (514.00 keV), 137Cs (661.66 keV), 88Y (898.04 keV, 1836.05 keV), and 60Co (1173.23 keV, 1332.49 keV).
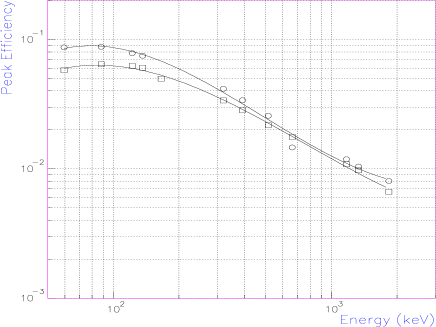
Figure 2 represents efficiency curves of the HPGe detector, fitted with the following empirical logarithmic polynomials:
| (1) |
where denotes the gamma-ray energy. The are the fitting parameters of the polynomial. The efficiency for the 450ml sample is lower than that for the 45ml AMP sample in the low-energy region, because of a larger self-absorption of gamma-rays in the sample volume.

In order to ensure that the AMP is not contaminated with natural thorium or other natural radioisotopes, we need to compare the gamma-ray spectra for the AMP without and with background subtraction. The results are drawn in Fig. 3, of which the lower panel shows that there is no contamination in the AMP.

Figure 4 depicts the gamma-ray spectrum of the AMP sample overlaid with that of the dry-soil sample. The chemical separation shows a significant improvement in a signal-to-background ratio. The background is reduced dramatically by almost a order of magnitude due to the AMP method. The upward arrows in Fig. 4 designate the positions of gamma-ray energies from 134Cs and 137Cs.
3 Detection Limits
We are now in a position to discuss the MDA of activity of samples. The criterion for limits of detectability is usually given by the MDA of activity. The most widely used definition of the MDA was first defined by Curie (Curie, 1968) as follows:
| (2) |
where denotes the number of background events measured during the time . The represents the detection efficiency as defined in Eq.(1), and stands for a branching fraction for 134Cs emitting the respective gamma-ray. The minimum detectable activity depends on the square root of the number of background events which mainly come from three different reasons: The sample itself, Compton continuum, and natural radioactivity. Note that it actually depends on the inverse square root of , since the background events also increase as a function of time.
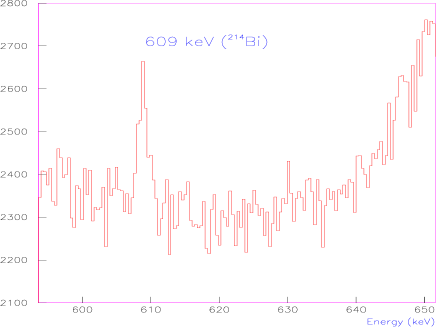
In Fig. 5, we show the gamma-ray spectrum of the dry-soil sample measured at a normal laboratory without the AMP precipitation taken into account. The peak at 609 keV corresponds to that of the gamma-ray from . Because of the background, it is very difficult to identify the spectrum of the sample, in particular, in the higer region of the gamma-ray energy.
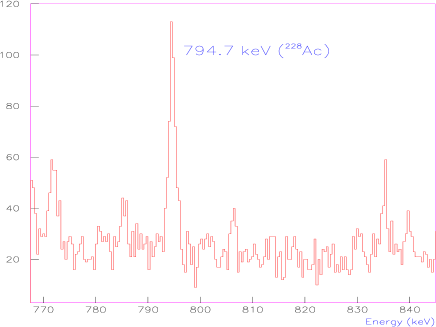
In order to reduce the background of the sample, we have brought the sample to an underground laboratory located in Yangyang, a small town in the east coast of Korea. The underground laboratory is specialized to search for dark matter for which it is essential to develop low-background measurement. It utilizes the space in a tunnel of Yangyang Pumped Storage Power Plant located deep under a mountain. Figure 6 shows the gamma-ray spectrum of the AMP-precipitated sample measured at the underground laboratory in Yangyang. The survived peak at 794.7 keV represents that of the gamma-ray from . As compared with Fig. 5, it is shown that the background is drastically reduced.
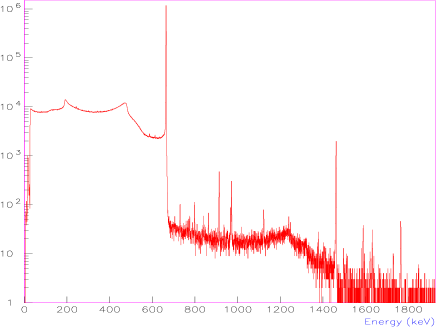
In Fig. 7, we present the full energy-range gamma-ray energy spectrum of the AMP-precipitated sample measured at the underground laboratory. As mentioned before, the AMP precipitation method has greatly reduced the MDA by almost one order of magnitude. It selectively filters out Cs isotopes from the sample. Moreover, the Compton continuum background from 40K is also shown to be noticeably reduced. However, the 795 keV peak from 228Ac is interfered with the 795.6 keV from 134Cs. Therefore, we found it difficult to resolve the peak from 134Cs even with very low background. The 604.7 keV peak from 134Cs can be well resolved from underlying background. The 609.3 keV peak from 214Bi appears in the vicinity of the 604.7 keV peak, but a good energy resolution of the HPGe detector helps the two peaks resolved clearly. It therefore should be noted that the 604.7 keV peak should be searched for in the 134Cs survey. It is then necessary to suppress background contributions underneath the 604.7 keV peak. The region near the peak is between the 661.7 keV 137Cs peak and its Compton edge. The yield in the region is thus mainly due to multiple Compton scattering of the 661.7 keV 137Cs gamma ray in a HPGe crystal. A possible experimental approach is a gamma-ray detection with a Compton suppressed system so that it may be possible to suppress such multiple Compton scattering events and to lower the MDA significantly. Figure 8 summarizes how to resolve peaks of and from the background.
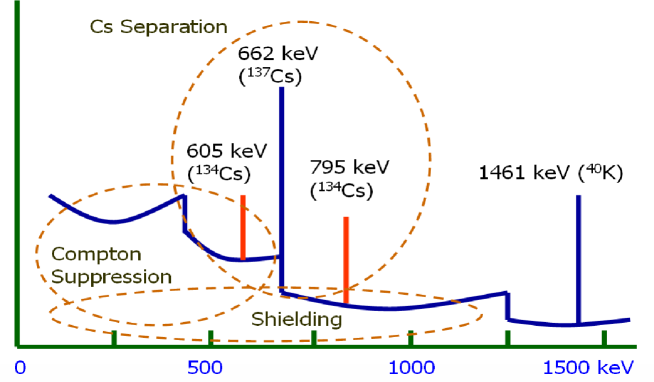
Table 1 lists the values of the MDA from the present work, with and without the AMP precipitation method considered.
| Location | without AMP | with AMP |
|---|---|---|
4 Summary and Conclusion
In the present work, we investigated the caesium concentrations in soil samples taken from mountain areas in the vicinity of the Gori nuclear power plant, emphasizing the minimum detection limit to the measurement of concentration. We carried out the sampling by taking cm layer of surface soil at the top areas of four different mountains within the km distance of the Gori nuclear power plant. We have used the ammonium molybdophosphase (AMP) precipitation method to get rid of the 40K existing in natural radioactivity, which reduces the minimum detectable activity (MDA) of activity about ten times smaller than those without the AMP precipitation method. Even though we were able to reduce the MDA for the from to by one order of magnitude smaller, using the ammonium-molybdophosphate precipitation method in order to lower the background mainly arising from the natural radioacnuclide , it is not possible to determine the concentration quantitatively.
While it is of great difficulty to track down the origin of the that are found in higher concentrations in soil samples near the Gori nuclear power plant, the results imply that the found in the samples are at least 20 years old. Taking into account the fact that the Chernobyl accident took place 22 years ago from now, one can assume that the present concentrations may have come from the Chernobyl explosion. Since it is known that the fallout ratio of the Chernobyl accident is about in 1986 (Thomas and Martin, 1986), the present ratio should be dropped to be about , considering that the half life-times of the and are, respectively, y and y. In fact, the fallout due to the Chernobyl accident did not affect Korea much, since the distribution of is similar to those of other countries (Kim et al., 1998). Thus, we can infer from it that the present concentration of the should be less than Bq/kg-dry which is definitely lower than the minimum detection limit reached in the present work.
In order to reduce the minimum detectable amount of activity further, we need to get rid of the Compton continuum, using the Compton suppression method, which is now under investigation.
Acknowledgment
The present work is supported by Inha University Research Grant.
References
-
Aoyama, M. et al., 2000. Low level measurements in deep seawater samples. App. Rad. and Isot. 53, 159-162.
-
Baskaran, M. et al., 2003. Temporal variations of natural and anthropogenic radionuclides in sea otter skull tissue in the North Pacific Ocean. J. Environ. Radioactivity 64, 1-18.
-
Currie, L.A., 1968. Limits for qualitative detection and quantitative determination, Application to radioactivity, Anal. Chem. (40), 586–593.
-
Djingova, R. and Kuleff, I., 2002. Concentration of caesium-137, cobalt-60 and potassium-40 in some wild and edible plants around the nuclear power plant in Bulgaria. J. Environ. Radioactivity 59, 61-73.
-
Kim, C. S., Lee, M. H., Kim, C. K., Kim, K. H., 1998. , , and concentrations in surface soils of Korea. J. Environmental Radioactivity 40, 75–88.
-
Mahara, Y., 1993. Storage and migration of fallout strontium-90 and cesium-137 for over 40 years in the surface soil of Nagasaki. J. Environmental Quality (22), 722–730.
-
Isaksson, M., Erlandsson, B., Mattsson, S., 2001. A 10-year study of the 137Cs distribution in soil and a comparison of Cs soil inventory with precipitation-determined deposition. J. Environmental Radioactivity 55, 47-59.
-
Nabyvanets, Y.B. et al., 2000. Distribution of in soil along Ta-han River Valley in Tau-Yuan County in Taiwan. J. Environ. Radioactivity 54, 391-400.
-
Pourcelot, L., Louvat, D., Gauthier-Lafaye and F., Stille, P., 2003. Formation of radioactivity enriched soils in mountain areas. J. Environmental Radioactivity 68, 215–233.
-
Renaud P, Louvat D., 2004. Magnitude of fission product depositions from atmospheric nuclear weapon test fallout in France. Health Phys., 353-358.
-
Robison, W. L., Conrado, C. L., Bogen, K. T., Stoker, A., 2003. The effective and environmental half-life of 137Cs at Coral Islands at the former US nuclear test site. J. of Environmental Radioactivity 69, 207-223.
-
Suss, M., Pfrepper, F., 1981. Investigation of the sorption of cesium from acidic solutions by various inorganic sorbents. Radiochemn. Acta 29, 33–40.
-
Thomas, A.J., Martin, J.-M., 1986. First assessment of Chernobyl radioactive plume over Paris. Nature 231, 817–819.
-
Tranter, T.J. et al., 2002. Evaluation of ammonium molybdophosphate-polyacrylonitrile (AMP-PAN) as a cesium selective sorbent for the removal of from acidic nuclear waste solutions. Adv. Environ. Res. 6, 107-121.
-
UNSCEAR, Report to the General Assembly, Sources and Effects of Ionizing Radiation. United Nations Scientific Committee on the Effects of Atomic Radiation; 2000.
-
Yoshida, S. and Muramatsu, Y. 1998. Concentrations of alkali and alkaline earth elements in mushrooms and plants collected in a Japanese pine forest, and their relationship with . J. Environ. Radioactivity 41, 183-205.
-
Zehnder, H.J. et al., 1995. Uptake and transport of radioactive cesium and strontium into grapevines after leaf contamination. Radiat. Phys. Chem. 46, 61-69.