Time-dependent H2 formation and protonation in diffuse clouds
Abstract
Aims. To demonstrate the time-approach to equilibrium of H2-formation and protonation in models of diffuse or H I interstellar gas clouds previously published by the author.
Methods. The microscopic equations of H2-formation and protonation are integrated numerically over time in such a manner that the overall structures evolve self-consistently under benign conditions.
Results. The equilibrium H2 formation timescale in an H I cloud with N(H) is yr, nearly independent of the assumed density or H2 formation rate on grains, etc. Attempts to speed up the evolution of the H2-fraction would require densities well beyond the range usually considered typical of diffuse gas. The calculations suggest that, under benign, quiescent conditions, H2 in the diffuse ISM formation of H2 is favored in larger regions having moderate density, consistent with the rather high mean kinetic temperatures measured in H2, 70-80 K.
Formation of H3+ is essentially complete when H2-formation equilibrates but the final abundance of H3+ appears more nearly at the very last instant. Chemistry in a weakly-molecular gas has particular properties so that the abundance patterns change appreciably as gas becomes more fully molecular, either in model sequences or with time in a single model. One manifestation of this is that the predicted abundance of H3+ is much more weakly dependent on the cosmic-ray ionization rate when n(H2)/n(H) . In general, high abundances of H3+ do not enhance the abundances of other species (e.g. HCO+) but late-time OH formation proceeds most vigourously in more diffuse regions having modest density, extinction and H2 fraction and somewhat higher fractional ionization, suggesting that atypically high OH/H2 abundance ratios might be found optically in diffuse clouds having modest extinction.
Key Words.:
interstellar medium – molecules1 Introduction.
The fact that individual H I/diffuse clouds have a substantial component of molecular hydrogen has been recognized observationally since the original Copernicus observations (Jura, 1974; Spitzer, 1978) and a quite high fraction of hydrogen in the nearby diffuse interstellar medium (ISM) overall is in molecular form (Savage et al., 1977; Liszt & Lucas, 2002). More surprising perhaps is the recent discovery that this molecular component hosts a rich polyatomic chemistry with relatively large amounts of H3+ (McCall et al., 2002) and a dozen other species including such ions as HCO+ (Lucas & Liszt, 1996) and HOC+ (Liszt et al., 2004) and molecules as complex as C3H2 (Cox et al., 1988; Lucas & Liszt, 2000), H2CO (Liszt & Lucas, 1995; Moore & Marscher, 1995; Liszt et al., 2002) and NH3 (Nash, 1990; Liszt et al., 2002).
The presence of copious H2 and relatively large amounts of H3+ in H I clouds is supported theoretically when self-shielding (Lee et al., 1996) is included in equilibrium models of diffuse gas (Liszt & Lucas, 2000; Liszt, 2003) using empirically-determined H2 formation rates (Jura, 1974; Spitzer, 1978; Gry et al., 2002); observed HD/H2 ratios are also explained as long as the cosmic-ray ionization rate is taken large enough to support the inferred proton density in the presence of atomic-ion neutralization on small grains. However, formation of H2 is a notoriously slow and supposedly rather fragile process. Moreover, it remains to be determined whether any such equilibrium is actually attained in the interstellar medium, which is the subject of this work.
Here we show the approach to equilibrium in the models discussed by Liszt & Lucas (2000), Liszt (2002) and Liszt (2003): we present calculations of time-dependent H2 and H3+ formation in small, mostly-static gas parcels meant to represent typical diffuse “clouds”, like, for instance, the “standard” H I cloud of Spitzer (1978). As we discuss, the distinguishing characteristic of the chemistry in such clouds is that the H2 formation process is unsaturated (n(H2) n(H)/2). For this reason the equilibrium timescales for H2 formation cannot be calculated from simple scaling arguments based on the local microscopic H2 formation rate, nor are they shortened by self-shielding, or in many cases by assuming higher density or even a higher rate constant for H2 formation on grains, etc. Furthermore the abundance of H3+ does not always vary as might be expected from consideration of its equilbrium chemistry in more fully molecular gas.
Section 2 gives details of the methods used in the calculations, results of which are presented and discussed in Sect. 3 and 4.
2 Details of the calculations and microphysics
2.1 Framework and initial conditions
The calculations presented here build on a framework which was established in the work of Wolfire et al. (1995). Specifically, the two-phase model of heating and cooling developed by Wolfire et al. (1995) (see also Wolfire et al. (2003)) was applied to small, uniformly illuminated spherical gas clots of constant density, intended to represent diffuse ’clouds’; our model, however, uses the gas-phase abundances of Savage & Sembach (1996) which makes them a bit hotter. Assumption of a geometry is required because the accumulation of H2 and CO depends on shielding by dust and other molecules and is, therefore, strongly non-linear. We used the shielding factors calculated by Lee et al. (1996). Typical densities and column densities considered here, n(H) , N(H) correspond to a Spitzer “standard cloud” (Spitzer, 1978) having a dimension of a few pc and median reddening 0.05 mag over the face of the cloud. The central column density in such an H I cloud corresponds to the regime where the appearance of high H2-fractions is first noted in the ISM.
In general, the hydrogen densities in our models (number or column) are assumed values. The temperature and thermal pressure follow from the details of the calculation, chiefly through the assumed gas-phase abundances of the dominant coolants carbon and oxygen, and the influence of the radiation field in heating the gas via the photoelectric effect on the same small grains which are so largely responsible for the overall charge balance. As shown in Fig. 9 of Liszt & Lucas (2000), a given value of the scaling factor (G0) for the overall radiation field produces a roughly constant thermal pressure in the outer regions of our models, increasing somewhat with assumed density and decreasing slightly going inward from the cloud edge. The generally-accepted value for the thermal pressure of the ISM, p/k K (Jenkins, 2002; Jenkins & Tripp, 2001) indeed applies to our typical model of the Spitzer “standard cloud” and the very densest models considered here have pressures a factor 2-3 times higher, as seems observationally to be the case as well.
The initial condition here is simply the equilibrium diffuse cloud model which would be calculated in the absence of any molecular chemistry, as is more typical in discussions of the overall structure of the diffuse ISM (Wolfire et al., 2003). That is, the initial model is equilibrated and self-consistent in terms of thermal and ionization equilibrium, but no molecule formation has occurred. Our models include the rudiments of molecular chemistry as discussed in several recent papers concerning questions of equilibrium CO, H2, HD and H3+ formation in diffuse gas (Liszt & Lucas, 2000; Liszt, 2002, 2003). Incorporation of the chemistry should not normally upset the basic microphysical balance (ionization, thermodynamic, etc.) in diffuse gas because such small fractions of oxygen and carbon are sequestered, although inclusion of OH and H2 formation can affect some aspects of the distribution of charge among species.
Another effect mitigating the influence of H2 formation in diffuse gas is the dominance of atomic-ion neutralization by small grains, substantially lowering the H+ and electron density which would otherwise obtain in the presence of cosmic-ray ionization of hydrogen (Wolfire et al., 1995; Liszt, 2003). This effect is of the utmost importance in understanding the interplay between the cosmic ray ionization rate (here taken as the rate per free H-nucleus) and abundance of H3+ (Liszt, 2003) . Detailed calculation including grain charging (Draine & Sutin, 1987; Weingartner & Draine, 2001) is required if the heating rate is to be properly calculated according to the prescription of Bakes & Tielens (1994).
2.2 Formation of H2
In this work we distinguish between the formation of H2, which we consider to be a microscopic physical effect occuring on individual large grains and involving individual or paired H-atoms, and the accumulation of H2 in the ISM, which is a macroscopic effect involving assumptions about cloud geometry, ISM topology, and so forth. The purpose of this work is to understand the macroscopic aspects of the accumulation of H2 in the ISM and we employ only the most standard, empirical, microscopic description of its formation.
That is, the volume formation rate of H2 is expressed as dn(H2)/dt = n(H) n(H I) RG vTcm3 s-1 n(H) n(H I) (Spitzer, 1978) where the factor n(H) (the total density of H-nuclei) represents a constant number of large H2-forming grains per H-nucleus in the gas; n(H I) is the density of atomic hydrogen (after protons, H- ions, and H2, etc. are reckoned) and the thermal velocity and/or kinetic temperature terms correspond to the speed at which H-atoms move through the gas, possibly encountering large grains. The rate constant RG nominally includes a sticking coefficient.
The inferred rate in the diffuse ISM has been remarkably steady over the last 25 years (Jura, 1974; Spitzer, 1978; Gry et al., 2002) and use of this simple formulation, combined with the modern shielding coefficients, accounts extremely well for the observations of H2 in diffuse lines of sight (Liszt & Lucas, 2000). As discussed in Sect. 3 (see Fig. 4) varying the assumed value of RG by factors of a few has appreciable effect upon the amount of H2 which is produced but the equilibrium time scale changes little. As an aside we note that the gas-phase formation of H2 via H-, which could account for some of the very low molecular fractions seen along lines of sight having low extinction (Liszt, 2002), is included in the present calculations as well but without much effect.
2.3 Solving the H2-accumulation problem
The equilibrium solutions for the radial distributions of CO, H2 and H3+ described in our earlier papers were achieved through what is essentially a relaxation method. An initially atomic sphere is divided into a substantial number (typically 100) of thin radial shells and the molecular densities are calculated for each, working inward, self-consistently accounting for the shielding which accrues from each configuration. Each time a quasi-equilibrium state is reached for the entire structure (that is, when the calculation has successively converged in each shell), the calculation starts anew at the outermost shell (whose H2-abundance was, after all, calculated in at least partial ignorance of the conditions interior to it) and the process is repeated until the whole structure varies sufficiently little between iterations. The process is not particularly difficult or unstable and convergence is rapid, typically requiring only a few seconds on a recent laptop computer. Note that the thermal and charge balance, etc. are continually updated during the calculation.
The time-dependent calculations basically just wrap the equilibrium solver in an outer loop which allows the entire structure to evolve self-consistently over short times. The time step, which initially cannot be as large as even 1000 years in most cases, is examined and lengthened by a factor of whenever the structure changes sufficiently little between time steps. The full time-dependent calculation is somewhat tedious, typically requiring several hours per model and much exercising of the tiny (but assertive) fan on the author’s laptop computer in cases of high H2-fraction.
2.4 Elementary analytic considerations of the time-dependent solutions for H2
Although the real solution to the time-dependent accumulation problem is strongly non-linear and can only be achieved globally over an entire geometrical construct, several important aspects of the problem may be understood with reference to a simple parametric treatment of purely local behaviour.
Accordingly, the local rate of accumulation of molecular hydrogen may be written
where is the rate of H2 destruction (mostly by cosmic rays and ultra-violet photons, although interaction of He+ and H2 is included in the numerical calculation), is the kinetic temperature (calculated in the models) and RG cm3 s-1 (see Sect. 2.2). After rewriting n(H I) = n(H) - 2 n(H2) (for the present purposes; all forms of hydrogen are considered in the numerical models) the solution is
where .
The time constant in the problem is 1/a, where a is a linear combination of the per-particle formation and destruction rates, observing the conservation of H-nuclei, and is therefore relatively short in weakly-shielded gas. The rate of accumulation of H2 takes on its highest value dn(H2)/dt = b at time 0 and the equilibrium solution n(H2)|t→∞ = b/a may be thought of as the result of accumulation at the maximum rate over a period of time 1/a. Thus, self-shielding (lowering ) cannot increase the rate at which H2 forms or speed up the accumulation of H2, it only increases the final amount of H2 by allowing the accumulation process to work longer. By lengthening the time-scale, self-shielding may also provide a buffer against sudden change once equilibrium is attained.
Increasing the microscopic formation rate constant or density will hasten the pace at which H2 accumulates but even so, global equilibria are not generally achieved more rapidly in cases where the H2 fraction would otherwise be small, as discussed in Sect. 3 (see Fig. 4); it only happens that more H2 is made (which requires somewhat more time). Maintenance of high equilibrium H2-fractions requires , which is roughly equivalent to reducing the photodestruction rate (of order s-1 in free space) to insignificance i.e. .
2.5 Weak vs. slow processes
Indeed, the situations which equilibrate most rapidly are those for which the H2 abundance is smallest, which exemplifies the fact that even processes like H2 formation or cosmic-ray ionization – which seem weak because they have low rates – may equilibrate quickly when not called upon to do very much; the time constant is then determined by the overall destruction rate, which may be high. It is for this reason that formation of H3+ – a much higher-order process which after all requires formation of H2, cosmic ray ionization of H2 and further interaction of H2+ and H2 (see Sect. 4.2) – is essentially complete as soon as H2 accumulation equilibrates: one need not wait for a further period 1/.
2.6 The cosmic-ray ionization rate
The evolution of the H2 fraction is largely independent of the assumed value of in our models but the standard cosmic-ray ionization rate assumed in the models in this work is s-1(the cosmic-ray destruction rate per H2 is slightly more than 2). This is approximately one order of magnitude larger than what is often used in calculations of cosmic-ray ionization of the ISM (Wolfire et al., 1995) especially for dense dark cloud chemistry and is about that which is needed to explain the overall abundance of H3+ (see Sect. 4). The equilibrium H3+ concentration is nearly proportional to in our models having larger H2 fractions (see Fig. 5) owing to the intervention of small-grain neutralization of protons: the formation can be pushed harder without unduly increasing the electron density and recombination rate for H3+. However, for reasons discussed in Sect. 4, the concentration of H3+ is more weakly dependent on in regions of small H2-fraction or when is very large.
2.7 Heating by cosmic rays and H2-formation
The current assumption is that the diffuse ISM is heated by the photoelectric effect on small grains in both the warm phase (where x-rays make a larger contribution) and cool phase. The heating rate as a function of density in partly-shielded gas is shown in Fig. 3 of Wolfire et al. (1995) based on the work of Bakes & Tielens (1994). As may be seen from that Figure, the cosmic ray heating rate is roughly 1.2 dex below that of the photoelectric effect in diffuse gas and 2-2.5 dex lower in cool gas, for = s-1. Thus the higher cosmic-ray ionization rates considered here may imply a substantial contribution to the heating of the warm gas by cosmic rays, harkening back to the very earliest discussions of two-phase equilibrium, before the role of diffuse X-ray heating was incorporated (Goldsmith et al., 1969). The highest cosmic-ray rates considered here still do not produce dominant heating effects in the cool neutral gas, but much higher ionization rates were recently suggested by Le Petit et al. (2004) for the line of sight to Persei.
In our models there is a modest contribution to the heating due to H2 formation, comparable to that arising from heating by cosmic-ray ionization of H I. The volume heating rate due to the latter is n(H I) where eV is the energy available for heating after the primary ionization. The equivalent rate for H2-formation is where represents that fraction of the heat of formation of H2 which is available to heat the gas. The heating rates for the two processes are very nearly equal under typical conditions, s-1, K, n(H) and = 1.5 eV.
2.8 The recombination rate of H3+ and other chemical reactions
The chemical rate constants used in our models have been taken from the UMIST database (Le Teuff et al., 2000) (see http://www.rate99.co.uk) including, for consistency with the results of Liszt (2003), the rate constant for e + H3+ recombination cm3 s-1. This rate has been measured many times, including, most recently and probably accurately, by McCall et al. (2003). Their measured values, at 23 K and 300 K, are 70% of those used in our work.
3 Time-dependent H2 accumulation in diffuse clouds
3.1 Evolutionary effect of varying column density
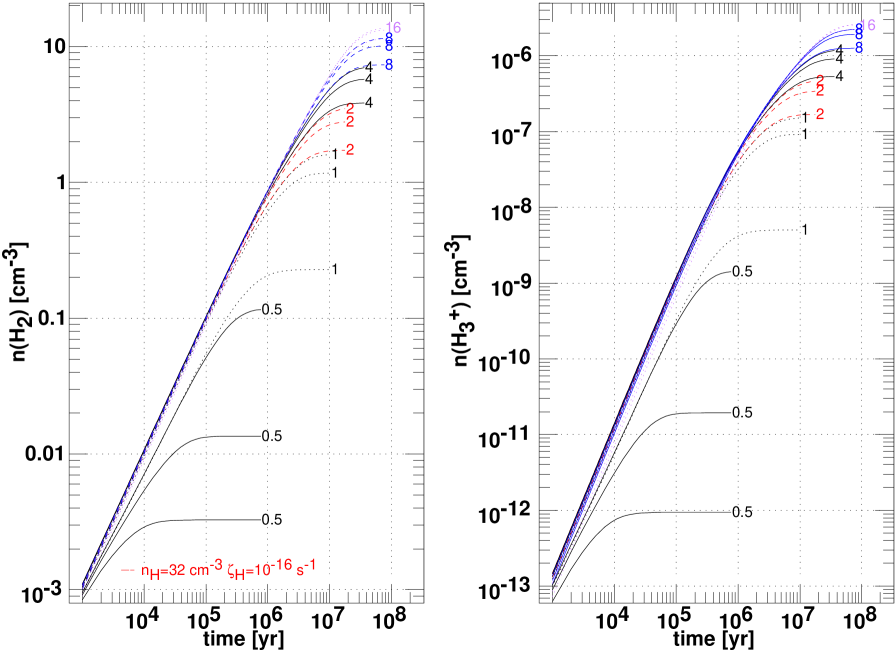
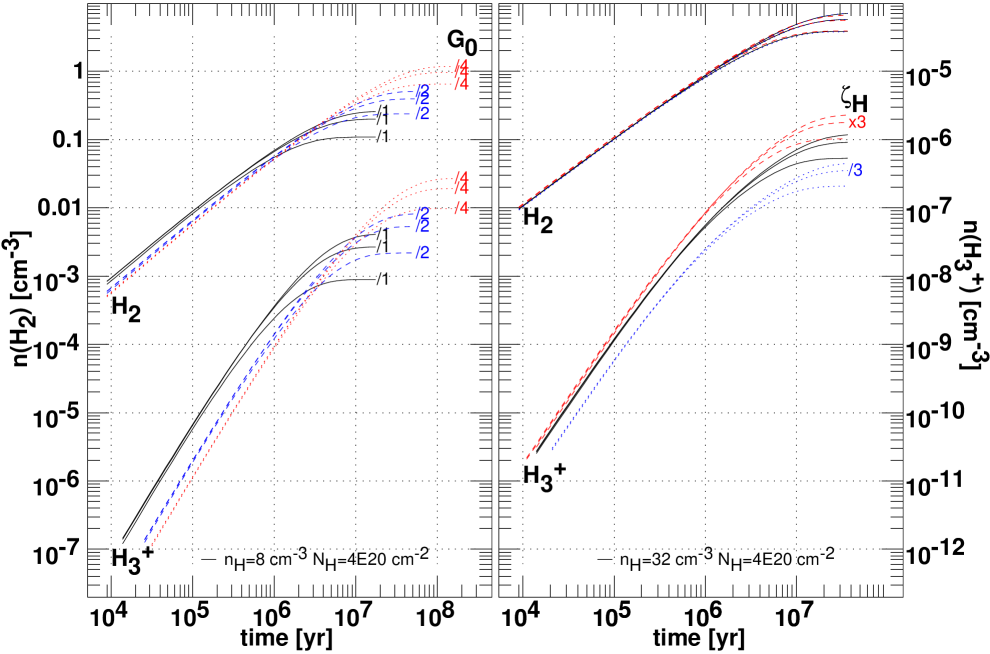
Figure 1 shows the evolution of the H2 and H3+ densities in a series of models, each having the same uniform total density of hydrogen n(H) threaded by a cosmic ray flux yielding . The central column density of hydrogen across the clouds N(H) (from edge to edge) varies from 0.5 to 16 , as indicated at the right hand side of each curve. The physical size of the models (diameter) in pc is, coincidentally, equal to the column density as labelled in units of . Three curves are shown for each model, corresponding to the shells centered at fractional radii 0, 1/3 and 2/3 from the center. These curves separate at larger times when the outermost regions have reached equililbrium. For a sphere, the median line of sight occurs at a fractional impact parameter of 2/3 where the column density traversed is 3/4 that at the center. The median line of sight through the model with central column density corresponds exactly to the standard H I cloud of Spitzer (1978).
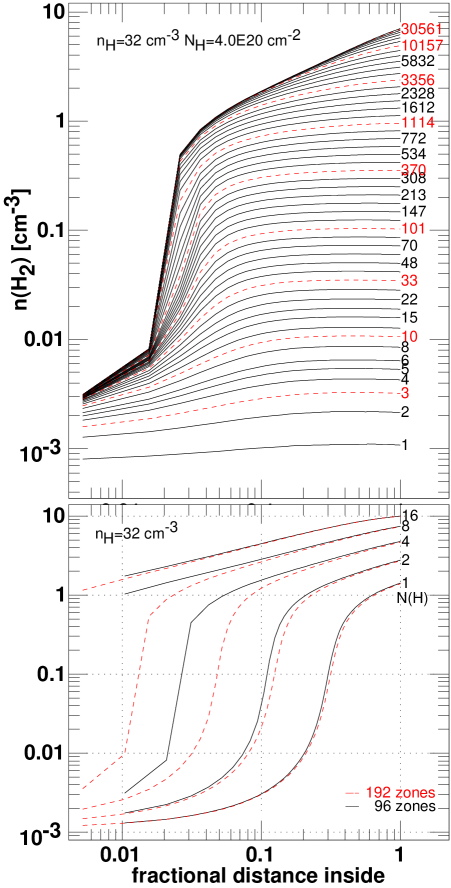
For the optically-thinnest model there is a large radial gradient in the H2 density and a wide disparity between the times required to reach equilibrium ( yr). The fact that such appreciable (easily detectable) amounts of H2 form in as little as 104 yr demonstrates why it is so hard to find lines of sight having measurable reddening which are devoid of H2. For N(H) as large as the H2 accumulation process is thoroughly saturated (n(H2) n(H)/2) when equilibrium is reached at very large times approaching yr. Models in which the equilibrium H2-distribution is more uniform also evolve more uniformly, as illustrated in Fig. 2 which shows (at top) the time-dependent evolution of the radial variation of n(H2) in the model resembling a “standard” H I cloud. The H2-density is remarkably constant for fractional radii of 90% or more for most of the first yr, after which a more molecular core develops, as well as a very thin (actually, unresolved) transition layer into a more nearly atomic envelope.
Clearly, self-shielding is important only at somewhat later times. In some models with moderate density, n(H2) behaves as a single power-law from center to edge, as illustrated in Fig. 2 at bottom which shows the equilibrium solutions for n(H2) corresponding to the models used in Fig. 1. However this is not a general feature of the equilibrium solutions. Figure 2 also illustrates the effect of finite resolution on the structure of the atomic envelope, which fractionally is substantially larger with higher resolution. The results in Fig. 1 are not affected by the illustrated doubling of the number of radial shells.
As shown in Fig. 1, even a standard H I cloud model has a very substantial fraction of molecular hydrogen in its interior. This of course is borne out observationally (Jura, 1974) as molecular fractions of 25%-45% are derived for even the diffuse ISM observed in uv/optical absorption lines of H2 and CH (Savage et al., 1977; Liszt & Lucas, 2002). Less obvious, however, is that the conditions so favourable to H2 may actually work for as long as the calculations require to reach equilibrium in Fig. 1, i.e. for times as long as yr.
3.2 Evolutionary effect of varying number density
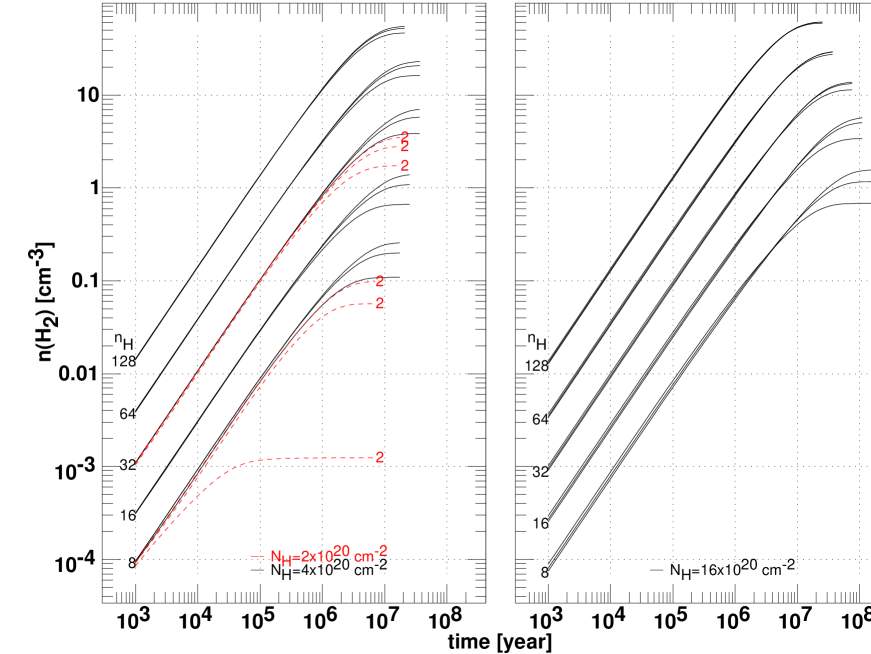
It seems natural to inquire in what ways the evolution might be hastened. Shown in Fig. 3 are results for series of models of different number density n(H) at column densities N(H) = . At least for moderate column densities, as shown at the left in Fig. 3, increasing the number density within the range expected for diffuse gas has surprisingly little effect on the time required for the models to reach equilibrium: the increased rate of accumulation is compensated by the tendency to produce more H2, making the equilibrium timescale about constant over a wide range of density for the standard H I cloud column density.
Only when very high H2 fractions are attained at a given density does increasing the density shorten the equilibrium time (i.e. Fig. 3 at right, or for the two very highest densities at left). With reference to Fig. 3, note that, although the local accumulation rate initially varies as n(H) n(H)3/2 in thermal pressure equilibrium, the total amount of H2 produced within a model at any time is much less dependent on density because the more tenuous models are larger, varying as 1/n(H). Obviously, all models in which the H2 accumulation saturates at high molecular fractions produce the same N(H2) if they have the same N(H), so less dense models having the same N(H2) then make more H2 molecules overall because they are larger.
3.3 Does size matter?
Physically larger clouds tend to produce more H2 in both series of models just discussed. Those in Fig. 1 with larger column density N(H) are physically larger and have higher internal molecular number density, so, at fixed number density, physically larger regions of higher column density are responsible for the very great bulk of the accumulation of H2. In Fig. 3, molecular number densities are higher in clouds of higher n(H), but usually not by such large amounts as to compensate for the very large differences in volume. That is, the model volumes vary by a factor whereas n(H2) varies by factors of 100-500 for the models with N(H) = . Over a substantial range in N(H), it is expected that the bulk of the molecules will form in (again) physically larger regions, but of lower density.
So is the bulk of the interstellar H2 really formed in large tenuous regions, or in more compact, denser ones? Observationally, the mean column density-weighted kinetic temperature inferred for H2-forming diffuse gas is 70–80 K (Savage et al., 1977; Shull et al., 2004), which, for typical interstellar thermal pressures, implies densities like those of the standard H I cloud 111Note that the surveys from which these mean temperatures are derived have somewhat low sample mean H2-fractions, 0.17-0.18.. Attempts to form the observed H2 more rapidly in regions of high density must account for these high kinetic temperatures; perhaps it is relevant that Jenkins & Tripp (2001) found a small but pervasive fraction of material at much higher than normal thermal pressure in typical diffuse clouds probed in the fine-structure excitation of C I. This high-pressure component is generally ignored in calculation of the mean thermal pressure in the ISM, but would approximately double it.
3.4 Changes in formation and dissociation rate constants
The empirically-inferred microscopic formation rate of molecular hydrogen formation has changed remarkably little since H2 was first observed in the ISM (Jura, 1974; Spitzer, 1978; Gry et al., 2002). Figure 4 shows the effects of changing the assumed H2 formation rate constant RG in some of the models illustrated in Fig. 1. Although the H2 column and number densities increase faster than linearly with changes in RG at late times, the timescale may only be shortened after the molecular fraction approaches its maximum possible value.
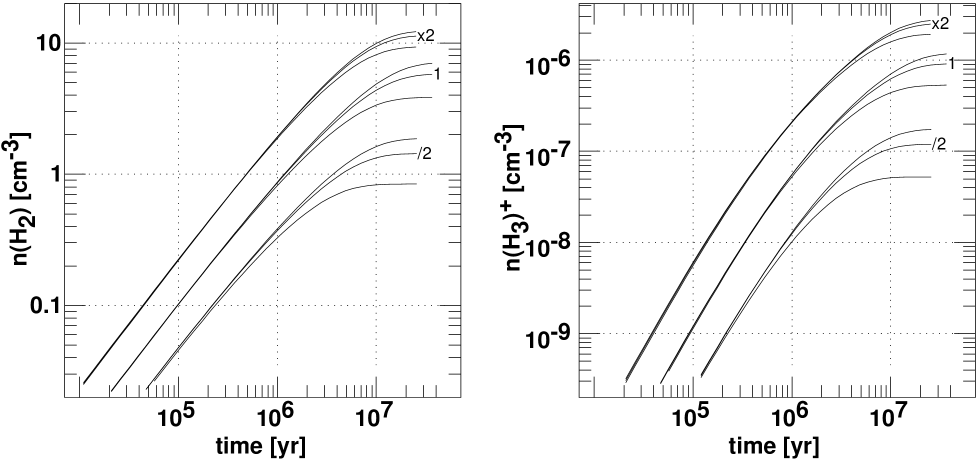
As noted in Sect. 2.4, high molecular fractions may only accrue in cases where the free-space photodissociation rate of H2 is attenuated (by dust and self-shielding) to the point where it is no more than competitive with cosmic-ray induced destruction rates. It follows that natural variations in the ambient interstellar radiation field (ISRF) may encourage or discourage H2 accumulation, but only modestly and at late times when equilibrium is approached. Shown in Fig. 5 at left are results for a lower-density model (n(H) ) at N(H) , with the ISRF lowered by factors of 2 and 4. Clearly the H2 accumulation process may be enhanced by making the material sufficiently dark, but only at the expense of incurring very long equilibrium times. Note that the darker models actually form and accumulate somewhat less H2 at smaller times because they are substantially cooler; lower photoelectic heating rates accompany lower photoionization rates for molecules. Clouds in very locally darker regions would have to be overpressured in order to compensate for this sluggishness, but in the ISM a tendency to higher thermal pressure at higher density seems a real effect.
Figure 5 at right shows the effect of varying the primary cosmic ray ionization rate by factors of three about the standard value s-1. Such variations have little effect on the equilbrium H2 densities in standard H I clouds as long as they are not so large as to upset the thermal balance (which can occur for ). The more complicated behaviour of H3+ is discussed in Sect. 4.
4 H3+ and other trace species
4.1 Evolution of n(H3+)
In the ISM there is a general increase in N(H3+) with reddening corresponding to N(H3+) over 6 magnitudes, or to N(H3+)/N(H) for the standard gas-reddening ratio N(H)/EB-V mag-1 (see Fig. 14 of McCall et al. (2002)).
As discussed previously (Liszt, 2003) or as shown in the figures here, n(H3+) concentrations comparable to those required can be produced in equilibrium models of diffuse clouds of moderate number and column density for cosmic ray ionization rates at or somewhat above s-1 (see Fig. 5 at right). Such models of H3+ in diffuse gas have the added virtue that the HD/H2 ratios observed in diffuse clouds – which are very sensitive to the actual proton density – are also reproduced.
As shown in the figures, the H3+ fraction is sensitive to the same effects which increase the concentration of H2, and in some circumstances to the cosmic ray ionization rate as well (Fig. 5 here). There are some more subtle effects which are less obvious in the figures: in models which achieve large H2-fractions, the electron density is lower by a factor of (typically) about two at late times because the gas cannot sustain high proton densities when most of the hydrogen is molecular.
Although the H3+ fraction equilibrates on very much the same final timescale as that of H2, the problem of timescales is somewhat more critical for H3+ because its time derivative is much steeper; the final concentration occurs more nearly at only the final moments of the calculation. Conversely, the H3+ fraction would deteriorate more rapidly should conditions suddenly become less hospitable. Of course this effect is mitigated slightly when the H3+ fraction is calculated with respect to H2 (instead of n(H)) but in most cases the lines of sight with known N(H3+) are not accessible to direct measurement of N(H2) or even N(H I). Note that H3+ is also more centrally concentrated than H2, but the effect is really strong only in models within which there are larger radial gradients in n(H2).
4.2 Effect of changing
The presence of high cosmic ray ionization rates in diffuse gas has been inferred from very elementary analysis of the H3+ abundance which treats it like an atomic ion (McCall et al., 2002). Assuming – as is true of dark, dense molecular gas – that every primary ionization of H2 leads to an H3+ ion and that H3+ ions are destroyed by electron recombination with a rate constant , there follows a simple, formal expression for the H3+ density:
The discrepancy between observation and the values of n(H3+) which result from putting typical values for , n(e), etc. in this expression is sufficient to suggest that s-1. Nonetheless, Eq. 3 is only a formal, very approximate solution for n(H3+) because of the implicit dependences of n(e) and upon the physical effects of ionization and heating (respectively) denoted by , and because of other, less obvious assumptions made about the molecular chemistry. Furthermore, the obvious changes in the H3+/H2 ratio with time show that such considerations might at best apply only at very late times (e.g Fig. 5 at right).
Figure 5 at right exhibits the further surprising result that the H3+ abundance is largely independent of the cosmic ray ionization rate at early times when the H2 abundance is small. This occurs because formation of H3+ is a multistep process with a resultant inverse dependence on the electron density which may be much faster than linear (as suggested by Eq. 3), combined with the tendency (suppressed but not eliminated by neutralization of atomic ions on small grains) for the ionization fraction to increase with .
In a somewhat simplified form neglecting chemical reactions of H2+ and H3+ with neutral atoms etc. (appropriate in diffuse gas), and the complexities of grain neutralization, the main steps involved in forming and destroying H3+ and its immediate antecedent H2+ are:
So, whenever the recombination described in reaction 4b dominates over the protonation in reaction 4c, the abundance of H2+ will be inversely proportional to n(e) and n(H3+) n(H2) n(H2+)/n(e) /n(e)2. Calculating the ionization balance in an atomic gas according to the prescription in Spitzer (1978) indeed yields n(e) for s-1 under conditions typical of H I clouds.
For the model of a typical H I cloud shown at right in Fig. 5, such considerations are apparently sufficient to remove much of the dependence on from the H3+ density at early times. To ascertain the conditions under which this effect is important, note that the recombination coefficient of H2+ is s-1 and reaction 4c proceeds with a rate constant s-1 in the UMIST database, see Le Teuff et al. (2000) or http://www.rate99.co.uk. Thus for = 100 K and taking n(e) as a small multiple () of the gas-phase abundance of carbon, n(C+) n(H), it follows that recombination dominates and the functional dependence of n(H3+) upon is weakened for n(H2)/n(H) 0.05, with higher H2 concentrations required for higher n(e) and/or . In Fig. 5 at right, this is case for the first yr.
4.3 Influence of H3+ on other trace molecule abundances
In general the surprisingly high abundance of H3+ in diffuse gas should not alter significantly the patterns of abundance of other trace species under the quiescent conditions discussed here, and it will certainly not by itself explain such outstanding mysteries as the high abundances of CH+, NH, HCO+, etc. For the former, the reaction C + H3+ CH+ + H2 is exothermic but not particularly fast and the fraction of gas-phase carbon which is neutral is very small in diffuse gas, typically below 1%: this forms only miniscule amounts of CH+ (more CH+ might be formed by the reaction of C with H2+). For NH (Crawford & Williams, 1997; Meyer & Roth, 1991), the reaction of N and H3+ is endothermic. For HCO+, which in dark clouds is formed via the reaction H3+ + CO HCO+ + H2, the amounts of both H3+ and CO are too small in diffuse clouds to sustain HCO+ against its recombination to CO, HCO+ + e CO + H2. CO can form from HCO+ in quiescent diffuse gas (Liszt & Lucas, 2000), but not the other way around.
One species for which H3+ might make a difference is OH, because both the reactions O + H3+ OH+ + H2 (rate constant cm 3 s-1) and O+ + H2 OH+ + H (rate constant cm 3 s-1) are exothermic. Figure 6 shows the time evolution of the volume formation rate of OH+ through both routes (shown are n(O)n(H3+) and n(O+)n(H2)) in three models threaded by a high cosmic ray flux, s-1, at three densities n(H) = 32 , 64 and 128 . The cloud diameter is held fixed so that N(H) , and , respectively, purposely driving the highest density gas to very high H2 fractions and H3+ abundances at late times.
As shown in Fig. 6, the reaction of O and H3+ is never a dominant source of OH+. The figure does show, however, the effect of ionization balance on the OH formation rate (see also Sect. 2.3 of Liszt (2003)): at later times the first step toward OH formation occurs more vigorously in the more tenuous models because their higher ionization levels (both overall and in oxygen) more than compensate for lower H2 fractions. In the models with larger H2 fractions, the proton density declines at late times because a more nearly molecular gas cannot sustain a high proton density and the O+/O ratio also declines, due partly to its rapid charge exchange reaction with hydrogen and because of its rapid reaction with H2. The cosmic-ray ionization alone, even at the high rates assumed here, cannot support high ionization fractions in atomic hydrogen or oxygen in the presence of PAH and high H2 concentrations.
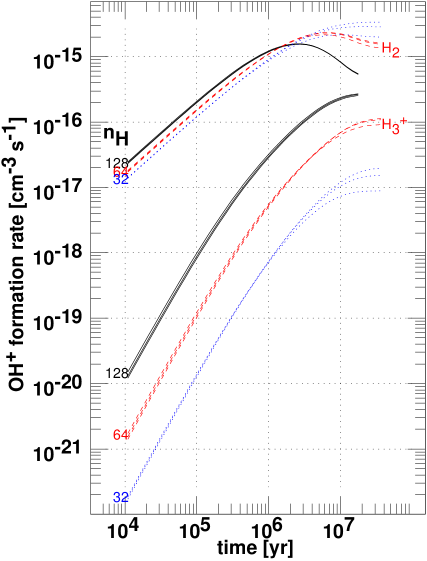
The next (necessary) step toward OH formation, OH+ + H2 OH2+ + H will dominate over recombination of the OH+ ion for H2-fractions as small as 2% at diffuse cloud temperatures. Thus, the thinner models will actually form OH more rapidly (not just OH+), as the H2 accumulation process equilibrates 222At early times, the formation of OH in less dense clouds will be seriously impeded by their larger e/H2 ratios and the denser models may make more OH. As with H3+ itself, high OH abundances only appear at the conclusion of the H2 accumulation process. Chemical effects like those shown in Fig. 6 undoubtedly contribute to the appearance of radio frequency OH emission in the envelopes of dark clouds well outside the most strongly molecular regions (see Wannier et al. (1993) and Fig. 6 of Liszt & Lucas (1996)). In the current context we expect/predict that regions of higher than normal OH abundance should be found optically in diffuse clouds having modest extinction and H2fractions.
5 Summary and discussion
5.1 Summary
We showed the approach to equilibrium under benign conditions for some recently-published models (Liszt & Lucas, 2000; Liszt, 2002, 2003), calculating the time-dependent H2 and H3+ formation in pc-size, otherwise largely static gas parcels meant to represent typical quiescent diffuse “clouds”. We pointed out that self-shielding does not hasten the formation or accumulation of H2, although it may foster the production of more H2 over longer times. Because the H2 formation process in diffuse gas is incomplete, timescales can in general not be deduced from simple scaling arguments based on the local H2 formation rate. The equilibrium H2 formation timescale in an H I cloud having a column density N(H) is yr, nearly independent of the assumed density or H2 formation rate on grains, etc. Under the benign conditions described here, the bulk of the H2 formation in the diffuse ISM actually occurs under diffuse conditions in physically larger regions of moderate density; that is, there is little apparent advantage in hypothesizing a process which forms H2 in denser clumps, if the density remains within the range inferred for quiescent diffuse gas.
Other species reach equilibrium essentially as soon as H2 does, even when they involve higher-order and/or very “slow” processes (like cosmic ray ionization of H2) but their equilibrium abundances appear more nearly at just the last minute; it is more critical for explaining H3+ that conditions equilibrate than, say, for H2 itself. This is also relevant because the chemistry of a weakly-molecular gas – which could be either a model of low density or one of higher density at early time – behaves in various particular ways. For instance, the predicted abundance of H3+ is less strongly dependent on the cosmic-ray ionization rate when n(H2)/n(H) .
Attempts to form increased amounts of H3+ may be thwarted at very high assumed values of both because the fractional ionization increases and because the H2-fraction declines as cosmic-ray ionization overtakes photodissociation as the main H2-destruction mechanism. Assuming will also change the thermal balance in the diffuse ISM as a whole as cosmic-ray ionization becomes the dominant heating process in both warm and cold neutral diffuse gas. Although observations of both HD and H3+ seem to indicate an enhanced low-level source of hydrogen ionization, it is important to ascertain whether it is indeed a cosmic-ray related process which is responsible (or some other form of very hard radiation) and whether any related effects occur in other phases of the interstellar medium, either in the warm or dark gas.
The presence of relatively high H3+ abundances per se probably does not have strong effects on the chemistry of other trace species whose abundances are puzzling (CH+, NH, HCO+ etc.) or on those of species like OH which are generally considered to be better understood. However, in considering competition between OH formation paths through H2 and H3+, we showed that late-time OH formation proceeds most vigourously in more diffuse regions having modest density, extinction and H2 fraction and somewhat higher fractional ionization, suggesting that high OH abundances might be found optically in diffuse clouds having modest extinction.
5.2 Lifetimes of diffuse clouds and their H2
In this work we modelled the formation and accumulation of H2 under conditions like those which are inferred from observations of the H2 and related neutral gas species themselves; temperatures from H2 (Savage et al., 1977; Shull et al., 2004) and mean thermal pressures (densities) from C I (Jenkins & Tripp, 2001). Although modest amounts of H2 form quickly enough that molecule-free sightlines are relatively rare, the observed high mean molecular fractions of 25%-40% (Savage et al., 1977; Liszt & Lucas, 2002) are achieved only over timescales of yr or longer, when starting from scratch.
H2 aside, timescales for thermal, ionization, chemical equilibrium are short (Spitzer, 1978; Wolfire et al., 2003; Rawlings et al., 2002) and diffuse gas is not normally thought of as having much longevity in any particular form. The H I cloud spectrum evolves under the continual influences of cloud-cloud collisions, evaporation, passage of supernova blast waves and stellar wind shocks (Chieze & Lazareff, 1980) and in a 3-phase model of the diffuse ISM, gas in any particular volume element turns over on timescales shorter than yr according to McKee & Ostriker (1977).
How then are high H2 fractions and short diffuse gas lifetimes to be reconciled? This question has never really been considered when the overall structure of the diffuse ISM is modelled, but there are several alternatives. 1) The long equilibrium timescales under diffuse neutral conditions provide, in reverse, some resilience which might help pre-existing H2 to weather the changes which occur. 2) Dark clouds have haloes (Wannier et al., 1993; Bensch, 2006) and it has been suggested that the molecules supposedly seen in diffuse clouds are actually located around and exchanging material with dark clouds (Federman & Allen, 1991); this may be true in some cases, but complex trace molecules are also seen along sightlines which are quite well separated from the nearest dark material (Liszt et al., 2002). 3) Perhaps most promisingly, turnover within diffuse neutral gas due to turbulence, rapidly cycling material through a very dense phase, may provide for much faster formation of H2 and trace species (Glover & Mac Low, 2005; Falgarone et al., 2005), establishing high molecular fractions from scratch on short timescales. The small fraction of neutral material which is observed to exist at very high pressure within diffuse clouds (Jenkins & Tripp, 2001) and other aspects of small-scale structure in diffuse gas (Deshpande, 2000) may perhaps also be understood in such terms.
Acknowledgements.
The National Radio Astronomy Observatory is operated by Associated Universites, Inc. under a cooperative agreement with the US National Science Foundation. The calculations described here were mostly completed while the author was enjoying the hospitality of Bel ’Esperance and La Clemence in Geneva and the Hotel de la Paix in Lausanne. The author is grateful to the referee and the editor for several stimulating comments.References
- Bakes & Tielens (1994) Bakes, E. L. O. & Tielens, A. G. G. M. 1994, ApJ, 427, 822
- Bensch (2006) Bensch, F. 2006, A&A, 448, 1043
- Chieze & Lazareff (1980) Chieze, J. P. & Lazareff, B. 1980, A&A, 91, 290
- Cox et al. (1988) Cox, P., Güsten, R., & Henkel, C. 1988, A&A, 206, 108
- Crawford & Williams (1997) Crawford, I. A. & Williams, D. A. 1997, Mon. Not. R. Astron. Soc., 291, L53
- Deshpande (2000) Deshpande, A. A. 2000, Mon. Not. R. Astron. Soc., 317, 199
- Draine & Sutin (1987) Draine, B. T. & Sutin, B. 1987, ApJ, 320, 803
- Falgarone et al. (2005) Falgarone, E., Pineau Des Forêts, G., Hily-Blant, P., & Schilke, P. 2005, in IAU Symposium, ed. D. Lis, G. Blake, & E. Herbst, 105–+
- Federman & Allen (1991) Federman, S. R. & Allen, M. 1991, ApJ, 375, 157
- Glover & Mac Low (2005) Glover, S. C. O. & Mac Low, M.-M. 2005, in IAU Symposium, ed. D. C. Lis, G. A. Blake, & E. Herbst, 160–164
- Goldsmith et al. (1969) Goldsmith, D. W., Habing, H. J., & Field, G. B. 1969, ApJ, 158, 173+
- Gry et al. (2002) Gry, C., Boulanger, F., Nehmé, C., Pineau des Forêts, G., Habart, E., & Falgarone, E. 2002, A&A, 391, 675
- Jenkins (2002) Jenkins, E. B. 2002, ApJ, 580, 938
- Jenkins & Tripp (2001) Jenkins, E. B. & Tripp, T. M. 2001, Astrophys. J., Suppl. Ser., 137, 297
- Jura (1974) Jura, M. 1974, ApJ, 191, 375
- Le Petit et al. (2004) Le Petit, F., Roueff, E., & Herbst, E. 2004, A&A, 417, 993
- Le Teuff et al. (2000) Le Teuff, Y. H., Millar, T. J., & Markwick, A. J. 2000, aas, 146, 157
- Lee et al. (1996) Lee, H. H., Herbst, E., Pineau Des Forets, G., Roueff, E., & Le Bourlot, J. 1996, A&A, 311, 690
- Liszt (2002) Liszt, H. 2002, A&A, 389, 393
- Liszt (2003) —. 2003, A&A, 398, 621
- Liszt & Lucas (2002) Liszt, H. & Lucas, R. 2002, A&A, 391, 693
- Liszt et al. (2004) Liszt, H., Lucas, R., & Black, J. H. 2004, A&A, in press, 900
- Liszt et al. (2002) Liszt, H., Lucas, R., & Pety, J. 2002, A&A, 448, 253
- Liszt & Lucas (1995) Liszt, H. S. & Lucas, R. 1995, A&A, 299, 847
- Liszt & Lucas (1996) —. 1996, A&A, 314, 917
- Liszt & Lucas (2000) —. 2000, A&A, 355, 333
- Lucas & Liszt (1996) Lucas, R. & Liszt, H. S. 1996, A&A, 307, 237
- Lucas & Liszt (2000) —. 2000, A&A, 358, 1069
- McCall et al. (2002) McCall, B. J., Hinkle, K. H., Geballe, T. R., Moriarty-Schieven, G. H., Evans, N. J., Kawaguchi, K., Takano, S., Smith, V. V., & Oka, T. 2002, ApJ, 567, 391
- McCall et al. (2003) McCall, B. J., Huneycutt, A. J., Saykally, R. J., Geballe, T. R., Djuric, N., Dunn, G. H., Semaniak, J., Novotny, O., Al-Khalili, A., Ehlerding, A., Hellberg, F., Kalhori, S., Neau, A., Thomas, R., Österdahl, F., & Larsson, M. 2003, Nature, 422, 500
- McKee & Ostriker (1977) McKee, C. F. & Ostriker, J. P. 1977, ApJ, 218, 148
- Meyer & Roth (1991) Meyer, D. M. & Roth, K. C. 1991, ApJ, 376, L49
- Moore & Marscher (1995) Moore, E. M. & Marscher, A. P. 1995, ApJ, 452, 671
- Nash (1990) Nash, A. G. 1990, Astrophys. J., Suppl. Ser., 72, 303
- Rawlings et al. (2002) Rawlings, J. M. C., Hartquist, T. W., Williams, D. A., & Falle, S. A. E. G. 2002, A&A, 391, 681
- Savage et al. (1977) Savage, B. D., Drake, J. F., Budich, W., & Bohlin, R. C. 1977, ApJ, 216, 291
- Savage & Sembach (1996) Savage, B. D. & Sembach, K. R. 1996, Ann. Rev. Astrophys. Astron., 34, 279
- Shull et al. (2004) Shull, J. M., Anderson, K., Tumlinson, J., & FUSE Science Team. 2004, American Astronomical Society Meeting, 204,
- Spitzer (1978) Spitzer, L. 1978, Physical processes in the interstellar medium (New York Wiley-Interscience, 1978. 333 p.)
- Wannier et al. (1993) Wannier, P. G., Andersson, B.-G., Federman, S. R., Lewis, B. M., Viala, Y. P., & Shaya, E. 1993, ApJ, 407, 163
- Weingartner & Draine (2001) Weingartner, J. C. & Draine, B. T. 2001, Astrophys. J., Suppl. Ser., 134, 263
- Wolfire et al. (1995) Wolfire, M. G., Hollenbach, D., McKee, C. F., Tielens, A. G. G. M., & Bakes, E. L. O. 1995, ApJ, 443, 152
- Wolfire et al. (2003) Wolfire, M. G., McKee, C. F., Hollenbach, D., & Tielens, A. G. G. M. 2003, ApJ, 587, 278