Chandra observations of the hybrid morphology radio sources 3C 433 and 4C 65.15: FR IIs with asymmetric environments
Abstract
We present Chandra observations of the hybrid morphology radio sources 3C 433 and 4C 65.15, two members of the rare class of objects possessing an FR I jet on one side of the core and an FR II lobe on the other. The X-ray spectrum of 3C 433 shows intrinsic absorption (with a column density of cm-2), such as is typical of FR II narrow-line radio galaxies. There is excess X-ray emission below 2 keV containing contributions from diffuse soft X-ray emission (likely hot gas with 1.2 keV) as well as from the nucleus. The core of 3C 433 is extended in hard X-rays, presumably due to X-ray emission from the inner-jet knot on the FR I side that is apparent in the radio map. It is possible that the X-ray emission from this inner-jet knot is absorbed by the dust known to be present in the host galaxy. The spectrum of 4C 65.15 can be modeled with a simple power law with perhaps mild intrinsic absorption ( cm-2). X-ray emission is detected at the bend in the FR I jet. This X-ray jet emission lies above the extrapolation from the high-frequency radio synchrotron emission and has a spectral slope flatter than , indicating that the jet spectral energy distribution is concave as with other FR II quasar jets. Both 3C 433 and 4C 65.15 have unabsorbed X-ray luminosities, radio luminosities, and optical spectra typically seen in comparable sources with FR II morphologies. Presumably the FR I structure seen on one side in these hybrid sources is generated by a powerful jet interacting with a relatively dense environment.
1 Introduction
Radio-loud active galactic nuclei with extended radio emission may be broadly classified as either edge-darkened or edge-brightened. As defined following Fanaroff & Riley (1974), FR I sources show initially prominent jets tapering off into dim and diffuse plumes, whereas FR II sources show tightly collimated jets terminating in luminous hotspots and complex lobes. FR I sources are typically less radio luminous than are FR IIs (Fanaroff & Riley 1974), with the dividing luminosity being an increasing function of host-galaxy optical luminosity (Owen & Ledlow 1994). At low redshift FR Is tend to inhabit richer groups than do FR IIs (e.g., Zirbel 1997) although this trend seems to vanish at moderate redshift ( 0.3; e.g., Auger et al. 2008). Less than 1% of radio sources possess both an FR I jet and an FR II lobe on the opposite side of the core (Gawroński et al. 2006). Gopal-Krishna & Wiita (2000) argue that the structure of such “HYMORS” (HYbrid MOrphology Radio Sources) is most plausibly due to the propagation of twin jets into an asymmetric medium. Despite their rarity, such mixed sources are of significant general interest to understanding the degree to which the surrounding environment influences morphology and FR type.
X-ray observations provide a productive approach toward understanding the nature of hybrid morphology sources, since the X-ray properties of the nucleus and jets in FR IIs are broadly distinct from those of FR Is. FR Is show correlations between radio, optical, and X-ray nuclear luminosity (extending to beamed sources), suggesting that the majority of the core emission in FR Is, from radio to X-ray wavelengths, is produced in an unresolved synchrotron-emitting jet (e.g., Chiaberge et al. 2000; Evans et al. 2006). The X-ray spectra of FR I sources typically do not show significant intrinsic absorption, and it is unlikely that apparently unabsorbed FR Is harbor a luminous accretion disk hidden by heavy absorption, as they are not particularly bright at IR wavelengths (e.g., Müller et al. 2004); this implies that most FR Is are likely inefficient accretors (e.g., Chiaberge et al. 2000; Evans et al. 2006). FR IIs display a wider range of observed properties, presumably related to their inclination to the line of sight. Some unification models (e.g., Urry & Padovani 1995) for radio-loud FR II sources connect narrow-line radio galaxies (NLRGs), broad-line radio galaxies (BLRGs), and radio-loud quasars (RLQs) based on viewing angle in a manner similar to radio-quiet unification schemes: NLRGs are thought to be shrouded by a dusty torus, BLRGs allow a clear view of the central engine, and RLQs are seen closer to the axis of the jet. Indeed, BLRGs show optical emission well in excess of that predicted by the FR I radio-optical correlation, presumably from the accretion disk (e.g., Varano et al. 2004). X-ray studies also offer broad support for unification models, as NLRGs generally show significant ( cm-2) intrinsic absorption (e.g., Evans et al. 2006) but RLQs typically do not (e.g., Belsole et al. 2006)111Some high-redshift RLQs display significant intrinsic X-ray absorption (e.g., Yuan et al. 2006 and references therein).; the X-ray spectrum of RLQs flattens as inclination to the line of sight decreases, consistent with increasing dominance from a beamed jet (e.g., Belsole et al. 2006).
X-ray observations also show clear differences between the properties of the kpc-scale jets in FR Is and FR IIs. FR I jets have flat or convex spectral energy distributions (SEDs), with , and steep X-ray power-law spectra ( 2), consistent with a common synchrotron origin for the radio-to-X-ray jet emission (e.g., Worrall & Birkinshaw 2006). However, the concave SEDs and flatter X-ray spectra seen in FR II quasar jets require a distinct origin for the X-ray jet emission. One commonly discussed model is Compton upscattering of cosmic microwave background photons (IC/CMB; e.g., Tavecchio et al. 2000), a particularly efficient method of X-ray production at small inclination angles and large redshifts; however, the predicted dominance of X-ray jets over core emission at high redshifts (Schwartz 2002) has not yet been observed (e.g., Bassett et al. 2004; Lopez et al. 2006), and there are additional complications to the IC/CMB model (e.g., Hardcastle 2006). An appealing alternative is that the X-ray jet emission in RLQs with concave SEDs may arise from a second population of highly energetic synchrotron-emitting electrons (e.g., Atoyan & Dermer 2004).
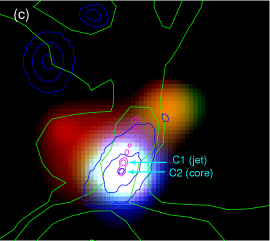
We report here on recent Chandra observations of the hybrid radio sources 3C 433 and 4C 65.15. 3C 433 is a low-redshift ( = 0.102) NLRG with highly unusual extended radio emission (e.g., van Breugel et al. 1983), giving it an ambiguous FR I/II morphological classification (Wills et al. 2002). There is a luminous southern FR II lobe that includes a primary hotspot and bright outer ridges and a knotty northern FR I jet ending in a diffuse plume that stretches perpendicularly to the east.222For simplicity we will refer throughout to the “FR II lobe” and “FR I jet” in each object; these classifications should be understood to refer to the dominant type of structure on a given side. The complex southern lobe contains considerable cold gas, as indicated by HI measurements (Mirabel et al. 1989; Morganti et al. 2003). Black et al. (1992) resolve the core into two components (C2 and C1) separated by only 1 kpc; the northern core component (C1) is most likely an inner jet knot. 4C 65.15 ( = 1.625) was noted as a possible hybrid object by Gopal-Krishna & Wiita (2000); the radio image shows a southern jet lacking a primary hotspot (Lonsdale et al. 1993) that peaks in brightness as it abruptly bends at a right angle and then gradually expands and fades away to the west, somewhat similar to the striking structure of the FR I jet of 3C 433. The (strongly polarized) northern FR II hotspot is much brighter than the nucleus at 8.5 GHz. The Sloan Digital Sky Survey (SDSS; York et al. 2000) spectrum of 4C 65.15 shows typical quasar C IV, C III, and Mg II broad emission lines; 4C 65.15 also has associated narrow absorption blueward of the C IV emission line (Vestergaard 2003). Both objects have radio luminosities consistent with those of comparable FR II sources. Both also are lobe-dominated; while the RLQ 4C 65.15 is presumably inclined closer to the line of sight than the NLRG 3C 433, beaming or projection effects alone cannot explain the hybrid structure in either case. The primary scientific goal for this project is to determine the fundamental nature of these objects through categorizing their nuclear and jet X-ray properties as either FR I, FR II, or mixed.
This paper is organized as follows: 2 presents the X-ray observations and relevant images, 3 describes analysis of the 3C 433 data, 4 describes analysis of the 4C 65.15 data, 5 discusses the results in the context of known properties of FR Is and FR IIs, and 6 summarizes the main conclusions of this work. A standard cosmology with = 71 km s-1 Mpc-1, = 0.27, and = 0.73 is assumed throughout. This choice results in luminosity distances of 465 and 12160 Mpc and angular-distance scales of 1.86 and 8.56 kpc arcsec-1 for 3C 433 and 4C 65.15, respectively. The Galactic column density toward 3C 433 ( = 21 23 44.5, = +25 04 27) is 1.191021 cm-2; toward 4C 65.15 ( = 13 25 29.7, = +65 15 13) it is 1.951020 cm-2. Unless otherwise noted, errors are given as 90% confidence intervals for one parameter of interest ( = 2.71).
2 Observations
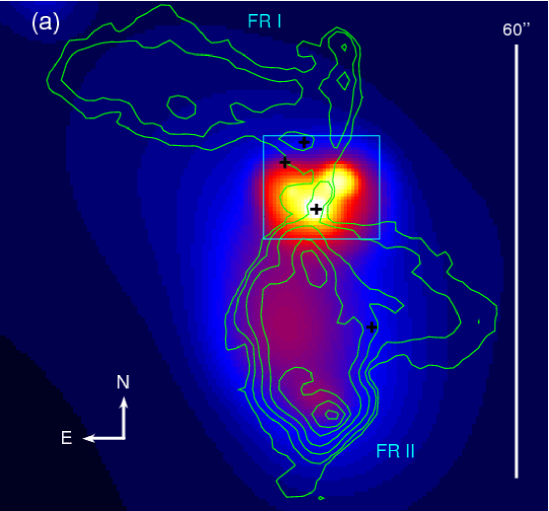
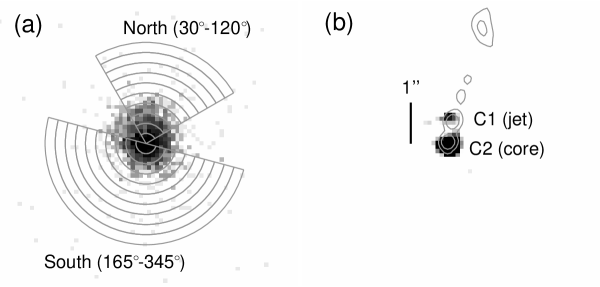
3C 433 was observed by Chandra on 2007 Aug 28 using ACIS-S3 in a standard 1/2 subarray. After Good Time Interval (GTI) filtering the exposure time was 37.2 ks, and the count rate from the core was 0.076 counts s-1; there are 2800 total counts in the core. The source light curve does not show significant variability. Radio and optical data help place the Chandra results in context. We make use of high-resolution radio maps of 3C 433 created from archival VLA data at two frequencies: a 1.5 GHz image with a resolution of 1.0′′ (from observations conducted on 1986 Apr 25) illustrates the large-scale radio structure, while a 8.3 GHz image with a resolution of based on data presented in Black et al. (1992) reveals the structure of the inner jet. An HST WFPC2 image was retrieved from the MAST archives333Multimission Archive at STScI: http://archive.stsci.edu/index.html; these data were previously discussed by de Koff et al. (1996), who noted the large-scale dust absorption features in the host galaxy. An adaptively smoothed 0.5–2 keV image is shown in Figure 1a, overlaid with 1.5 GHz radio contours. The smoothed image was generated using the CIAO task csmooth with a minimum significance (S/N ratio) of 2 and a maximum significance of 5. There is extended X-ray emission within the southern lobe and to the north on either side of the radio jet; these structures are also apparent in unsmoothed images. Closer investigation reveals that the X-ray nucleus is resolved by Chandra (see 3).
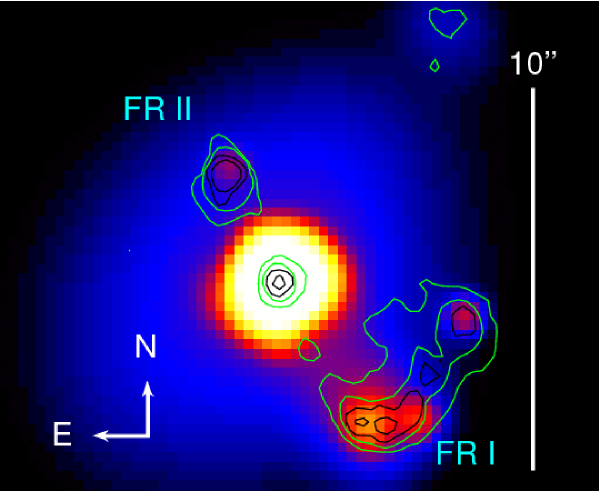
4C 65.15 was observed by Chandra on 2007 Jul 20 using ACIS-S3 in full-frame mode. After GTI filtering the effective exposure time was 35.8 ks and the count rate in the core was 0.044 counts s-1; there are 1600 total counts in the core. The source light curve shows mild (20%) variability on ks timescales. Analysis of the jet and environment of 4C 65.15 was aided by 8.5 GHz radio data with a resolution of (from observations conducted on 1999 Aug 9), 4.9 GHz data with a beamsize of 0.47 at position angle 13∘ (from observations conducted on 1983 Sep 19), and optical data in the form of an -band SDSS image. An adaptively smoothed 0.5–8 keV image is shown in Figure 2, overlaid with radio contours. The smoothed image was created from an image rebinned to 0.25′′ pixels from which the pipeline pixel randomization had been removed, and was generated using the CIAO task csmooth with a minimum significance of 1.5, a maximum significance of 5, and an initial minimum smoothing scale of 1.3 pixels. The X-ray core is unresolved. X-ray jet emission is detected at the location of the bend on the FR I side of the nucleus and appears to extend along the jet. There appears to be X-ray emission near the tail444Lower frequency maps (e.g., Reid et al. 1995) show diffuse emission to the northwest of the nucleus, suggesting it is possible that the jet continues to curve and fan out. of the FR I jet and near the FR II lobe, 5 counts in both cases; the local background in comparable-sized regions a similar distance from the core is 1.5 counts, so these are only marginal detections.
X-ray spectra were extracted from the nuclear region and from other areas of interest for both sources, and models were fit using XSPEC 12 (Arnaud 1996). After examining the spectra, we preferred to fit the ungrouped spectrum for 3C 433 (using the -statistic; Cash 1979) to model the low-count region below 2 keV better. Such considerations do not apply to 4C 65.15, so this spectrum was grouped to contain 15 counts per bin and fit using the statistic. All fits were conducted over the 0.3–8 keV energy band, and all models include fixed Galactic absorption.
3 3C 433
The nuclear X-ray spectrum of 3C 433 was extracted from a circular region with a radius of 5 pixels (2.5′′), centered on the peak flux. The spectrum (Figure 3a) shows the intrinsic X-ray absorption expected in a NLRG. A simple power-law model with intrinsic neutral absorption has best-fit parameters for the column density of cm-2 and for the photon index of = 1.27 but does not provide a satisfactory fit, as indicated by the large positive residuals below 2 keV and the high -statistic value (691 for 523 degrees of freedom; 99.97% of Monte Carlo simulations conducted using the XSPEC goodness command have lower -statistic values, indicating the fit is poor). The spectrum can be satisfactorily fit with a partial-covering model with a covering fraction of 0.993 ( cm-2, = 1.44, -statistic/d.o.f. = 596/522, 50.10% of simulations have lower -statistic values, indicating an acceptable fit). Table 1 lists parameters and errors for this and the following models. The excess soft emission can also be accommodated through an additional emission component, either a power-law () or thermal bremsstrahlung ( keV; note the upper limit for the temperature is poorly constrained); this unabsorbed component would contain 80 counts, primarily in the soft band. The total 0.5–8 keV model flux, dominated by the absorbed component, is erg cm-2 s-1. There is a 34 ks ASCA SIS spectrum obtained on 1997 May 28 (PI Yamashita) with a 0.5–8 keV model flux of erg cm-2 s-1, consistent with this Chandra observation.
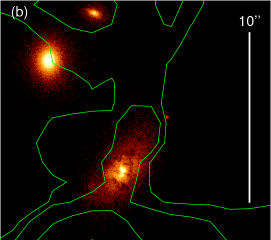
There is diffuse soft X-ray emission surrounding the nucleus and extending particularly toward the northeast and northwest (see Figure 1c) out to 5–6′′ (9–11 projected kpc). It appears most likely that this soft X-ray flux is associated with hot gas such as is often observed around FR II radio sources. The gas is not distributed in a symmetric halo, but non-spherical distributions have been found in Chandra observations of other radio galaxies (e.g., Kraft et al. 2005). The HST image (Figure 1b) shows a faint point source northwest of the host galaxy; were this the source of the X-rays to the northwest, the X-ray/optical flux ratio would be consistent with the object being a background AGN (Maccacaro et al. 1988), although an optical spectrum is necessary for conclusive classification. Despite the sparse counts the soft X-ray emission in this northwestern area appears extended, leading us to favor hot gas as the emission source. The best-fit temperature for a thermal bremsstrahlung model applied to the northwest diffuse X-ray emission is keV. The volume corresponding to the X-ray emission is difficult to measure accurately but may be approximated as a sphere with a radius of 2.5′′ (4.7 kpc). Neglecting line emission (which contributes significantly to the soft X-ray emission below 1 keV), a gas cloud with approximately solar abundances would be required to have a density of 0.06 cm-3 to account for the observed X-ray flux, corresponding to a total mass of 6.6108 M⊙ and an ideal-gas pressure of 1.510-10 dynes cm-2. The northeastern diffuse X-ray emission appears to occupy a slightly smaller volume, and could have similar density and pressure with about half the total mass as the gas to the northwest. The hot gas would be overpressured with respect to typical IGM temperatures and densities, suggesting either that we are observing it at a favorable time before it disperses (see also 5.2) or else there is a quasi-continuous source of heating, perhaps related to the northern jet.
We can utilize spatial analysis of the soft X-ray emission in the vicinity of the core to determine whether the low-energy X-ray spectrum originates primarily in the core or is dominated by the diffuse emission. A 0.3–1 keV image was constructed with the pipeline pixel randomization removed and with 0.1′′ pixel binning. Figure 3b shows a radial profile extracted from this image using circular annuli compared with a 1 keV PSF calculated with MARX.555MARX is a Chandra ray-trace simulator; see http://space.mit.edu/ASC/MARX/ The 0.3–1 keV emission within the spectral-extraction region contains contributions from both nuclear and diffuse emission; from the PSF normalization, 50% of the counts to 2.5′′ are from the core and 50% from the diffuse emission. For the double power-law model, 80% of the 0.3–1 keV counts are from the unabsorbed component (with similar results when the low-energy emission is modeled as thermal bremsstrahlung), with the absorbed component only contributing 20% of the counts over this energy range. This suggests 30% of the 0.3–1 keV counts originate in the core and are not associated with the absorbed spectral component; this may be soft X-ray emission from an unresolved small-scale jet. Separate consideration of the soft X-ray emission to the north and south of the nucleus indicates the soft emission does not skew strongly to the north, implying the C1 inner jet knot contributes only a small fraction of the soft emission within the spectral extraction region; however, the uncertainties with so few counts are large.
There are sufficient counts over the entire Chandra spectrum to resolve the core region on sub-arcsecond scales and to determine directly whether the inner jet knot C1 is detected in X-rays. We performed a maximum-likelihood reconstruction (cf. 2 of Townsley et al. 2006) on images from which the pipeline pixel randominzation had been removed and that were binned to 0.1′′ pixels. These spanned several different energy ranges, using appropriate PSFs calculated with MARX. The X-ray core is indeed extended toward the north, with emission in excess of that expected from a point source observed at approximately the same position angle and distance as C1 is relative to C2 (see Figures 4a and 4b). The C1-linked X-ray emission is most apparent in hard-band images and is therefore not directly related to the diffuse soft X-ray emission. The observed extension in the X-ray core is not an artifact of the mirror pair 6 misalignment (cf. 4.2.3 of The Chandra Proposers’ Observatory Guide), as it persists at energies below 4 keV. It is unlikely that the core, observed on-axis and consisting of 2800 counts, would be significantly distorted in one direction due solely to statistical noise; even were such to occur, it is further unlikely that the angle and position would randomly align so closely with C1. The 2–6 keV radial profile also shows a statistically significant excess of X-ray emission beyond that expected from a point source to the north of the X-ray core (Figure 4c). Adding an additional point source 0.6′′ from the core provides a much improved (but not exact) match to the overall profile. The normalization is 10% that of the core, suggesting that C1-linked X-ray emission contributes a few hundred counts to the overall X-ray spectrum. There is no indication that the hard X-ray component in the overall spectrum itself requires multiple power-laws for an acceptable fit, so the C1-linked X-ray spectrum appears to be broadly similar to that of the core.
No Fe K emission line is detected in the X-ray spectrum of 3C 433. The fit is not significantly improved by adding a Gaussian with fixed rest-frame energy 6.4 keV and fixed width 0.1 keV; the rest-frame upper limit to the equivalent width of any Fe K emission is 85 eV. Permitting the line energy to vary does not suggest any emission from ionized iron. Inspection of the spectrum reveals a marginal feature at rest-frame 8.2 keV (equivalent width 150 eV), but the model fit is not significantly improved after adding this component and in any event there is no obvious physical origin for such emission here. The lack of iron emission is somewhat atypical for X-ray spectra of heavily absorbed (FR II) radio galaxies, which often show Fe K line emission of eV equivalent width (e.g., Evans et al. 2006); perhaps the somewhat lower intrinsic absorption in 3C 433 results in emission from a narrow Fe K line being diluted below detectability.
The southern lobe of 3C 433 contains diffuse X-ray emission that is easily seen in the soft-band unsmoothed image and appears as a curving band along the east side of the southern lobe in the 0.5–2 keV smoothed image. There are 14 counts (1 errors) above background in the 0.3–8 keV band, with a 0.5–8 keV model flux of erg cm-2 s-1. Similarly sized regions extracted from east, south, and west of the lobe do not contain a statistically significant excess of counts above background. The extent of lobe emission above 2 keV is unclear; smoothed hard-band images suggest extended emission preferentially located southwest of the nucleus, but this cannot be confirmed in unsmoothed images.
4 4C 65.15
There are no bright inner radio-jet knots in 4C 65.15 and no indication that the X-ray nucleus of 4C 65.15 is extended. The nuclear X-ray spectrum was extracted from a circular region with a radius of 2.4′′; the X-ray jet emission is located outside this area. The initial model for 4C 65.15 consisted of an unabsorbed power-law. The best-fit photon index is and the fit is acceptable, with = 55.75 for 82 degrees of freedom. The 0.5–8 keV model flux is erg cm-2 s-1. There is a 6 ks ROSAT PSPC observation obtained on 1992 Nov 30 (PI Laor) with a count rate implying an extrapolated 0.5–8 keV flux of erg cm-2 s-1, consistent with this Chandra observation. The model was slightly improved by adding intrinsic absorption with a best-fit neutral column density of cm-2, with the photon index adjusting to . Note that the 90% confidence region for the column density is barely above zero. The /dof for this model is 52.75/81, a decrease with an -test probability of occuring by chance of 3.5%. This fit is shown in Figure 5. Some X-ray absorption is perhaps plausible in light of the associated narrow C IV absorption in 4C 65.15 and the general tendency for X-ray and UV absorption to be linked (e.g., Brandt et al. 2000; Gallagher et al. 2001).
Adding an Fe K emission line with a fixed rest-frame energy of 6.4 keV and a fixed width of 0.1 keV did not improve the fit, and the spectrum shows no noticeable excess emission at that energy (the rest-frame upper limit to the equivalent width is 101 eV). Permitting the energy of the line to vary gives a best-fit value of rest-frame 7.10 keV; fitting to the ungrouped spectrum (using the -statistic) also gives an energy of 7.06 keV for a 34 eV (rest-frame) equivalent width line, but the 90% confidence interval for the line normalization includes zero. We conclude there is no significant iron emission detected in this spectrum.
The X-ray emission in the FR I jet in 4C 65.15 contains sufficient photons for basic spectral modeling (31 counts in the 0.3–8 keV band) using the -statistic and permitting only one spectral-shape free parameter. A power-law model (plus fixed Galactic absorption) gives and a 0.5–8 keV model flux of erg cm-2 s-1. A thermal model is not a very good fit for reasonable temperatures (the best-fit is 200 keV) and is physically unlikely for jet-related X-ray emission.
There is apparent excess X-ray emission to the northeast of the core of 4C 65.15 located near the northern FR II radio lobe, but the paucity of counts above background (3.5 net counts over 0.5–8 keV) makes this only a marginal detection. X-ray emission from hotspots in FR II sources can often be successfully explained with synchrotron self-Compton models, although low-luminosity cases may be simple synchrotron. We can estimate the expected X-ray emission from the FR II lobe of 4C 65.15 using a radio-to-X-ray flux ratio typical for other FR II hotspots (cf. Table 3 from Hardcastle et al. 2004) and obtain a predicted 0.5–8 keV X-ray count rate of counts s-1, or counts in 35.8 ks. The lower end of this range is more representative of luminous hotspots, such as that of 4C 65.15, and is broadly consistent with the observed counts.
There is also apparent excess X-ray emission within the tail of the southwest jet (again 3.5 net counts over 0.5–8 keV, a marginal detection). It is not immediately clear whether such emission, if genuine, is associated with a terminal hotspot or an outer jet knot. In the context of a hotspot interpretation, the low radio flux of this feature suggests an expected 0.5–8 keV X-ray count rate of counts s-1, or counts in 35.8 ks (calculated as above). Here the higher end of this range is more representative for hotspots of lower luminosities, but even so this would be a somewhat X-ray bright hotspot. If instead the X-ray emission arises in a jet feature, the ratio of X-ray-to-radio flux is perhaps somewhat less than in the bend, plausibly decreasing along the jet such as is often observed. Deeper X-ray observations would be required to conduct more quantitative analysis.
5 Discussion
5.1 Jet emission
The inner jet in 3C 433 (C1) is detected in X-rays, but it is difficult to be quantitative about its characteristics due to its close proximity to the nucleus. The jet/core flux ratio for C1 of 10% is somewhat larger than for typical FR II quasar jet knots, which generally have values of 1–8% (e.g., Marshall et al. 2005). The radio-to-X-ray spectral slope of 0.8 is also flatter than the 0.9–1.0 that is typical for FR II quasar knots (e.g., Marshall et al. 2005). The inner knot C1 appears to be relatively X-ray luminous (note the comparisons do not take into account the distance of knots from the core). At the large inclinations indicated for this NLRG, the IC/CMB process should not contribute significantly to jet X-ray emission, and instead the X-ray jet emission may be synchrotron dominated. The data do not permit differentiation between simple synchrotron and multiple component models.
The X-ray spectrum of the inner jet appears to be dominated by hard-band emission, perhaps suggesting that C1 is absorbed ( cm-2) even at kpc distance from the core. The “torus” of absorbing material presumably responsible for obscuring the core typically is believed not to extend to such distances (e.g., Maiolino & Risaliti 2007). However, this location is well within the scale of the dust structures seen in the host galaxy, so C1 may happen to lie along a line of sight that passes through a dense dust cloud or lane; Figure 1b provides tentative support for this hypothesis. de Koff et al. (2000) estimate the mass of dust in 3C 433 as 105.7 M⊙ based on absorption maps and 108 M⊙ based on emission measured by IRAS, so there may be sufficient material to account for the inferred absorption if a clump covers the X-ray emitting region of the inner jet.
The nuclear soft X-ray emission might itself contain a contribution from an unresolved small-scale jet, as discussed in 3. Some support for this idea is provided by the agreement of the core radio/X-ray luminosity ratio with those of unabsorbed “jet-related” components in the FR IIs studied by Evans et al. (2006). The 3C 433 X-ray spectrum suggests that such nuclear jet-related emission is not strongly absorbed, contrasting with the C1 jet knot; indeed, strong absorption of the nuclear jet-related emission would render detection as a distinct spectral component difficult. Further, if the unabsorbed luminosity for this nuclear jet-related component were calculated from the observed nuclear soft-band flux but assuming the C1 column density, then the X-ray luminosity would exceed the expected FR II trend based on the radio core luminosity (although there are substantial uncertainties in the measurements as well as scatter in the correlation). Since the dust in the host galaxy of 3C 433 appears to be distributed in a patchy manner, the column densities associated with this dust may well vary on scales kpc.
The jet in 4C 65.15 has a clear detection in X-rays and radio flux measurements at several frequencies. The X-ray photon index of from the power-law model is consistent with the 1.1–1.7 found by Sambruna et al. (2004) for the brightest X-ray knots in their Chandra and HST survey of core-dominated FR II quasars with known radio jets. It does not match the X-ray spectra of prominent knots in FR I jets, which are generally significantly steeper with 2 (e.g., 3C 66B: Hardcastle et al. 2001; 3C 31: Hardcastle et al. 2002; M 87: Marshall et al. 2002; Cen A: Hardcastle et al. 2003; B2 0755+37: Parma et al. 2003). The spectral energy distribution of the X-ray emitting jet region is plotted in Figure 6. The radio points are summed over the resolved features at the jet bend. The radio-to-X-ray spectral slope is = 0.96; unfortunately the SDSS upper limit does not impose useful constraints upon or . The high-frequency radio spectral slope is steeper; between 5 and 15 GHz, = 1.08. Consequently, the high-frequency radio spectral slope predicts synchrotron X-ray emission (for simple models, assuming the population of electrons extends to sufficiently high energies) with a flux lower than the X-ray jet emission that is actually detected. Moreover, the measured X-ray spectral index is much flatter than ; the 90% confidence upper limit from spectral fitting for is 0.6. It appears most likely that the jet X-ray emission is not an extension of the synchrotron component responsible for the radio emission, although deeper optical observations would be helpful for better understanding the shape of the jet SED.
The X-ray and radio surface-brightness profiles within the 4C 65.15 jet bend do not appear to align; Figure 2 suggests the X-ray emission peaks slightly upstream of the maximum radio brightness. (The paucity of counts as well as the limited angular size of the region of interest in the jet bend restrict the usefulness of more detailed spatial analysis.) Such an offset would make it less likely that the IC/CMB process dominates the jet X-ray emission, since the low-energy electrons involved should not congregate upstream of the peak radio synchrotron emission. This conclusion might be reached independently through consideration of the lobe-dominated nature of 4C 65.15, which constrains the inclination and hence limits the efficiency of IC/CMB emission. A model involving a second high-energy population of X-ray synchrotron emitting electrons could accommodate both any offset and a concave jet SED. The high radio luminosity, broad-line quasar classification, and apparently concave jet SED of 4C 65.15 are similar to the properties of typical FR II quasars, suggesting that the distorted southern radio structure in 4C 65.15 reflects an external influence, most likely a dense surrounding environment disrupting the outer jet.
5.2 Environment
3C 433 appears to reside in a group environment. Zirbel (1997) found a background-corrected group richness of 12.64.4 for 3C 433; the mean richness among low redshift FR IIs in that study was 5.8 (scatter 5.6), and 76% had a richness of 10. There is a close companion projected kpc to the northeast; although the redshift of this nearby galaxy is unknown, its angular size is consistent with being at the same distance as 3C 433. There is another galaxy projected kpc to the north and an additional galaxy projected kpc to the southwest, as well as an optical point source northwest of the optical nucleus of 3C 433 whose nature is unclear. There is evidence that 3C 433 is either experiencing tidal forces driving star formation or else has undergone a recent minor merger: Wills et al. (2002) identify a young stellar population in 3C 433 from UV/optical spectral analysis, and the dust structure suggests 3C 433 has been disturbed (de Koff et al. 2000) in some manner. Such activity could plausibly generate asymmetries in the surrounding intergalactic medium.
The SDSS image of 4C 65.15 shows a handful of nearby optical sources, but they are too faint to have SDSS spectral coverage and so their redshifts are uncertain. There is no overdensity of nearby sources (with 23) in the vicinity of 4C 65.15 on scales of 90′′, 60′′, or 30′′, nor are there more galaxies (resolved sources: type=3) near 4C 65.15 on these same scales.
Both 3C 433 and 4C 65.15 display bends in the jet on the FR I side of the nucleus. While bends in radio jets are not uncommon, the change in direction is particularly abrupt () for both 3C 433 and 4C 65.15. 3C 433 likely lies with its jet axis nearly in the plane of the sky, as indicated by its large lobe-to-core flux ratio and NLRG status, and so the observed bend should closely correspond to the physical change in direction. The bend in 4C 65.15 may be exaggerated due to an orientation closer to the line of sight. Judging from the core-to-lobe flux ratio and from the core radio-to-optical luminosity ratio (e.g., Wills & Brotherton 1995), 4C 65.15 is inclined at to the line of sight; this is the lower limit for the deprojected bending angle (e.g., see 3 of Jorstad & Marscher 2004). The jet structure in 3C 433 and 4C 65.15 is suggestive of an environmental interaction redirecting the jet, consistent with a dense clumpy medium on the FR I side such as might also produce the hybrid structure through decelerating the jet closer to the core. An interesting possibility for producing X-ray emission at the site of an abrupt jet bend (such as is observed in 4C 65.15) is suggested by Worrall & Birkinshaw (2005) for 3C 346: interaction between the jet and a wake created by a companion galaxy moving through the intergalactic medium generates an oblique shock, redirecting the jet and powering X-ray synchrotron emission. It is perhaps noteworthy that 3C 433 has been included in lists of “X-shaped” radio sources; while there have been suggestions that such morphologies arise from the merger of supermassive black holes (e.g., Merritt & Ekers 2002), it has been convincingly argued (e.g., Worrall et al. 1995; Kraft et al. 2005; Cheung 2007) that hydrodynamic backflows from the jet within an asymmetric medium can naturally produce “X-shaped” structure.
5.3 Comparison to other radio sources
There is a correlation between core radio and X-ray luminosity for FR I sources, presumably reflecting jet dominance of the nuclear emission from radio through X-ray frequencies. FR II sources tend to have higher (unabsorbed) X-ray luminosities at a given core radio luminosity, perhaps because their X-ray emission includes a contribution from Compton upscattering of disk photons in a hot corona (e.g., Evans et al. 2006). Both 3C 433 and 4C 65.15 have nuclear (unabsorbed) X-ray luminosities that lie above the FR I correlation, consistent with other FR II sources (Figure 7). The nuclear X-ray spectra are also FR II in nature (intrinsic absorption for the NLRG 3C 433, a power law for the RLQ 4C 65.15), and the jet SED of 4C 65.15 is consistent with those of other FR II quasar jets. We conclude that the hybrid sources 3C 433 and 4C 65.15 should be regarded as FR II objects in which a particularly dense environment has induced FR I-like jet structure.
There are only a handful of known hybrid morphology sources possessing high-resolution X-ray data. Gopal-Krishna & Wiita (2000) list six HYMORS, from which three (PKS 0521365, PG 1004+130, and S5 2007+777) have Chandra coverage. Birkinshaw et al. (2002) detected X-ray emission from the FR I jet of the BL Lac PKS 0521365 which could be satisfactorily interpreted with a synchrotron model, and also detected the FR II hotspot in X-rays with a flux similar to that expected from previous observations of hotspots in FR IIs. Miller et al. (2006) found an X-ray counterpart slightly upstream of the radio FR I jet in the broad absorption line RLQ PG 1004+130, with a flat photon index and a concave SED more typical of FR II quasar jets than FR I jets. Sambruna et al. (2008) presented Chandra observations of the BL Lac S5 2007+777; the FR I jet is detected in X-rays and displays properties similar to those of other FR II quasar jets. Another possible hybrid source with Chandra coverage is the BLRG 3C 17, which displays an edge-brightened northern lobe and a curving jet to the southeast that features a bright inner knot, an abrupt bend, and then an expanding tail (Morganti et al. 1999). Two X-ray emitting features in the jet were discovered by Massaro et al. (2008). X-ray emission in the inner knot is consistent with a single-component synchrotron spectrum, although an IC/CMB interpretation is also possible. The outer X-ray knot, located at the bend, appears to have a hard X-ray spectrum, and a synchrotron model following the suggested UV cutoff predicts lower X-ray flux than is observed, indicating the SED is likely concave. Both PG 1004+130 and 3C 17 would be classified as FR II sources based on their radio luminosities and optical broad line emission, and their jet SEDs match more closely to FR II quasar jets than to typical FR I sources. The radio/optical properties of the BL Lac objects PKS 0521365 and S5 2007+777 are intermediate between FR I and FR II, and for these sources the prominence of the FR I jet may reflect their low inclination to the line of sight.
6 Conclusions
Chandra observations of the hybrid morphology radio sources 3C 433 and 4C 65.15 reveal that they have X-ray properties consistent with those of comparable FR II sources, supporting the hypothesis that the apparent FR I structure in the jet arises from environmental interactions. In particular, we find that:
1. The narrow-line radio galaxy 3C 433 displays nuclear X-ray absorption with a column density of cm-2, similar to other NLRGs and in agreement with predictions for high-inclination FR II sources from some unification models. The broad-line radio-loud quasar 4C 65.15 shows at most mild intrinsic absorption, similar to other RLQs and in agreement with predictions for intermediate-inclination FR II sources from some unification models.
2. The unabsorbed nuclear X-ray luminosities for both 3C 433 and 4C 65.15 lie along the track populated by FR II sources when plotted against core radio luminosity and do not fall along the radio/X-ray luminosity correlation followed by FR Is (Evans et al. 2006).
3. The knot/core and X-ray/radio luminosity ratio of the inner jet in 3C 433 (the C1 component) are rather high, but the close proximity to the core makes it difficult to assess the full SED. The X-ray jet in the RLQ 4C 65.15 has a flat photon index () that is flatter than the radio-to-X-ray spectral slope, suggesting the SED is concave. Flat X-ray spectral slopes and concave SEDs are characteristic of FR II quasar jets and distinguish them from FR I jets.
Chandra observations of additional hybrid morphology objects would be useful in clarifying whether most such sources can be characterized as intrinsically FR IIs with a one-sided FR I jet structure generated through environmental interactions. If so, it might be expected that FR IIs residing within a particularly dense but symmetric environment could display FR I-like jet structure on both sides of the core. Perhaps the few known broad-line FR Is such as 2114+820 (Lara et al. 1999) are such objects; 2114+820 has radio-core/X-ray luminosity properties consistent with FR II sources (Figure 7). Deep radio observations sensitive to extended emission are necessary to detect FR I jets beyond the local universe; Heywood et al. (2007) carried out a VLA survey of 18 radio-luminous broad-line quasars with extended structure and moderate redshifts ( = 0.36–2.5) and discovered that 4–6 (22–33%) showed apparent FR I morphologies. There should also be varying degrees of hybridization if this interpretation is correct. 3C 433 itself could be considered somewhat of an intermediate case between a source with two-sided FR I structure and one with an FR I jet opposing an FR II lobe, since its extended and complex southern lobe is suggestive of jet disruption prior to the outer hotspot.
It would also be interesting to examine hybrid morphology radio-loud quasars known to be inclined with the FR I side pointed toward the observer. Such objects should be intrinsically unabsorbed, so if the density of the hypothesized “frustrating” medium matches that suggested as necessary for jet confinement or disruption (e.g., De Young 1993; Carvalho 1998) it might be directly detectable as absorption against the bright nucleus.
| 3C 433 model | (1022 cm-2) | Comments | cstat/d.o.f. | |
| Single-component power-law | ||||
| with partial-covering absorption | 1.44 | 8.64 | 596/522 | |
| Absorbed power-law | ||||
| with unabsorbed power-law | 1.39 | 8.25 | 594/521 | |
| Absorbed power-law | ||||
| with unabsorbed thermal | 1.41 | 8.26 | 594/521 | |
| 4C 65.15 model | (1021 cm-2) | Comments | /d.o.f. | |
| Unabsorbed power-law | 1.89 | 56/82 | ||
| Absorbed power-law | 1.97 | 1.31 | -test p=0.035 | 53/81 |
References
- Arnaud (1996) Arnaud, K. A. 1996, ASP Conf. Ser. 101: Astronomical Data Analysis Software and Systems V, ed. G. H. Jacoby & J. Barnes (San Francisco: ASP), 17
- Atoyan & Dermer (2004) Atoyan, A., & Dermer, C. D. 2004, ApJ, 613, 151
- Auger et al. (2008) Auger, M. W., Becker, R. H., & Fassnacht, C. D. 2008, AJ, 135, 1311
- Bassett et al. (2004) Bassett, L. C., Brandt, W. N., Schneider, D. P., Vignali, C., Chartas, G., & Garmire, G. P. 2004, AJ, 128, 523
- Belsole et al. (2006) Belsole, E., Worrall, D. M., & Hardcastle, M. J. 2006, MNRAS, 366, 339
- Birkinshaw et al. (2002) Birkinshaw, M., Worrall, D. M., & Hardcastle, M. J. 2002, MNRAS, 335, 142
- Black et al. (1992) Black, A. R. S., Baum, S. A., Leahy, J. P., Perley, R. A., Riley, J. M., & Scheuer, P. A. G. 1992, MNRAS, 256, 186
- Brandt et al. (2000) Brandt, W. N., Laor, A., & Wills, B. J. 2000, ApJ, 528, 637
- Carvalho (1998) Carvalho, J. C. 1998, A&A, 329, 845
- Cash (1979) Cash, W. 1979, ApJ, 228, 939
- Cheung (2007) Cheung, C. C. 2007, AJ, 133, 2097
- Chiaberge et al. (2000) Chiaberge, M., Capetti, A., & Celotti, A. 2000, A&A, 355, 873
- de Koff et al. (1996) de Koff, S., Baum, S. A., Sparks, W. B., Biretta, J., Golombek, D., Macchetto, F., McCarthy, P., & Miley, G. K. 1996, ApJS, 107, 621
- de Koff et al. (2000) de Koff, S., et al. 2000, ApJS, 129, 33
- De Young (1993) De Young, D. S. 1993, ApJ, 402, 95
- Evans et al. (2006) Evans, D. A., Worrall, D. M., Hardcastle, M. J., Kraft, R. P., & Birkinshaw, M. 2006, ApJ, 642, 96
- Fanaroff & Riley (1974) Fanaroff, B. L., & Riley, J. M. 1974, MNRAS, 167, 31P
- Gallagher et al. (2001) Gallagher, S. C., Brandt, W. N., Laor, A., Elvis, M., Mathur, S., Wills, B. J., & Iyomoto, N. 2001, ApJ, 546, 795
- Gawroński et al. (2006) Gawroński, M. P., Marecki, A., Kunert-Bajraszewska, M., & Kus, A. J. 2006, A&A, 447, 63
- Gopal-Krishna & Wiita (2000) Gopal-Krishna, & Wiita, P. J. 2000, A&A, 363, 507
- Hardcastle et al. (2001) Hardcastle, M. J., Birkinshaw, M., & Worrall, D. M. 2001, MNRAS, 326, 1499
- Hardcastle et al. (2002) Hardcastle, M. J., Worrall, D. M., Birkinshaw, M., Laing, R. A., & Bridle, A. H. 2002, MNRAS, 334, 182
- Hardcastle et al. (2003) Hardcastle, M. J., Worrall, D. M., Kraft, R. P., Forman, W. R., Jones, C., & Murray, S. S. 2003, ApJ, 593, 169
- Hardcastle et al. (2004) Hardcastle, M. J., Harris, D. E., Worrall, D. M., & Birkinshaw, M. 2004, ApJ, 612, 729
- Hardcastle (2006) Hardcastle, M. J. 2006, MNRAS, 134
- Jorstad & Marscher (2004) Jorstad, S. G., & Marscher, A. P. 2004, ApJ, 614, 615
- Kraft et al. (2005) Kraft, R. P., Hardcastle, M. J., Worrall, D. M., & Murray, S. S. 2005, ApJ, 622, 149
- Lara et al. (1999) Lara, L., Márquez, I., Cotton, W. D., Feretti, L., Giovannini, G., Marcaide, J. M., & Venturi, T. 1999, New Astronomy Review, 43, 643
- Lonsdale et al. (1993) Lonsdale, C. J., Barthel, P. D., & Miley, G. K. 1993, ApJS, 87, 63
- Lopez et al. (2006) Lopez, L. A., Brandt, W. N., Vignali, C., Schneider, D. P., Chartas, G., Garmire, G. P. 2006, AJ, 131, 1914
- Maccacaro et al. (1988) Maccacaro, T., Gioia, I. M., Wolter, A., Zamorani, G., & Stocke, J. T. 1988, ApJ, 326, 680
- Maiolino & Risaliti (2007) Maiolino, R., & Risaliti, G. 2007, The Central Engine of Active Galactic Nuclei, 373, 447
- Marshall et al. (2002) Marshall, H. L., Miller, B. P., Davis, D. S., Perlman, E. S., Wise, M., Canizares, C. R., & Harris, D. E. 2002, ApJ, 564, 683
- Marshall et al. (2005) Marshall, H. L., et al. 2005, ApJS, 156, 13
- Massaro et al. (2008) Massaro, F., et al. 2008, submitted
- Merritt & Ekers (2002) Merritt, D., & Ekers, R. D. 2002, Science, 297, 1310
- Miller et al. (2006) Miller, B. P., Brandt, W. N., Gallagher, S. C., Laor, A., Wills, B. J., Garmire, G. P., & Schneider, D. P. 2006, ApJ, 652, 163
- Mirabel (1989) Mirabel, I. F. 1989, ApJ, 340, L13
- Morganti et al. (1999) Morganti, R., Oosterloo, T., Tadhunter, C. N., Aiudi, R., Jones, P., & Villar-Martin, M. 1999, A&AS, 140, 355
- Morganti et al. (2003) Morganti, R., Oosterloo, T., Tadhunter, C., & Emonts, B. 2003, New Astronomy Review, 47, 273
- Müller et al. (2004) Müller, S. A. H., Haas, M., Siebenmorgen, R., Klaas, U., Meisenheimer, K., Chini, R., & Albrecht, M. 2004, A&A, 426, L29
- Owen & Ledlow (1994) Owen, F. N., & Ledlow, M. J. 1994, The Physics of Active Galaxies, 54, 319
- Parma et al. (2003) Parma, P., de Ruiter, H. R., Capetti, A., Fanti, R., Morganti, R., Bondi, M., Laing, R. A., & Canvin, J. R. 2003, A&A, 397, 127
- Reid et al. (1995) Reid, A., Shone, D. L., Akujor, C. E., Browne, I. W. A., Murphy, D. W., Pedelty, J., Rudnick, L., & Walsh, D. 1995, A&AS, 110, 213
- Sambruna et al. (2004) Sambruna, R. M., Gambill, J. K., Maraschi, L., Tavecchio, F., Cerutti, R., Cheung, C. C., Urry, C. M., & Chartas, G. 2004, ApJ, 608, 698
- Sambruna et al. (2008) Sambruna, R. M., Donato, D., Cheung, C. C., Tavecchio, F., & Maraschi, L. 2008, ApJ, 684, 862
- Schwartz (2002) Schwartz, D. A. 2002, ApJ, 569, L23
- Tavecchio et al. (2000) Tavecchio, F., Maraschi, L., Sambruna, R. M., & Urry, C. M. 2000, ApJ, 544, L23
- Townsley et al. (2006) Townsley, L. K., Broos, P. S., Feigelson, E. D., Garmire, G. P., & Getman, K. V. 2006, AJ, 131, 2164
- Urry & Padovani (1995) Urry, C. M., & Padovani, P. 1995, PASP, 107, 803
- van Breugel et al. (1983) van Breugel, W., Helfand, D., Balick, B., Heckman, T., & Miley, G. 1983, AJ, 88, 40
- Varano et al. (2004) Varano, S., Chiaberge, M., Macchetto, F. D., & Capetti, A. 2004, A&A, 428, 401
- Vestergaard (2003) Vestergaard, M. 2003, ApJ, 599, 116
- Wills & Brotherton (1995) Wills, B. J., & Brotherton, M. S. 1995, ApJ, 448, L81
- Wills et al. (2002) Wills, K. A., Tadhunter, C. N., Robinson, T. G., & Morganti, R. 2002, MNRAS, 333, 211
- Worrall et al. (1995) Worrall, D. M., Birkinshaw, M., & Cameron, R. A. 1995, ApJ, 449, 93
- Worrall & Birkinshaw (2005) Worrall, D. M., & Birkinshaw, M. 2005, MNRAS, 360, 926
- Worrall & Birkinshaw (2006) Worrall, D. M., & Birkinshaw, M. 2006, in ‘Physics of Active Galactic Nuclei at all Scales’, ed. D. Alloin, R. Johnson, P. Lira (Springer Verlag)
- York et al. (2000) York, D. G., et al. 2000, AJ, 120, 1579
- Yuan et al. (2006) Yuan, W., Fabian, A. C., Worsley, M. A., & McMahon, R. G. 2006, MNRAS, 368, 985
- Zirbel (1997) Zirbel, E. L. 1997, ApJ, 476, 489