11email: lionel.prat@cea.fr 22institutetext: AIM-UMR 7158, Paris, France 33institutetext: ESAC, ISOC, Villañueva de la Cañada, Madrid, Spain 44institutetext: Dr. Karl Remeis-Observatory, Bamberg, Germany 55institutetext: Erlangen Centre for Astroparticle Physics, Germany 66institutetext: Space Sciences Laboratory, University of California, Berkeley, USA 77institutetext: APC-UMR 7164, Paris, France
The early phase of a H1743322 outburst observed by INTEGRAL, RXTE, Swift, and XMM/Newton
Abstract
Aims. We investigate the early phase of the first state change during the 2008 September-November outburst of H1743-322, first detected by the INTEGRAL satellite. We focus on the preliminary hard X-ray state with the aim of investigating the possible influence of this phase on the subsequent evolution during the outburst.
Methods. The outburst started on MJD 54732, and remains ongoing at the time of writing this paper (MJD 54770). We analyse INTEGRAL, RXTE, Swift, and XMM/Newton observations, which provide coverage of the quiescence to outburst evolution in the 3–200 keV range every few days. We present both the spectral and timing analysis. We compare these parameters with the behaviour of the source during a previous outburst in 2003, which was observed by INTEGRAL and RXTE.
Results. The energy spectra are well fitted by a phenomenological model consisting of an exponentially cut-off power law plus a disc component. A more physical model of thermal Comptonisation (and a disc) represents the spectra equally well. In a first phase (up to MJD 54760), the photon index and temperature of the disc do not vary significantly, and have values reminiscent of the Hard State (HS). The timing analysis is also consistent with that of a HS, and shows in particular a rather high degree of variability (30%), and a strong 0.5–1 Hz QPO with its first harmonic. After MJD 54760, a change to softer spectra and a 5–6 Hz QPO indicate that the source underwent a state transition into a Hard-Intermediate State (HIMS).
Conclusions. The timing and spectral characteristics of H1743322 are similar to those of the first HS during its 2003 outburst. We observe a correlation between the QPO frequency and the photon index, which indicates a strong link between the accretion disc, generally understood to determine the QPO frequency, and the corona, which determines the QPO power. The gradual disappearance of the QPO harmonic, and the slowly decreasing hard X-ray flux, imply that the accretion disc slowly moved inwards during the HS.
Key Words.:
X-rays: individuals: H1743322, IGR J174643213 – X-rays: binaries – gamma-rays: observations1 Introduction
The X-ray nova H1743322 was discovered during a bright outburst that occurred in 1977 with the Ariel V and HEAO I satellites by Kaluzienski & Holt (1977). In 2003, another bright outburst was first detected with INTEGRAL, and the source was then dubbed IGR J174643213, before it was realised that it was H1743322 (Markwardt & Swank 2003). This outburst has been studied considerably at all wavelengths (see e.g. Parmar et al. 2003; Lutovinov et al. 2005; Kalemci et al. 2006). It was shown in particular that H1743322 had a behaviour consistent with most black-hole X-ray transients, and was, thus, classified as a Black-Hole Candidate. This 2003 outburst was followed by weaker episodes in 2004, 2005, and in the first months of 2008 (see Kalemci et al. 2008).
A new outburst was detected on 2008 September 23 (Kuulkers et al. 2008), during INTEGRAL observations of the Galactic Bulge (GB). The source brightened above the detection limit in the middle of the INTEGRAL observation, and thus provided us with the rare privilege of observing an X-ray nova during the very first stages of an outburst, from the quiescent state to the rising phase. Due to this early notice, several high energy satellites were able to follow rapidly H1743322: INTEGRAL and RXTE observations occurred almost every second day, while at softer X-rays, Swift (XRT) and XMM/Newton provided 3 and 1 observations, respectively.
Herein, we present the results of the X and –ray coverage of the source in its Hard State (HS) until its transition to the Hard Intermediate State (HIMS, see e.g. Homan & Belloni 2005), which is characterized by a photon index between 1.5-2.5, and the presence of strong type C Quasi Periodic Oscillations (QPOs). Our study is focused on the very first stages of its evolution from quiescence to outburst. We analyse the spectral and timing characteristics of H1743322, and compare its behaviour with that of the well-studied 2003 outbust. The outburst remains ongoing while this letter is being written, and the study of the complete outburst is deferred to a future investigation.
2 Observations and data reduction
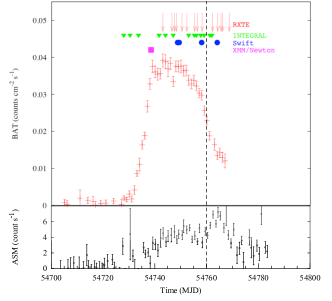
The INTEGRAL observations analysed here originate in two different programmes. The Galactic Bulge (GB) programme (Kuulkers et al. 2007) is performed once every INTEGRAL revolution whenever the region is visible, and consists of 12.6 ks exposure observations. The Galactic Centre (GC) programme provides longer exposures, of duration typically between 40 and 200 ks, every 2 revolutions, as part of the “Key Projects” strategy of INTEGRAL. The black-hole candidates within the field of view are monitored by our team (PI Prat, see Prat et al. 2008a), by taking advantage of the long exposure time to achieve early detections of new outbursts and monitor their evolution. The XMM/Newton observation originate in a private programme (PI Wilms, Hanke et al. 2008), while the data from RXTE and Swift are public. The times of all observations are indicated on Fig. 1.
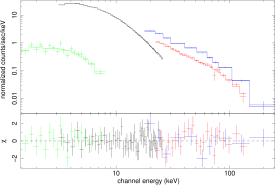
The INTEGRAL data were reduced using the standard Off-line Scientific Analysis (OSA) v7.0 software package (Goldwurm et al. 2003). We used standard response files to obtain spectra of the source in the 18-200 keV range, with 11 spectral bins (see Fig. 2 for a sample spectrum). A systematic error of 2% was applied to all bins. The activation of H1743322 was monitored for 170 ks without interruption by INTEGRAL, and we therefore took special care in analysing the very first data available. Since H1743322 was too faint to be detected in single science window pointings, we used a “sliding” technique: we accumulated images of 30 ks exposure time, every 6 ks. This enables a more detailed study of its evolution, especially when considering the 20–200 keV flux (Fig. 3, panel a). In the 3–20 keV range, JEM-X data were included in our analysis only after MJD 54749, when the source was sufficiently bright for spectral extraction to be possible in the data.
The RXTE and Swift/XRT data were reduced with the HEASOFT v6.5 software package following the standard steps explained in the RXTE cookbook111available at http://heasarc.gsfc.nasa.gov/docs/xte/data_analysis.html and XRT users manual222http://heasarc.gsfc.nasa.gov/docs/swift/analysis/. High time resolution light curves were extracted from the PCA (all layers, all active PCUs) EVENT data with 500 s resolution, after removing the artificial time marker with sefilter. We restricted the energy range to 3–40 keV (Channels 5–91). We produced power-density spectra (PDS) with powspec v1.0 in the frequency range 0.0156–1024 Hz. The PCA spectra were extracted in the 3–25 keV range from the top layer of PCU 2, from STANDARD 2 data, while background spectra were estimated from the PCA background model for bright sources. Systematic errors at a level of 0.8% were added to all channels. The HEXTE spectra were extracted from Cluster B only.
For XRT data, we produced level 2 data with the xrtpipeline v0.12.0, which removed calibration source, bad pixels and grade selection. We analyse only observations completed in photon-counting mode. We extracted images, light curves, and spectra from these cleaned event files with xselect v2.4. However, even during the first observation the source was bright and its light was lightly to cause saturation; we therefore extracted source and background spectra from annuli centred on the most accurately determined position of H1743322. We generated exposure maps with xrtexpomap v0.2.5, and ancillary response files with the tool xrtmkarf v0.5.6. The resultant spectra were rebinned so as to have at least 20 counts per channel, allowing the chi-squared statistics to be evaluated using xspec v11.3.2ag. The spectra were fitted between 0.5 keV and 10 keV.
The XMM/Newton data were reduced with the Science Analysis Software, xmmsas, v. 7.1, following standard procedures. We used successively the tasks epchain, rgsproc, evselect, rmfgen, and arfgen to produce spectra and response matrices. We restricted the data from the EPIC-pn (timing mode) to the 1–10 keV range. The first and second order spectra from RGS 1 and 2 were rebinned to contain counts per bin.

3 Results
3.1 Spectral analysis and results
Apart from the first stages of the outburst, when the flux increased quickly, the source did not evolve significantly during any single day. Therefore, we combined the data from the various satellites when the observations were separated by less than one day, to be able to extend the energy range and constrain the spectral parameters more accurately.
The high-energy ends of the spectra are well fitted using a simple power-law, with a high-energy cutoff located typically in the 15–25 keV range, with relative error bars of 20%. The 1–20 keV range shows a disc blackbody component and a Gaussian Fe K emission line. As a cut-off power law is usually interpreted as a signature of thermal Comptonization, we replaced this simpler model with a more physical Comptonization model (COMPTT, Titarchuk 1994), and obtained equally good fits. The plasma temperatures that we obtained are similar to those corresponding to the cutoff energies measured using the phenomenological model, with slightly smaller error bars. Hereafter, the photon indices were thus deduced from the phenomenological model, while the other spectral parameters were calculated using the more physical constant*wabs*(comptt+diskbb+gaussian) model (in XSPEC terminology). The absorption is not well constrained by the RXTE/PCA observations and, when leaving this parameter free, we were unable to determine the temperature of the disc. Therefore, we assumed the value calculated using the Swift and XMM/Newton observations, cm-2, and fixed the parameter to this value in every observation.
The spectral evolution of H1743322 is reported in Fig. 3 (panels a to e). The sizes of the error bars depend on the availability of the various satellites.
During the first days of the outburst, around MJD 57433, the source exhibited a rapid rise in hard X-ray flux: the flux increased by a factor 2.3 in less than 1.5 days (Fig. 3, panel a). At the same time, the photon index remained remarkably stable, around 1.65 (panel c). Then, between MJD 54741.5 and MJD 54760, the 20–200 keV flux reached a maximum and slowly decayed, while the photon index stayed at low values, in the range 1.2–1.6. The times when RXTE or Swift satellites are available correspond to indices lower by 0.3 compared with the INTEGRAL data alone. This is due to the fact that the two former satellites provide coverage in softer energy bands: since the coverage of ISGRI starts around 18 keV, it cannot accurately constrain the high-energy cutoff around 20 keV. Instead, the presence of this cutoff appears to cause the photon index to be softer, because the fitting process tends to mix the beginning of the high energy rollover with the end of the pure power-law part.
The Comptonized component can be characterised by the Kompaneets parameter (Rybicki & Lightman 1986), , where is the plasma temperature, and its optical depth (panel d). This parameter did not evolve significantly before MJD 54759, and then decreased significantly within two days. At the same time, the 20–200 keV flux decreased by 45%, and a softening of the spectra occurred.
3.2 Timing
The RXTE PDS exhibit a shape reminiscent of many other BHs during the first phases of their outbursts. They show a flat top component until a break frequency, above which the decrease in power versus frequency is almost power law like. This is also similar to the PDS of GRS 1915+105 during the so-called class of variability (Rodriguez et al. 2008). We therefore modelled the PDS of H1743322 using the same kind of model: one or two zero-centred Lorentzians, plus narrower ones to account for the presence of QPOs. Due to limited quality of our data, above 20 Hz the PDS are consistent with white noise. We therefore restricted the fits to the range 0.0156–20 Hz. In all PDS extracted before MJD 54760, a strong type C QPO with its harmonic is visible, as reported by Yamaoka et al. (2008). The evolution in the QPO parameters (in terms of frequency and RMS amplitude) is reported in Fig. 3 (panels g and h).
The RMS of the continuum remained about 30% during the HS (Fig. 3, panel f). The RMS fraction of the lower frequency QPO remained stable of around 15%. The RMS fraction of the first harmonic QPO decreased during the first 3 RXTE observations, and was insufficiently strong to be measurable afterwards.

4 Discussion
The spectral and temporal parameters of H1743-322 from MJD 54732 to 54759 indicated that the source was in a HS typical of a Black-Hole Binary (Prat et al. 2008a). This was further supported by the observation of radio emission with a flat or slightly inverted spectrum (Corbel et al. 2008). We note that the source was observed to be in this state from the very beginning of the outburst. After MJD 54761, the sharp decline in the RMS variability and the sudden increase in the QPO frequency within the timing domain, observed to occur simultaneously with a sudden increase in photon index and decrease in hard X-ray flux, indicate that the source had changed its state. We identify the new state as a HIMS (Belloni et al. 2008; Prat et al. 2008b).
When comparing this behaviour with that of the beginning of the 2003 outburst, we can see that H1743322 emulated in an approximate way its past behaviour. H1743322 remained within a HS for 12 days only, compared with 28 days for the current outburst. The total fluxes were comparable: it was then in the range 2.5–3 10-9 erg cm-2 s-1 in the 20–100 keV band (McClintock et al. 2007), compared with 0.5–3.3 10-9 erg cm-2 s-1. The total RMS powers were in the same range, i.e. 25% in 2003, compared with 30%. The RMS power and photon index are also similar to those exhibited during the 2003 outburst decay, when the source re-entered the HS (Kalemci et al. 2006). We detect two QPOs, of frequencies 0.3 and 1 Hz, and RMS amplitudes of 5 and 10% respectively. During the beginning of the 2003 outburst, a QPO was detected around 0.1 Hz, along with its first harmonic, of 3–14% RMS amplitude.
The main differences reside in the photon indices, which were lower during the 2008 outburst, and the duration of the HS, which was shorter during the 2003 outburst, although it is unclear whether these differences are related.
The evolution in the different parameters follows two distinct paths. The overall evolution is characterised by a slowly decreasing hard X-ray flux and a slowly increasing QPO frequency. At the same time, more rapid changes occur: we detect a rapid increase in the flux at the onset of the outburst, and a rapid softening of the spectra precisely as a drastic increase in the QPO frequency takes place at the state transition. These two distinct behaviours are reminiscent of the interpretation of Smith et al. (2002), which involved two different media: one medium that evolves with a long viscous timescale (the accretion disc), and one that evolves more rapidly (a corona and/or a jet). We can indeed interpret the slowly decreasing hard X-ray flux as being a consequence of the disc evolution: the disc slowly moves in and, as it does, gradually cools the corona. The properties of the QPOs are also comparable to that seen for other BHs in outburst. In particular, the frequency increases with the photon index (Fig. 4, Vignarca et al. 2003). The fact that the energy spectra are dominated by the Comptonized component indicates that, although the disc properties probably determine the frequency, the observed QPO power is probably generated in the corona.
The slow increase in the QPO frequency is of particular interest. If we consider a model of an instability propagating inside the disc, the increase in frequency can be interpreted as a movement of the inner part of the disc. In such a model, the frequency is somehow related to the Keplerian rotation frequency, such if the inner part of the disc moves in, the rotation frequency increases, and thus so does the QPO frequency. After the transition to the HIMS, when the QPO frequency increases dramatically, this would indicate that the disk had moved further inwards. Unfortunately, H1743322 was not bright enough to enable the inner radius of the accretion disc to be determined precisely using the multicolor disc blackbody model.
We had the rare privilege to observe a poorly studied early phase of a BH outburst. Our analysis shows that the outburst started in a hard state, initiated by a rapid increase in the flux with a roughly constant spectral shape. The parameters of these early phases could provide important constraint on the subsequent evolution of the outburst. For example, the quite hard spectra seen here could be linked to the length of the HS interval. In the future, more sensitive hard X-ray instruments, such as SIMBOL-X, should allow us to study even fainter and thus earlier phases.
Acknowledgements.
The authors warmly thank the INTEGRAL planners for having scheduled numerous and regular observations quickly after the beginning of the outburst. We thank P. Varnière for useful discussions on the evolution of the QPOs. MH and JW acknowledge funding from the Bundesministerium für Wirtschaft und Technologie through Deutsches Zentrum für Luft- und Raumfahrt grant 50OR0701. This research has made use of data obtained through the High Energy Astrophysics Science Archive Research Center and quick-look results provided by the RXTE/ASM and Swift/BAT teams. Based on observations with INTEGRAL, an ESA project with instruments and science data centre funded by ESA member states (especially the PI countries: Denmark, France, Germany, Italy, Switzerland, Spain), Czech Republic and Poland, and with the participation of Russia and the USA. JAT acknowledges partial support from NASA INTEGRAL Guest Observer grant NNX08AX92G.References
- Belloni et al. (2008) Belloni, T., Homan, J., Yamaoka, K., & Swank, J. 2008, ATel, 1804
- Corbel et al. (2008) Corbel, S., Tzioumis, T., Coriat, M., Brocksopp, C., & Fender, R. 2008, ATel, 1766
- Goldwurm et al. (2003) Goldwurm, A., David, P., Foschini, L., et al. 2003, A&A, 411, L223
- Hanke et al. (2008) Hanke, M., Wilms, J., Fürst, F., Nowak, M. A., & Pottschmidt, K. 2008, Atel, 1829
- Homan & Belloni (2005) Homan, J. & Belloni, T. 2005, Ap&SS, 300, 107
- Kalemci et al. (2006) Kalemci, E., Tomsick, J. A., Rothschild, R. E., et al. 2006, ApJ, 639, 340
- Kalemci et al. (2008) Kalemci, E., Tomsick, J. A., Yamaoka, K., & Ueda, Y. 2008, ATel, 1348
- Kaluzienski & Holt (1977) Kaluzienski, L. J. & Holt, S. S. 1977, IAU Circ., 3099, 3
- Kuulkers et al. (2008) Kuulkers, E., Brandt, S., Budtz-Jorgensen, C., et al. 2008, ATel, 1739
- Kuulkers et al. (2007) Kuulkers, E., Shaw, S. E., Paizis, A., et al. 2007, A&A, 466, 595
- Lutovinov et al. (2005) Lutovinov, A., Revnivtsev, M., Molkov, S., & Sunyaev, R. 2005, A&A, 430, 997
- Markwardt & Swank (2003) Markwardt, C. B. & Swank, J. H. 2003, ATel, 133
- McClintock et al. (2007) McClintock, J. E., Remillard, R. A., Rupen, M. P., et al. 2007, astro-ph, [0705.1034]
- Parmar et al. (2003) Parmar, A. N., Kuulkers, E., Oosterbroek, T., et al. 2003, A&A, 411, L421
- Prat et al. (2008a) Prat, L., Rodriguez, J., & Cadolle Bel, M. 2008a, ATel, 1745
- Prat et al. (2008b) Prat, L., Rodriguez, J., Cadolle Bel, M., et al. 2008b, ATel, 1808
- Rodriguez et al. (2008) Rodriguez, J., Shaw, S. E., Hannikainen, D. C., et al. 2008, ApJ, 675, 1449
- Rybicki & Lightman (1986) Rybicki, G. B. & Lightman, A. P. 1986, in Radiative Transfer in Astrophysics, Wiley-VCH
- Smith et al. (2002) Smith, D. M., Heindl, W. A., & Swank, J. H. 2002, ApJ, 569, 362
- Titarchuk (1994) Titarchuk, L. 1994, ApJ, 434, 570
- Vignarca et al. (2003) Vignarca, F., Migliari, S., Belloni, T., Psaltis, D., & van der Klis, M. 2003, A&A, 397, 729
- Yamaoka et al. (2008) Yamaoka, K., Swank, J. H., Belloni, T., & Takahashi, H. 2008, ATel, 1780