Spectroscopic Evidence for Gas Infall in GF 9-2
Abstract
We present spectroscopic evidence for infall motion of gas in the natal cloud core harboring an extremely young low-mass protostar GF 9-2. We previously discussed that the ongoing collapse of the GF 9-2 core has agreement with the Larson-Penston-Hunter (LPH) theoretical solution for the gravitational collapse of a core (Furuya et al.; paper I). To discuss the gas infall on firmer ground, we have carried out On-The-Fly mapping observations of the HCO+ (1–0) line using the Nobeyama 45 m telescope equipped with the 25 Beam Array Receiver System. Furthermore, we observed the HCN (1–0) line with the 45 m telescope, and the HCO+ (3–2) line with the Caltech Submillimeter Observatory 10.4 m telescope. The optically thick HCO+ and HCN lines show blueskewed profiles whose deepest absorptions are seen at the peak velocity of optically thin lines, i.e., the systemic velocity of the cloud (paper I), indicating the presence of gas infall toward the central protostar. We compared the observed HCO+ line profiles with model ones by solving the radiative transfer in the core under LTE assumption. We found that the core gas has a constant infall velocity of 0.5 km s-1 in the central region, leading to a mass accretion rate of 2.5 yr-1. Consequently, we confirm that the gas infall in the GF 9-2 core is consistent with the LPH solution.
1 Introduction
Without accurate knowledge of the collapsing process of an isolated dense cloud core, we cannot understand how a low-mass protostar forms through the accretion process. One of the major limiting factors is that the initial conditions of core collapse are not necessarily revealed by observations in detail. There has been a long standing theoretical debate about the gravitational collapse process since the early 1970s. Two extreme models of runaway collapse and quasi-static, inside-out collapse have been developed; the former is originally proposed by the Larson (1969) and Penston (1969) and extended by Hunter (1977), and the latter by Shu (1977). In this paper, we refer to the runaway collapse scenario as the Larson-Penston-Hunter (LPH) solution by following the nomenclature in McKee & Ostriker (2007). The validity of these solutions has been observationally studied by e.g., Ward-Thompson et al. (1994), and Looney, Mundy & Welch (2003).
In this context, we performed a detailed study of the natal cloud core harboring an extremely young low-mass protostar GF 9-2 (Furuya, Kitamura & Shinnaga 2006; hereafter paper I). The protostar is believed not to have generated an extensive molecular outflow, yielding a rare opportunity to investigate core collapse conditions free from the disturbance by the outflow. We discussed that the observed velocity field of the core is consistent with the initial conditions assumed in the LPH solution. The core shows a radial density profile of and the entire core has non-thermal line widths of (2–3), suggestive of gas infall motions ( is isothermal sound velocity). In order to shed light on the physical properties of the infall motions, we have carried out molecular line observations of the GF 9-2 core to detect the blueskewed profiles characterizing infall motion (e.g., Walker et al. 1986; Zhou et al. 1993; Ward-Thompson et al. 1996; Myers et al. 1996; Mardones et al. 1997; Onishi, Mizuno & Fukui 1999; Remijan & Hollis 2006).
2 Observations
We have carried out On-The-Fly (OTF) mapping observations (Sawada et al. 2008) of the HCO+ 1–0 line [rest frequency () = 89188.526 MHz] using the Nobeyama Radio Observatory (NRO)111Nobeyama Radio Observatory is a branch of the National Astronomical Observatory of Japan, National Institutes of Natural Sciences. 45 m telescope in 2006 May. We used the 25 Beam Array Receiver System (BEARS), and configured auto-correlators (ACs) as a backend, yielding an effective velocity resolution () of 0.048 km s-1 in the 8 MHz bandwidth mode. At the line frequency, the mean beam size () of the 25 beams was 186, and the mean main-beam efficiency () was 0.51. All the spectra were calibrated by the standard chopper wheel method, and were converted into main-beam brightness temperature () by dividing by . We adopted the correction factors provided by the observatory for gain differences between the 25 beams. The uncertainty in our intensity calibration is estimated to be 15%. The OTF mapping was carried out over an area with a size of 320″, employing position switching method. The telescope pointing was checked every 1.2 hrs, and was found to be accurate within 3″. The data reduction was done using the NOSTAR package. By using a spheroidal function as a gridding convolution function, we produced a data cube with a spatial resolution of 206 and a pixel size of 5″. Furthermore, in 2008 June, we have performed a single-point integration of the HCN (1-0) line toward the core center with the 45 m telescope. The beam size of the S80 receiver at the line frequency was 182 in HPBW, and was 0.44. We used acousto-optical spectrometers (AOSs), AOS-H, providing of 0.13 km s-1.
In 2006 July, 2007 August, and 2008 June, we have used the Caltech Submillimeter Observatory (CSO)222Caltech Submillimeter Observatory is operated by the California Institute of Technology under the grant from the US National Science Foundation (AST 05-40882). 10.4 m telescope to observe the HCO+ 3–2 transition ( 267557.633 MHz). We assumed 26″ at 267 GHz and estimated of from our measurements of Jupiter. We configured the 50 MHz band width AOS, providing of 0.055 km s-1. The HCO+ line was observed toward 33 positions with a grid spacing of 30″ centered on the GF 9-2 core center. The pointing accuracy was better than 3″, and the overall uncertainty in flux calibration was 30 %.
3 Results
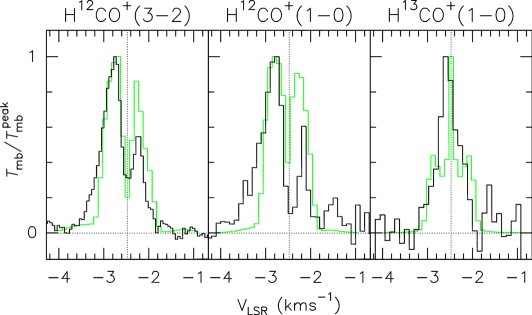
Figure 1 shows molecular line spectra toward the GF 9-2 core center in unit of . All the spectra, except the HCO+ , are the single-dish spectra taken with position switching. The HCO+ (1–0) spectrum was produced from the data cube () by convolving with a Gaussian profile in order to have an effective spatial resolution of 26″ in FWHM, which is equal to the CSO beam size for the HCO+ (3–2) line. Clearly, all the spectra show blueskewed profiles. The LSR-velocities of their deepest absorption agree with the systemic velocity () of the cloud, km s-1, which was estimated from the optically thin H13CO+ (1–0) and CCS lines (paper I) as well as NH3 inversion lines at 23 GHz (Furuya, Kitamura & Shinnaga 2008).
The velocities of the blueshifted peaks of the HCO+ (1–0) and (3–2) lines, are estimated to be km s-1 and km s-1, respectively, from Gaussian fitting. Similarly, we obtained km s-1 and km s-1 for the redshifted peaks of the (1–0) and (3–2) transitions, respectively. The obtained for both the transitions agree with each other, while the values differ by 0.1 km s-1 for the two transitions, suggesting that the velocity difference should be attributed to the intrinsic property of the gas rather than uncertainties in .
The three hyperfine (HF) components of the HCN (1–0) emission, showing blueskewed profiles, have comparable peak intensities, suggestive of large optical depths. We have performed HFS analysis of the blue- and redshifted components separately assuming that infall motions traced by the blue- and redshifted emission are independent, and that each emission can be approximated by a Gaussian profile. Our analysis gave the representative LSR-velocity () of km s-1, intrinsic velocity width () of km s-1, and total optical depth () of for the blueshifted components. Similarly, we obtained km s-1, km s-1, and for the redshifted components. These values lead to optical depths () of 1.6 and 1.3 for the blue- and redshifted components, 8.1 and 6.7 for the components, and 4.9 and 4.0 for the components, respectively, with uncertainty of 20%. The estimated for the blue- and redshifted gas of each HF component are comparable to each other, as expected from their intensity ratios, and seem to be consistent with the fact that the absorption dips in the and transitions are deeper than that in the transition.
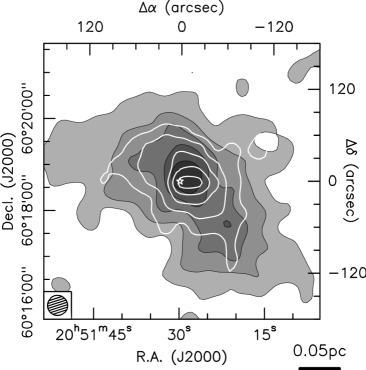
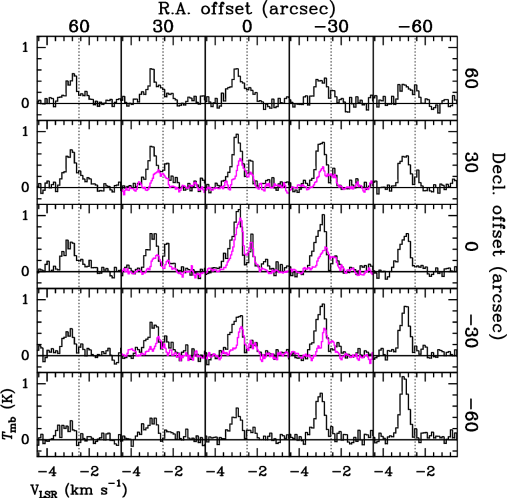
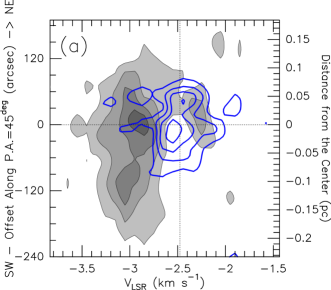
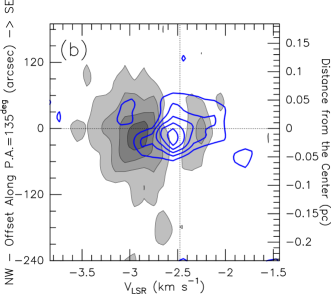
Figure 2 compares total integrated intensity maps of the H13CO+ (1–0) (paper I) and HCO+ (1–0) emission. Both lines show a similar spatial structure, but the HCO+ emission is more extended than the H13CO+. Figure 3 represents the HCO+ (3–2) and (1–0) mosaic spectra taken with 30″ spacing. Here, the (1–0) spectra were produced from the smoothed cube data in the same manner as for Figure 1. Both the transitions show the blueskewed profiles not only toward the core center, but also at some surrounding positions of, e.g., () () and (). Due to the limited S/N, it is difficult to assess whether or not the outer spectra (e.g., in the row of and the column of ) have blueskewed profiles. The HCO+ (1–0) emission show strong blueshifted emission toward the southwest, leaving a possibility that the emission represents another blueshifted component of the gas. In fact, the possibility is supported by Position-Velocity (PV) diagrams of the HCO+ (1–0) and H13CO+ (1–0) emission shown in Figure 4. Clearly, there exists an isolated blueshifted component of the HCO+ emission peaked at the offset position of (Figure 4a). It should be noted that the velocity structures in the central region of are fairly consistent with the blueskewed profiles expected for infall motion.
4 Discussion
Although the nature of the blueshifted HCO+ emission to the southwest is not clear, our observations show that the gas motion in the central region () is governed by the infall. Therefore, we focus on the discussion of the spectrum toward the core center. To give more quantitative constraints on the gas infall, we have developed a radiative transfer code to model the H12CO+ and H13CO+ spectra for a spherical core dominated by infall motion. The code was originally written for the CO emission from a protoplanetary disk (Omodaka, Kitamura & Kawazoe 1992). In this model, we assumed that local thermodynamic equilibrium (LTE) holds for the line excitation. To calculate the spectra, we assumed that the gas is infalling with a constant velocity ( ) for 30″, whereas a static state () for 30″ 100″ from Figures 2–4. We adopted the mass density radial profile reported in paper I: cm-3. We used a radial temperature profile of K with , on the basis of the temperature profile at yr after the formation of a protostar in Figure 2 by Masunaga & Inutsuka (2000b). We took a constant fractional abundance for H13CO+ of (paper I) all over the core, although this simplification may not be valid in a dynamically collapsing core (e.g., Aikawa et al. 2001). For a comparison with the observed spectra, we smoothed the calculated ones with a Gaussian function with 26″ and converted the flux density into the (see Omodaka et al. 1992).
Figure 5 compares calculated and observed spectral profiles whose intensity scales are normalized. Here we discuss only the velocity differences between the blue- and redshifted peaks because our calculations adopted the LTE approximation, and because rigorous calculations (Masunaga & Inutsuka, 2000b) show that the intensities of the model spectra significantly vary with the evolutionary stage of the protostar. We searched for a plausible value of to reproduce the observed line profiles, and found that a velocity of 0.5 km s-1 gives the most plausible H12CO+ line profiles. In fact, the calculated H12CO+ spectra have a reasonable consistency with the observed ones within the errors (Figure 5). We confirmed that the two cases of 0.3 and 0.7 km s-1 cannot reproduce the observed velocity differences between the blue- and redshifted peaks (). Notice that 0.5 km s-1 agrees with an estimate from 0.45 km s-1 in . Although the model H13CO+ line profile has the blue and red shoulders due to the central infalling region, the overall line profile seems agree with the observed one that has a single peak at owing to the outer static gas. As for , we also tried the two cases of 1/3 and 1, but found that both the values cannot reproduce the observed absorption features around . Here, the value of 1/3 is expected in the case that the dust opacity coefficient has the frequency dependence of (Doty & Leung, 1994). We addressed such a case because the overall properties of the dust in the GF 9-2 core, which is at a very early evolutionary stage, may be similar to those for the interstellar medium. In addition, the deep absorption dips around require the presence of a cold static envelope surrounding the contracting region.
It is known that a density profile of is expected for a central free-fall region onto the forming protostar. Our previous observations revealed that the profile of continues down to the central 600 AU region, although it was impossible to know whether or not exists at AU owing to our insufficient angular resolution. Given and 0.5 km s-1, we further calculated the HCO+ spectra for the case that the gas is freely falling onto the central protostar of 0.1 (paper I) at 600 AU. However, the resultant line profiles were not significantly changed compared with the above results.
Although the LPH solution well describes the on-going collapse in the GF 9-2 core (paper I), we examined a case for the Shu’s solution. We assumed that the gas is freely falling toward a 0.1 protostar at 600 AU and is static at AU on the basis of the observed density profile (paper I). The calculated HCO+ spectra for the two transitions do not show blueskewed profiles, but double-peaked spectra having an absorption dip at the . This would be a natural consequence by giving the compact free-fall region embedded in the large static core.
Assuming that the infall motion is radial, we can estimate the mass accretion rate by . We obtain of 2.5 yr-1 with uncertainty of a factor . Since theoretical models of protostar formation (e.g., Stahler, Shu & Tamm 1980; Masunaga & Inutsuka 2000a) predict that the protostar radius, , should be for a low-mass protostar, we can calculate an accretion luminosity () for the central protostar(s) of . This seems reasonable compared with the luminosity expected for a protostar at a very early evolutionary stage (see e.g., Figure 7 in Masunaga & Inutsuka 2000a). Consequently, our study confirms that the gas in the GF 9-2 core is infalling onto the protostar(s) in the central region, and that the infalling velocity is consistent with the prediction from the LPH solution. Furthermore, we plan to perform deeper integration of these HCO+ lines to examine the presence of the infalling gas in the outer region of the core.
References
- Aikawa et al. (2001) Aikawa, Y., Ohashi, N., Inutsuka, S.-i., Herbst, E., & Takakuwa, S. 2001, ApJ, 552, 639
- Doty & Leung (1994) Doty, S. D., & Leung, C. M. 1994, ApJ, 424, 729
- Furuya et al. (2006) Furuya, R. S., Kitamura, Y., & Shinnaga, H. 2006, ApJ, 653, 1369 (paper I)
- Furuya et al. (2008) Furuya, R. S., Kitamura, Y., & Shinnaga, H. 2008, PASJ, 60, 421
- Hunter (1977) Hunter, C. 1977, ApJ, 218, 834
- Larson (1969) Larson, R. B. 1969, MNRAS, 145, 271
- Looney et al. (2003) Looney, L. W., Mundy, L. G., & Welch, W. J. 2003, ApJ, 592, 255
- Mardones et al. (1997) Mardones, D., Myers, P. C., Tafalla, M., Wilner, D. J., Bachiller, R., & Garay, G. 1997, ApJ, 489, 719
- Masunaga & Inutsuka (2000a) Masunaga, H., & Inutsuka, S.-i. 2000, ApJ, 531, 350
- Masunaga & Inutsuka (2000b) Masunaga, H., & Inutsuka, S.-i. 2000, ApJ, 536, 406
- McKee & Ostriker (2007) McKee, C. F., & Ostriker, E. C. 2007, ARA&A, 45, 565
- Myers et al. (1996) Myers, P. C., Mardones, D., Tafalla, M., Williams, J. P., & Wilner, D. J. 1996, ApJ, 465, L133
- Omodaka et al. (1992) Omodaka, T., Kitamura, Y., & Kawazoe, E. 1992, ApJ, 396, L87
- Onishi et al. (1999) Onishi, T., Mizuno, A., & Fukui, Y. 1999, PASJ, 51, 257
- Penston (1969) Penston, M. V. 1969, MNRAS, 144, 425
- Remijan & Hollis (2006) Remijan, A. J., & Hollis, J. M. 2006, ApJ, 640, 842
- Sawada et al. (2008) Sawada, T., et al. 2008, PASJ, 60, 445
- Shu (1977) Shu, F. H. 1977, ApJ, 214, 488
- Stahler et al. (1980) Stahler, S. W., Shu, F. H., & Taam, R. E. 1980, ApJ, 241, 637
- Walker et al. (1986) Walker, C. K., Lada, C. J., Young, E. T., Maloney, P. R., & Wilking, B. A. 1986, ApJ, 309, L47
- Ward-Thompson et al. (1996) Ward-Thompson, D., Buckley, H. D., Greaves, J. S., Holland, W. S., & André, P. 1996, MNRAS, 281, L53
- Ward-Thompson et al. (1994) Ward-Thompson, D., Scott, P. F., Hills, R. E., & Andre, P. 1994, MNRAS, 268, 276
- Ward-Thompson (2002) Ward-Thompson, D. 2002, Science, 295, 76
- Zhou et al. (1993) Zhou, S., Evans, N. J., II, Koempe, C., & Walmsley, C. M. 1993, ApJ, 404, 232