Star Formation Around Supergiant Shells in the LMC
Abstract
We examine the recent star formation associated with four supergiant shells (SGSs) in the Large Magellanic Cloud (LMC): LMC 1, 4, 5, and 6, which have been shown to have simple expanding-shell structures. H II regions and OB associations are used to infer star formation in the last few Myr, while massive young stellar objects (YSOs) reveal the current ongoing star formation. Distributions of ionized, H I, and molecular components of the interstellar gas are compared with the sites of recent and current star formation to determine whether triggering has taken place. We find that a great majority of the current star formation has occurred in gravitationally unstable regions, and that evidence of triggered star formation is prevalent at both large and local scales.
1 Introduction
The interstellar medium (ISM) of late-type galaxies often exhibits prominent, large shell structures with sizes approaching 1 kpc. These “supergiant shells” (SGSs) are thought to be formed by the fast stellar winds and supernova explosions of multiple generations of massive star formation; they require 10 ergs for their creation, the equivalent of tens to hundreds of supernova explosions (Meaburn, 1980). The expansion of a SGS can shock and sweep up interstellar gas, altering the physical conditions and distribution of the ISM. Most notably, a SGS may puncture its galactic gas disk and vent hot gas into the galactic halo, while its expansion in the galactic disk can compress ambient gas and induce star formation.
SGSs have been identified from H images of ionized gas or 21-cm line data of neutral H I gas. These two types of surveys do not lead to the same set of objects in a galaxy. In Paper I (Book et al. 2008), we used objects in the Large Magellanic Cloud (LMC) to illustrate that not all H-identified SGSs are physical shells and that the H-identified sample (Meaburn, 1980) and H I-identified sample (Kim et al., 1999) differ mainly in their recent star formation history. In this paper, we investigate the role played by SGSs in star formation.
Star formation can be triggered by the expansion of a SGS via two methods (Elmegreen, 1998). As a SGS expands, it sweeps up and collects the ambient ISM in its shell, and when the dense shell gas cools, it may become gravitationally unstable and collapse to form stars. Alternatively, the expansion of a SGS may compress preexistent dense clouds around its edge, causing these clouds to collapse. Due to the proximity of the LMC (50 kpc; Feast, 1999), the SGSs in the LMC provide ideal sites to observe star formation associated with SGSs and determine their star formation mechanism.
Yamaguchi et al. (2001a, b) have examined the distribution of their 168 molecular clouds and young (30 Myr) stellar clusters (Bica et al., 1996) with respect to the nine H-identified SGSs in the LMC. They find that the surface density of molecular clouds near the rims of SGSs is enhanced by a factor of 1.5–2 in both number and mass, while the surface density of the clusters inside the SGSs is four times as high as that outside. Furthermore, they find that 70% of the clusters associated with molecular clouds along the SGS rims are located on the interior-facing side of the clouds. These results suggest that SGSs do play a significant role in both the formation of molecular clouds and the dynamical triggering of cluster formation.
We have investigated the most recent star formation in four H-identified SGSs in the LMC, LMC 1, 4, 5, and 6, which have been demonstrated in Paper I to be physical shells with a simple expanding structure. We use two observational indicators of recent star formation, H II regions and young stellar objects (YSOs). H II regions are photoionized by the UV radiation from hot massive stars, which are most frequently found in OB associations. Limited by the lifetime of O-type stars, H II regions trace the star formation that occurred within the last few Myrs. Massive stars are formed rapidly; thus, massive YSOs trace the current, ongoing star formation within 1 Myr. As YSOs are still enshrouded, they have not significantly altered their ambient ISM, and thus allow us to examine the interstellar conditions that have led to their formation. Using H II regions and massive YSOs, we are able to infer the recent star formation history of the SGSs and further assess whether star formation was triggered in these areas.
This paper reports our findings on the star formation around these four SGSs in the LMC. In Section 2 we describe the observations upon which we base our analysis. In Section 3 we compare the distributions of OB associations, YSOs, and interstellar gas for each of the four SGSs, and discuss the implications for star formation. In Section 4 we show that enhanced star formation along the SGS rims is statistically significant and that star formation occurs mostly in gravitationally unstable regions. Our conclusions are summarized in Section 5.
2 Observations
We have used H images of the SGSs to show the distribution of ionized gas, H I observations to show the complete shell structure, Spitzer Space Telescope infra-red (IR) observations to examine the dust distribution and YSOs, and CO maps to show the distribution of molecular gas in these SGSs.
2.1 Optical H Images
We have used H images from the Magellanic Cloud Emission-Line Survey (MCELS, Smith & The MCELS Team, 1999), which was made with a CCD camera on the Curtis Schmidt Telescope at Cerro Tololo Inter-American Observatory. The images have an angular resolution of 3′′, and were taken with a narrow-band interference filter centered on the H line ( Å, Å). The detector was a front-illuminated STIS 2048 2048 CCD with 21 m pixels, giving a field of view of 11 11. The H images were mosaicked to cover the central 8∘ 8∘ of the LMC. From the mosaic we extracted regions covering the neighborhoods of the H-selected SGSs.
2.2 H I Observations
The neutral hydrogen data were synthesized by Kim et al. (2003), combining observations made with the Australia Telescope Compact Array (ATCA) and the single-dish Parkes Telescope. These observations cover 111 124 of the sky, and the final synthesized images have an angular resolution of 10 and a pixel size of . The observing band was centered on 1.419 GHz, corresponding to a central heliocentric velocity of 297 km s-1. The bandwidth used was 4 MHz, giving a complete velocity range of 33 to +627 km s-1 (Kim et al., 1998, 2003).
2.3 Spitzer Space Telescope Observations
The LMC has been surveyed by the Spitzer Space Telescope using both the InfraRed Array Camera (IRAC; Rieke et al., 2004) and the Multiband Imaging Photometer for Spitzer (MIPS; Fazio et al., 2004) under the Legacy Program “SAGE” (Meixner et al., 2006). The observations were made in the IRAC 3.6, 4.5, 5.8 and 8.0 m and MIPS 24, 70, and 160 m bands in 2005 July and October–November. The survey covers 7 on the sky, with a 7 7 array of 11 11 tiles of IRAC exposures and a 19 2 array of 4 04 MIPS fastscans. The angular resolutions are 2′′ for the IRAC bands and 6′′ for the MIPS 24 m band, corresponding to 0.5 and 1.5 pc at the distance of the LMC (50 kpc; Feast 1999). The MIPS 70 and 160 m images, having much lower resolutions, are not used in this study.
This paper uses mosaicked Spitzer images of SGSs made with the archival SAGE data, and the YSO list made by Gruendl & Chu (2008) using the SAGE data. The masses of YSOs are uncertain, but in general those brighter than 8 mag at 8.0 m represent massive stars with masses greater than 10 and the fainter ones represent intermediate-mass stars with masses of 4–10 (Chen et al., 2008). This YSO list does not include low-mass YSOs as they cannot be distinguished from background galaxies in the diagnostic color-magnitude diagrams.
2.4 CO Data
To compare the distributions of YSOs and molecular clouds around the SGSs, we use the CO 2.6 mm line observations from the LMC survey made with the 4-m NANTEN telescope at Las Campanas Observatory in Chile (Fukui et al., 1999, 2001). The telescope has a beam size of 26 and a pointing accuracy of 20′′. Observations were made every 2′ spacing in position switching, covering 6 on the sky in a total of 32800 observed positions. Note that the detection limit of the NANTEN survey was a few , thus dust globules and small molecular clouds would not be detected.
3 Star Formation Around SGSs
Massive stars may dynamically alter the physical conditions of the ambient ISM via fast stellar winds and supernova explosions, and photoionize the ISM with UV radiation. SGSs have dynamic ages greater than the lifetime of a massive star; thus, the massive stars that were responsible for shaping the ISM must have been formed earlier than those that are currently photoionizing the ISM. The prolonged history of star formation and the interaction between massive stars and the ISM in SGSs are best illustrated by H images.
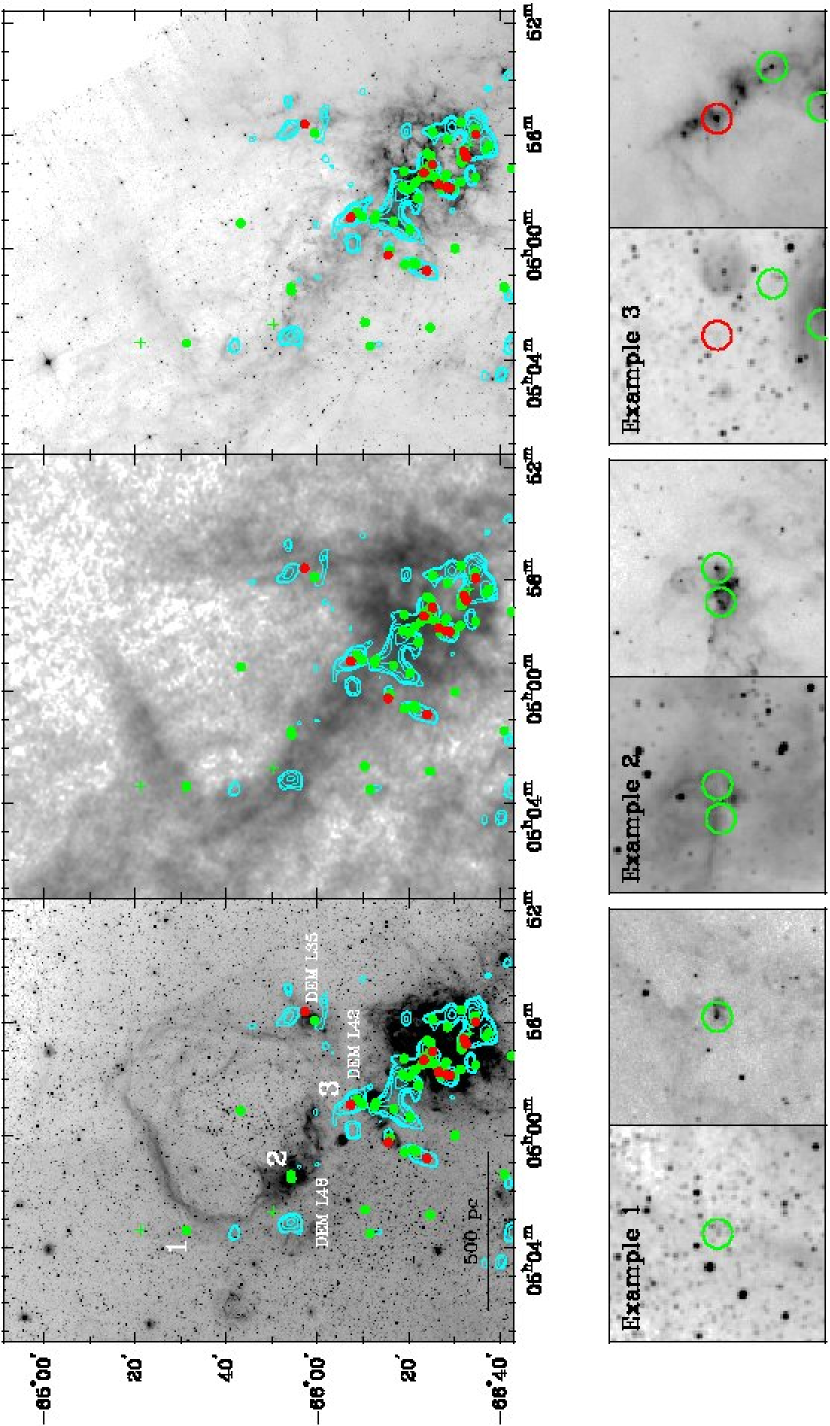
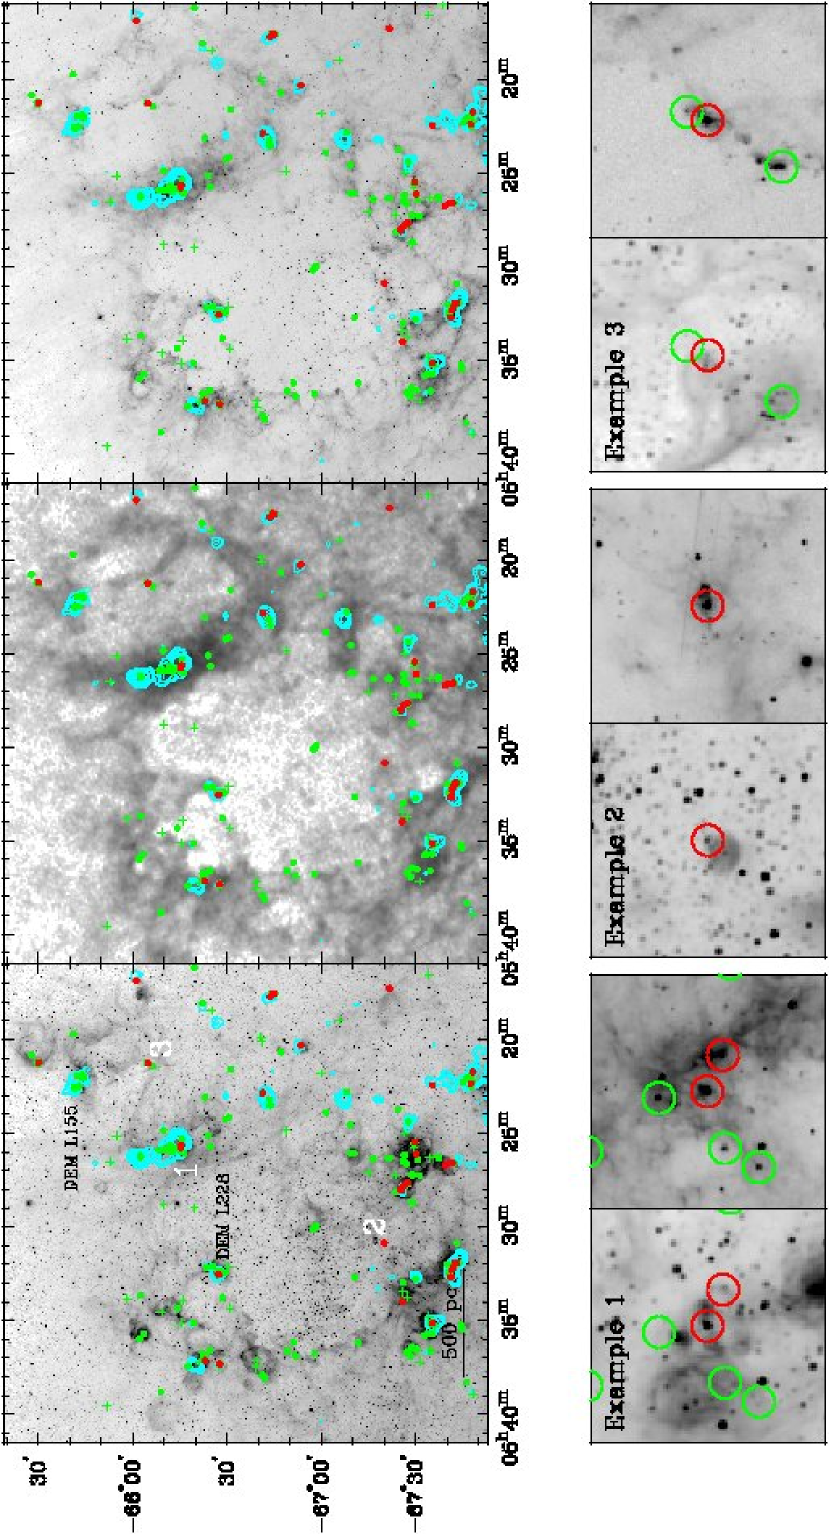
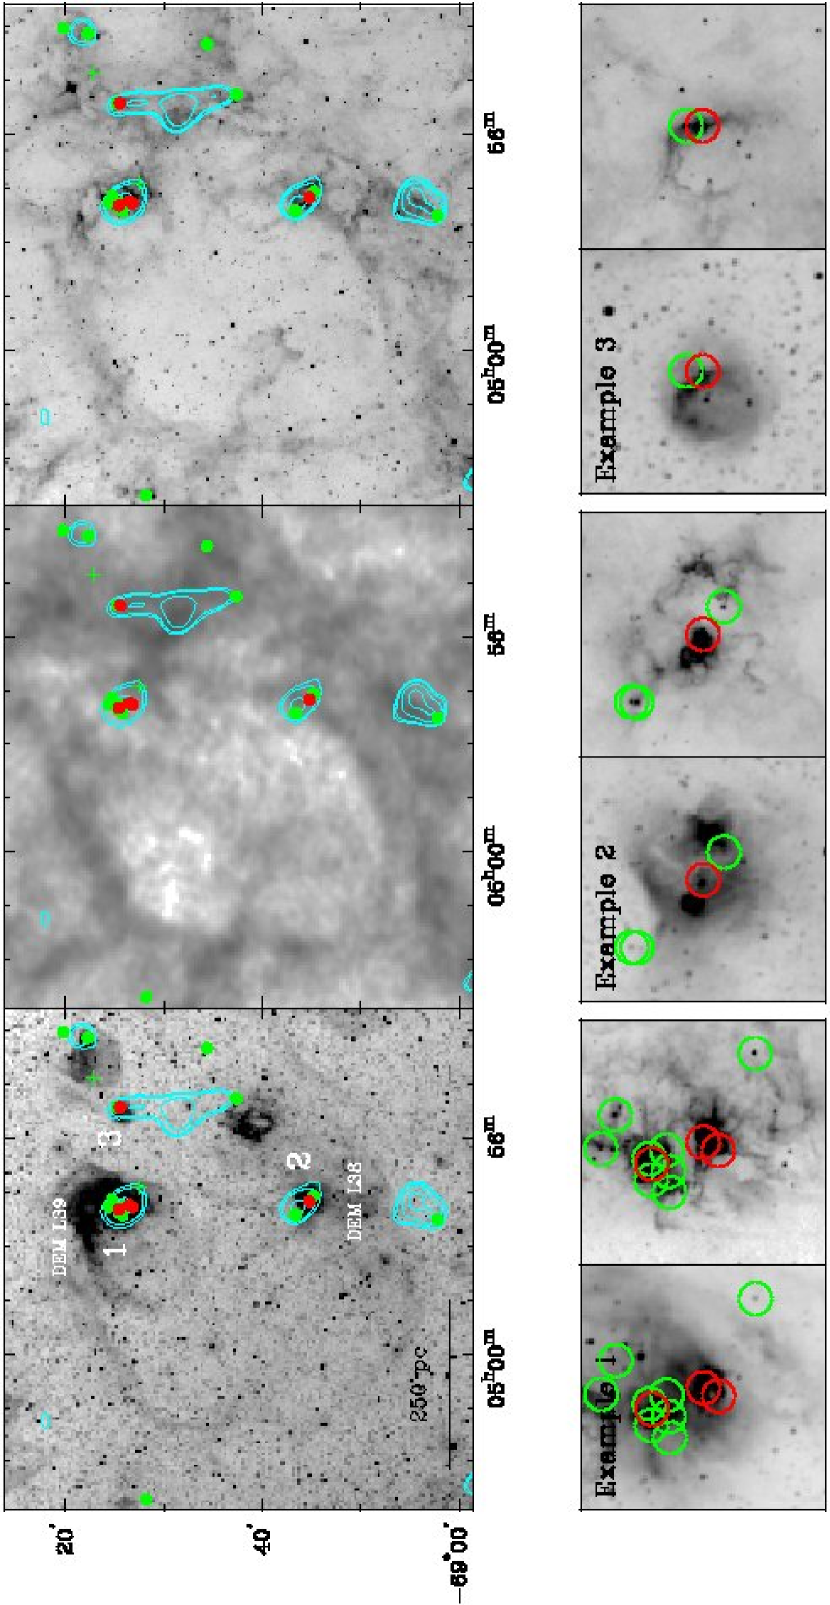
In Figures 1-3, we present H images of SGSs LMC 1, 4, 5, and 6. The filamentary morphology and shell structures amply manifest the dynamical effects of fast stellar winds and supernova explosions. In these figures, we further plot the massive and intermediate-mass YSOs identified by Gruendl & Chu (2008) in red and green circles, respectively, and uncertain intermediate-mass YSOs in green crosses. The relative locations of YSOs and ionized gas not only reveal the star formation history from a few Myr ago to present, but also allow us to assess whether the current star formation was triggered by stars from a previous generation through the expansion of the SGSs.
The expansion of the SGSs may be responsible for two types of triggered star formation. The first, collect and collapse, describes a situation in which the expansion of a shell causes gas to collect along its rim, and the eventual cooling leads to fragmentation and gravitational collapse to form stars. The second mechanism involves the compression of preexisting clouds by the expansion of a SGS to trigger star formation. These two mechanisms can be observationally discerned from the distribution of YSOs and the interstellar gas.
We use H I, neutral hydrogen, to trace the bulk gas and CO to trace dense molecular clouds. In the top middle panels of Figures 1-3, we compare the distributions of H I (in grey scale) and CO (in contours) in the SGS shells and in their surroundings in order to assess whether the molecular clouds are compressed preexisting clouds or formed in the shell from cooled swept-up interstellar gas. The Spitzer 8 m images, in the top right panels of Figures 1–3, show good correlation with H I images but at a much higher angular resolution.
Below we examine the recent star formation around the SGSs LMC 1, 4, 5, and 6 individually. We compare the YSO locations with the distributions of OB associations and H II regions to examine the star formation history in the last few Myr, and use the H I and molecular components of the shell gas to assess the physical conditions of the environment of current star formation. To avoid crowding, the H II regions are marked in Figs. 1–3 of this paper, and OB associations marked in the H images in Figs. 1, 4, and 5 of Paper I.
3.1 LMC 1
LMC 1 has the simplest and most coherent shell structure among all SGSs in the LMC. Its H image in Figure 1 (top left) shows the bright H II region DEM L48 (Davies et al., 1976) at the southeast shell rim, a fainter H II region DEM L35 at the southwest shell rim, and curved filaments delineating the rest of the shell. The OB association LH16 (Lucke & Hodge, 1970) stretches from the center of LMC 1 to the bright southeast H II region, possibly indicating a propagation of star formation. While the stars at the southeast end of LH16 are younger and responsible for the photoionization of the H II region DEM L48, the stars at the northwest end of LH16 are older and are likely responsible for the formation of LMC 1’s large shell structure. YSOs associated with LMC 1 are mostly distributed around its periphery; they are either inside H II regions DEM L35 and 48 or near the H II region DEM L42 at the outer southern boundary of LMC 1. This distribution is consistent with the aforementioned conjecture that star formation has proceeded outwards in LMC 1. Away from these H II regions, only a low-level of star formation is observed, as one YSO lies along a wisp just outside the northeast rim of the optical shell and another is projected toward the shell center.
The molecular clouds in LMC 1 fall mostly in dense regions along the H I shell, but there is no good correlation between YSOs and molecular clouds. Only one cloud near the H II region DEM L42 contains YSOs; the other less-massive clouds along the H I shell are almost entirely without YSOs. If these YSO-less clouds originated from preexisting molecular clouds that had been swept into the expanding SGS shell, the compression would have been conducive to gravitational collapse and star formation. The absence of bright YSOs indicates that these clouds were probably formed from the gas collected in the SGS shell, but have not collapsed yet. It is also possible that these clouds are forming only low-mass YSOs, which cannot be identified from Spitzer data alone; high-resolution and sensitive images in the near-infrared are needed to search for low-mass pre-main-sequence stars.
The YSOs in the LMC 1 shell all fall near the inner rim of its H I shell. The YSOs along the south rim of LMC 1 are all associated with H II regions that are photoionized by massive stars born in the last few Myr. The formation of these YSOs may have been affected more directly by the local H II regions than the SGS itself. Three examples of local environments of YSOs are given in the bottom panels of Figure 1. For each example, a pair of MCELS H and Spitzer 8 m images are displayed; the former shows the distribution of ionized interstellar gas and the latter shows YSOs (point sources) and warm dust and PAH emission (diffuse sources). In Example 1, the YSO is located in the northeast quadrant of LMC 1 at the inner boundary of the H I shell; the expansion of the ionized gas shell into the neutral shell may have triggered the formation of this YSO. In Example 2, the YSOs are in the H II region DEM L48, but the close-up H image in the bottom middle panel of Figure 1 shows that the YSOs are located in dust lanes bordering ionized gas; it is likely that the expansion of the H II region triggered the YSO’s formation. In Example 3, the YSO is inside a giant molecular cloud along the south rim of LMC 1; no obvious triggering mechanisms can be concluded.
We note that the YSO candidate (045907.4654313.3) near the center of the LMC 1 shell may be a Be-like star with circumstellar material. This object shows bright photospheric emission with , , and (Zaritsky et al., 2004), consistent with a B0-2 III star with a reddening of = 0.1–0.15. Such post-main sequence early-type B stars are yr old, similar to the age of the SGS LMC 1. This YSO candidate near the center of LMC 1 is probably not a bona fide YSO.
To the south of LMC 1 is the active star forming region N11, and the H I image suggests that N11 and LMC 1 may be physically connected. It is unlikely that a causal relationship in star formation exists between LMC 1 and N11, based on an examination of stellar ages in N11. At the center of N11 is a superbubble blown by the 4–5 Myr old OB association LH 9, and the superbubble is surrounded by the 2 Myr old OB associations LH 10 to the north and LH 13 to the east (Walborn & Parker, 1992). Clearly, the star formation in N11 started at its center and propagated outwards. The center of N11 is more than 200 pc from the rim of LMC 1. There is no feasible physical mechanism to link the star formation activities of N11 and LMC 1.
3.2 LMC 4
LMC 4 is the largest SGS in the LMC, and has a roughly circular shape with a diameter of 1.2 kpc. Its H shell is composed of many long filaments connecting a series of H II regions. As noted in Paper I, multiple OB associations exist in LMC 4: LH77 near the center of the shell has an H arc near its western end, and LH72 is in an H II region that extends from the northern rim toward the shell interior, while LH51, 56, 57, 58, 83, 91, and 95 are in H II regions along the shell rim, and LH52 and 53 are located in H II regions in the interaction zone between LMC 4 and LMC 5. Apparently, star formation has proceeded outward in LMC 4. Figure 2 (top left) shows that most, 80%, of the YSOs are associated with the H II regions along the periphery, confirming the continuing star formation activity. It also shows a few YSOs within the central cavity of LMC 4, but usually superposed on diffuse H emission.
LMC 4 has a number of molecular clouds strung along its rim. Considering the large volume of gas that has been swept into the shell, it is likely that the formation of molecular clouds is due to collect and collapse. The only exception is the cloud associated with LH72, which appears to be a preexisting cloud that has been compressed by the expansion of the LMC 4 shell. The concentration of molecular gas along the shell rim is most noticeable in the region between LMC 4 and LMC 5, where it appears that the collision of the two shells has further compressed the shell gas and caused a very dense, large molecular cloud to form.
The most massive molecular clouds in LMC 4 are associated with H II regions and OB associations. YSOs are found in every molecular cloud along the rim of LMC 4, including the one coincident with LH72 and DEM L228 in the northern extension into the shell interior. The YSOs that are not associated with large molecular clouds are all in ionized gas, with a range of surface brightness from prominent superbubbles to diffuse field gas. These ionized interstellar structures require the injection of stellar energy, in the form of stellar winds and supernova explosions; thus their underlying stellar population must be older than those that are still in dense H II regions associated with molecular clouds. The majority of the YSOs not in molecular clouds are also located along LMC 4’s shell rim, similar to those in molecular clouds. Overall, we see that most YSOs in the LMC 4 region are distributed along the shell rim and are in environments with a history of recent star formation.
LMC 4 has long been cited as a classic example of a large interstellar shell consisting of swept-up material that has subsequently cooled, fragmented, and collapsed to form stars (Domgörgen et al., 1995). The distributions of molecular clouds, OB associations, H II regions, and YSOs in the LMC 4 shell are certainly consistent with this assertion (Yamaguchi et al., 2001a). At a detailed level, shocks and photoionization induced implosions may be responsible for the onset of star formation. Example 1 in Figure 2 shows active star formation along the collision zone between LMC 4 and LMC 5; the compression may be responsible for forming the giant molecular clouds, but the locations of YSOs at the boundary between ionized gas and dust clouds indicate that local triggering still plays an important role. Example 2 shows a YSO interior to LMC 4; the H image reveals that the YSO is at the edge of a small H II region (12 pc in diameter), which might have triggered the YSO formation.
3.3 LMC 5
LMC 5 is located just to the northwest of LMC 4, and the collision of their shells has caused a density enhancement on the eastern side of LMC 5. H II regions exist along the interaction zone between LMC 5 and LMC 4 and at the northern tip of LMC 5. Three OB associations lie along the rim of LMC 5, LH52 and 53 along the interaction zone and LH45 in the northern H II region DEM L155. No OB association is identified in LMC 5’s shell interior. Long H filaments on the southern and western sides complete the shell of LMC 5. Most YSOs in LMC 5 exist in the northern H II region and the H II regions along the interaction zone. Only three YSOs are located in the interior of LMC 5, and they are all associated with interior H filaments.
LMC 5 has three distinct molecular clouds along its rim. The most massive one is located in the interaction region between LMC 4 and 5, superposed on the OB associations LH52 and 53 and their numerous H II regions. The second is in the north with the OB association LH45 and its H II region DEM L155. The third cloud is the least massive one and sits at the south end of the interaction zone without any noticeable H II region. Since there are small molecular clouds in the surroundings of LMC 5, it is not clear whether the molecular clouds around the shell rim were formed by collect and collapse or compression of preexisting clouds. It is likely that both mechanisms have taken place.
About 2/3 of the YSOs in LMC 5 are in these three molecular clouds. The majority of the remaining 1/3 are located between the two molecular clouds along the interaction zone and are associated with diffuse ionized gas, where the supernova remnant 0524-664 in DEM L175 is located. Only 2 or 3 YSOs are in diffuse ionized gas projected in the shell interior. We conclude that, similar to LMC 4, the expansion of LMC 5 may be responsible for triggering the formation of OB associations, especially in the collision zone against LMC 4, but local shocks and photoionization triggered the formation of isolated stars. For instance, Example 3 in Figure 2 shows YSOs at the boundary between ionized gas and a long H I filament inside LMC 5.
3.4 LMC 6
LMC 6 is the smallest of the simple H-selected SGSs in the LMC. Figure 3 (top left) shows two H II regions, DEM L38 and 39, along the western periphery of LMC 6. Long H filaments define the eastern half of the LMC 6 shell. Two OB associations, LH11 and 12, reside in DEM L38 and 39, respectively, but no OB associations have been identified within the LMC 6 shell interior, possibly owing to a lower concentration of former star formation. It shows very little on-going star formation. Only a few YSOs are present and all of them cluster within the H II regions associated with the two OB associations.
LMC 6 shows only two molecular clouds along its rim, associated with the OB associations LH11 and 12. Since these clouds are only on one side of the shell and there are also exterior molecular clouds, they are likely preexisting clouds that have been simply compressed by the expansion of LMC 6. The absence of detectable molecular clouds along other parts of the shell rim may be attributed to the low density of the environment of LMC 6 and the small size of the shell so that not enough gas mass has been swept into a shell to form large molecular clouds.
The star formation of LMC 6 contrasts with all of the previous shells. Few YSOs surround this SGS, and all fall within the dense molecular clouds that have formed the OB associations LH11 and LH12. Two molecular clouds to the west, exterior of LMC 6, are also forming stars, but at a lower level than the two clouds along the rim of LMC 6. Compression by the expanding LMC 6 shell may not have started the initial star formation in the two molecular clouds along its rim, but must have helped to raise the star formation activity.
The formation of YSOs in the H II regions DEM L38 and 39 appears to be dictated by the local interstellar conditions. Example 1 in Figure 3 shows the active star formation associated with the OB association LH12 in DEM L39; the environment is sufficiently complex that star formation triggers cannot be unambiguously identified. Example 2 shows the star formation in LH11 in DEM L38; some YSOs are located near boundaries between ionized gas and dark clouds, while others are projected against the bright emission of the H II region. Example 3 shows YSOs in a molecular cloud outside LMC 6; again, YSOs are located near the boundaries between ionized gas and dark clouds.
4 Discussion
4.1 Statistical Analysis of the Star Formation Distribution
The distribution of YSOs with respect to the SGSs in Figures 1-3 appear to show that most YSOs in the vicinity of each SGS are on the rim. In order to quantitatively establish this we have measured the surface density of YSOs in annular regions that roughly match the shape of the H I shell and extend from the SGSs interior, through the shell rim, and around the immediate periphery of the shell. Specifically we use elliptical annuli that roughly match the H I shells of LMC 4, 5, and 6, and a series of trapezoidal annuli to approximate the shape of LMC 1. The trapezoidal annuli for LMC 1 are truncated on the southern side to avoid including sources in the N 11 H II complex and the average radius of each region is used for plotting purposes.
The resulting surface density of YSOs for each SGS is plotted in Figure 4, which shows a clear peak along the rim of each SGS. Furthermore, the surface density of YSOs along the SGS rims is generally two to three times higher than the average for the LMC at the same galactic radius, similar to the results of Yamaguchi et al. (2001b). To show the statistical significance of the enhancements, we have plotted in Figure 4 error bars that reflect the counting statistics in each annular region. The enhancement at the shell rim seen in LMC 1, 5, and 6 suffer from small number statistics and are dominated by a few YSOs in a few relatively small areas. These results may reflect a degree of organization in the star formation, but the uncertainty is large. On the other hand, the number of YSOs in LMC 4 that contribute to the pattern is much larger and do appear to be significantly higher than would be expected. Thus the amount of star formation on the periphery of LMC 4 appears to be statistically elevated, suggesting that the amount of star formation is either augmented or organized by the SGS.
4.2 Global Gravitational Instability
Large-scale star formation in a galaxy is commonly believed to be driven by global gravitational instability. To investigate this hypothesis for the LMC, Yang et al. (2007) have considered a disk of gas only and a disk of both collisional gas and collisionless stars. They find that only 62% of massive YSOs are in gravitationally unstable regions for the former case and 85% for the latter.
It may be of interest to examine the relationship between the star formation in SGSs and the global gravitational instability in the LMC. We compare the locations of YSOs in the SGSs with Yang et al.’s (2007) gravitational instability map that considered both the gas and stars.
The neutral shell of LMC 1 appears in the gravitational instability map to be almost entirely unstable, with only the northwestern corner closest to the edge of the LMC gravitationally stable (Fig. 4 of Yang et al. 2007). All of the YSOs around LMC 1 are within the unstable region.
LMC 4 has an uneven distribution of unstable patches around its edge. While most of the star formation is occurring in the unstable regions, there are also a few YSOs located in regions that are gravitationally stable, such as the few YSOs located in the interior of the shell.
LMC 5, like LMC 1, is composed of an almost entirely unstable rim, and all of the YSOs around it fall in unstable regions. Only two or three YSOs fall in the interior of LMC 5, in a gravitationally stable region.
LMC 6 is located at the western end of the stellar bar of the LMC, a very dense region which is entirely gravitationally unstable. The shell itself is unstable all around the rim, with a stable cavity in the interior; all YSOs near LMC 6 are in the unstable regions.
These comparisons indicate that the great majority of YSOs formed in SGSs LMC 1, 4, 5, and 6 are in gravitationally unstable regions, where cloud collapse can be easily triggered by perturbations. A small number of YSOs in LMC 1, 4, and 5 lie in gravitationally stable regions, and in all cases the YSOs are projected within the SGS interiors and superposed on diffuse H emission. To investigate the formation of these YSOs, the detailed local environments need to be examined.
YSOs projected within SGS interiors have interstellar environments similar to those of YSOs projected in superbubble interiors. In the case of the superbubble N51D (Henize, 1956), its interior YSOs have been serendipitously imaged by the Hubble Space Telescope (HST) and shown to be embedded in dust globules whose surfaces are photoionized by the OB associations in N51D (Chu et al., 2005). The photoionized surface has a much higher thermal pressure than the interior of the globule, and the implosion leads to star formation. It is possible that the YSOs in the gravitationally stable interior of the SGSs are also formed in the same fashion. High-resolution HST images are needed to reveal the YSOs’ immediate environment and verify the existence of dust globules.
5 Conclusion
We have examined the distribution of YSOs and interstellar gas around the four simple coherent expanding H-selected SGSs LMC 1, 4, 5, and 6. While we find different patterns and histories of star formation in these SGSs, we also find common characteristics in their current star formation.
On the largest scale, recent star formation occurs preferentially along the peripheries of the SGSs. There is an excellent correlation between young OB associations that are still in H II regions and the existence of molecular clouds. These regions are also hosts of higher concentration of massive YSOs, indicating that star formation continues.
Both collect-and-collapse and compression mechanisms may take place in the formation of molecular clouds. LMC 1 has collected but not collapsed; consequently, no active star formation is present in LMC 1. LMC 4 and 5 have formed molecular clouds by both collect-and-collapse and compression, and active star formation (both OB associations and massive YSOs) is seen along their rims, especially along their interaction zone. LMC 6 may have compressed preexisting molecular clouds and triggered the formation of two OB associations.
A small number of isolated YSOs are also seen along shell peripheries and even in shell interiors without detectable molecular clouds. Close examination shows that the formation of most of these YSOs is triggered by local ionization fronts advancing into small dark clouds. Such local triggering of star formation is important even in H II regions where massive stars have dynamically altered the physical structures of the interstellar gas.
Using the star formation in the SGSs LMC 1, 4, 5, and 6, we have illustrated that the global gravitational instabilities may have prepared the conditions for star formation, but the actual star formation is begun by triggering, both on large scales and local scales.
References
- Bica et al. (1996) Bica, E., Claria, J. J., Dottori, H., Santos, J. F. C., Jr., & Piatti, A. E. 1996, ApJS, 102, 57
- Chen et al. (2008) Chen, C.-H. R., Chu, Y.-H., Gruendl, R. A., Gordon, K. D., & Heitsch, F. 2008, submitted to ApJ
- Chu et al. (2005) Chu, Y.-H., et al. 2005, ApJ, 634, L189
- Davies et al. (1976) Davies, R. D., Elliott, K. H., & Meaburn, J. 1976, MmRAS, 81, 89
- Domgörgen et al. (1995) Domgörgen, H., Bomans, D. J., & de Boer, K. S. 1995, A&A, 296, 523
- Elmegreen (1998) Elmegreen, B. G. 1998, in Astronomical Society of the Pacific Conference Series, Vol. 148, Origins, ed. C. E. Woodward, J. M. Shull, & H. A. Thronson, Jr., 150
- Fazio et al. (2004) Fazio, G. G., et al. 2004, ApJS, 154, 10
- Feast (1999) Feast, M. 1999, in IAU Symposium, Vol. 190, New Views of the Magellanic Clouds, ed. Y.-H. Chu, N. Suntzeff, J. Hesser, & D. Bohlender, 542
- Fukui et al. (2001) Fukui, Y., Mizuno, N., Yamaguchi, R., Mizuno, A., & Onishi, T. 2001, PASJ, 53, L41
- Fukui et al. (1999) Fukui, Y., et al. 1999, PASJ, 51, 745
- Gruendl & Chu (2008) Gruendl, R. A. & Chu, Y.-H. 2008, submitted to ApJS
- Henize (1956) Henize, K. G. 1956, ApJS, 2, 315
- Kim et al. (1999) Kim, S., Dopita, M. A., Staveley-Smith, L., & Bessell, M. S. 1999, AJ, 118, 2797
- Kim et al. (1998) Kim, S., et al. 1998, ApJ, 503, 674
- Kim et al. (2003) Kim, S., et al. 2003, ApJS, 148, 473
- Lucke & Hodge (1970) Lucke, P. B. & Hodge, P. W. 1970, AJ, 75, 171
- Meaburn (1980) Meaburn, J. 1980, MNRAS, 192, 365
- Meixner et al. (2006) Meixner, M., et al. 2006, AJ, 132, 2268
- Rieke et al. (2004) Rieke, G. H., et al. 2004, ApJS, 154, 25
- Smith & The MCELS Team (1999) Smith, R. C. & The MCELS Team. 1999, in IAU Symp. 190: New Views of the Magellanic Clouds, ed. Y.-H. Chu, N. Suntzeff, J. Hesser, & D. Bohlender, 28
- Walborn & Parker (1992) Walborn, N. R., & Parker, J. W. 1992, ApJ, 399, L87
- Yamaguchi et al. (2001a) Yamaguchi, R., Mizuno, N., Onishi, T., Mizuno, A., & Fukui, Y. 2001a, ApJ, 553, L185
- Yamaguchi et al. (2001b) —. 2001b, PASJ, 53, 959
- Yang et al. (2007) Yang, C.-C., Gruendl, R. A., Chu, Y.-H., Mac Low, M.-M., & Fukui, Y. 2007, ApJ, 671,374
- Zaritsky et al. (2004) Zaritsky, D., Harris, J., Thompson, I. B., & Grebel, E. K. 2004, AJ, 128, 1606