Mid-infrared imaging of 25 local AGN with VLT-VISIR ††thanks: Based on ESO observing programmes 075.B-0844(C) and 077.B-0137(A)
Abstract
Aims. High angular resolution N-band imaging is used to discern the torus of active galactic nuclei (AGN) from its environment in order to allow a comparison of its mid-infrared properties to the expectations of the unified scenario for AGN.
Methods. We present VLT-VISIR images of 25 low-redshift AGN of different Seyfert types, as well as N-band SEDs of 20 of them. In addition, we compare our results for 19 of them to Spitzer IRS spectra.
Results. We find that at a resolution of , all the nuclei of our observed sources are point-like, except for 2 objects whose extension is likely of instrumental origin. For 3 objects, however, we observed additional extended circumnuclear emission, even though our observational strategy was not designed to detect it. Comparison of the VISIR photometry and Spitzer spectrophotometry indicates that the latter is affected by extended emission in at least 7 out of 19 objects and the level of contamination is . In particular, the m silicate emission feature seen in the Spitzer spectra of 6 type I AGN, possibly 1 type II AGN and 2 LINERs, also probably originates not solely in the torus but also in extended regions.
Conclusions. Our results generally agree with the expectations from the unified scenario, while the relative weakness of the silicate feature supports clumpy torus models. Our VISIR data indicate that, for low-redshift AGN, a large fraction of Spitzer IRS spectra are contaminated by extended emission close to the AGN.
Key Words.:
galaxies: active – galaxies: nuclei – galaxies: Seyfert – Infrared: galaxies1 Introduction
The unification model for active galactic nuclei (AGN) interprets the different appearance of Seyfert 1 and Seyfert 2 galaxies uniquely as the result of an orientation effect (Antonucci 1993; Barthel 1994; Urry & Padovani 1996). The central engine is considered to be surrounded by an optically and geometrically thick molecular torus that appears as a grey body, mainly emitting in the infrared; the SED peaks around m in terms of energy emitted per unit wavelength. Therefore, one way to study the physical properties of the putative torus, is to observe AGN in the mid infrared (MIR) regime between m and m.
In recent years, this field progressed rapidly thanks to the arrival of powerful new instruments, mainly the Spitzer space telescope on one hand and high-resolution imagers and spectrographs at 10m-class telescopes (COMICS, LWS/LWIRC, Michelle, T-ReCS, VISIR) as well as the interferometric instrument MIDI on the other hand. Thus, it has become feasible to compare observations in detail to radiative transfer modelling of dusty tori (e.g. Schartmann et al. 2005; Hönig et al. 2006; Fritz et al. 2006) and constrain the geometry of the torus (e.g. Buchanan et al. 2006; Polletta et al. 2007; Treister et al. 2008) as well as test the applicability of the unified scenario in general (Haas et al. 2007).
In two recent publications, Horst et al. (2006, 2008), hereafter called Paper I and Paper II, respectively, we investigated the correlation between the mid-IR and hard X-ray luminosities in AGN and its implications for dusty torus models. To this end, we observed 25 local () AGN with the VISIR (Lagage et al. 2004) instrument at the VLT and found a highly significant correlation between their rest frame m and keV luminosities. Moreover, we found the luminosity ratio / to be independent of Seyfert type and luminosity, in agreement with the studies by Krabbe et al. (2001), Alonso-Herrero et al. (2002) and Lutz et al. (2004). Our sample has recently been expanded to 41 VISIR detections, including many Compton-thick AGN, by Gandhi et al. (2008).
In the present article, we present the mid-IR properties of this sample of objects in more detail. Typically, we achieved a spatial resolution of FWHM, corresponding to a resolved linear size ranging from 6 pc to 510 pc, depending on the distance of the objects. Since our main goal was to derive the luminosity of the central point source, our imaging is not very deep. In a few cases, however, we detected and resolved extra-nuclear emission.
For 20 of the presented objects, photometry in different N-band filters is available which enables us to reproduce the overall shape of the N-band SEDs of these objects. When possible, we compare our photometric data to spectra obtained with the IRS instrument (Houck et al. 2004) aboard Spitzer. While in many cases, Spitzer and VISIR data are in good agreement, in others they are not. We will discuss the possible consequences of such disagreements for the study of AGN tori with Spitzer data.
Throughout this paper we assume km s-1 Mpc-1, and (Spergel et al. 2006).
2 Observations and data analysis
Two samples of AGN were observed, one between April and August 2005 and the other one during the same period in 2006. Details on the target selection and observing conditions are given in Paper I for the first sample and Paper II for the second sample, respectively.
We used the standard imaging template of VISIR, with parallel chopping and nodding and a chop throw of . In order to get the best possible angular resolution, the small field objective ( / pixel) was used. Bright AGN were observed in three filters in order to allow a reconstruction of their spectral energy distribution (SED) in the MIR. Due to time constraints, faint objects could only be observed in one filter. All observations were executed in service mode with required observing conditions of clear sky and seeing or less. The average airmass was 1.15, with no observation being executed at an airmass above 1.3. Science targets and photometric standards were all observed within 2 h of each other and with a maximum difference in airmass of 0.25. For most observations, however, differences in both time and airmass are much smaller than these values. Some exposures had to be re-executed as the atmospheric conditions were not within specified constraints. In these cases, we only present the data obtained under the best conditions.
We reduced science and standard star frames using the pipeline written by Eric Pantin (private communication, also see Pantin 2008) for the VISIR consortium. To eliminate glitches, the pipeline applies a bad pixel mask and removes detector stripes. Subsequently, we removed background variations using a 2-dimensional, 6th degree polynomial fit. For objects observed in unstable conditions, we treated each nodding cycle separately as the background pattern sometimes changed between two consecutive cycles. The count rate for one full exposure was calculated as the mean of all 3 beams from all nodding cycles of this exposure. As an error estimate we use the standard deviation of these. In order to minimise the effect of residual sky background we chose relatively small apertures ( pixels ) for the photometry and corrected the obtained count rates using the radial profiles of standard stars. Finally, we calibrated our photometry using the same standard stars. The conversion factor counts/s / Jy proved to be very stable: for each individual filter, variations were less than 10 % rms over the whole observing period.
3 Results
In Table 1, we list the measured fluxes and resolved scales for each object and filter. The fluxes are reproduced from Paper I and Paper II. While in these papers, the resolved scales were computed for a fixed angular resolution of , we here use the actual size of the measured FWHM of the PSF. The scales are rounded to multiples of 5 pc, with the exception of Cen A; for this object the scale was rounded to 1 pc. As can be seen in the Table, the resolved scale varies from 6 pc (Cen A in SIV) to 510 pc (PG 2130+099 in NeII). We also state each object’s Seyfert type according to Véron-Cetty & Véron (2006). For peculiarities of individual objects, consult Paper II. Henceforth, we will denote Sy types 1, 1.2 and 1.5 as ’type I’ AGN, and Sy types 1.8, 1.9, 2.0 and 1h as ’type II’ AGN.
| Object | Sy type | Filter | [m] | Flux [mJy] | Scale [pc] |
|---|---|---|---|---|---|
| Fairall 9 | 1.2 | SIV | 10.49 | 310 | |
| Fairall 9 | 1.2 | NeIIref1 | 12.27 | 340 | |
| Fairall 9 | 1.2 | NeII | 12.81 | 340 | |
| NGC 526a | 1.9 | SIV | 10.49 | 115 | |
| NGC 526a | 1.9 | NeIIref1 | 12.27 | 135 | |
| Mrk 590 | 1.0 | SIV | 10.49 | 120 | |
| Mrk 590 | 1.0 | PAH2 | 11.25 | 135 | |
| Mrk 590 | 1.0 | NeII | 12.81 | 160 | |
| NGC 1097 | L | NeIIref1 | 12.27 | 30 | |
| NGC 3783 | 1.5 | SIV | 10.49 | 65 | |
| NGC 3783 | 1.5 | PAH2ref2 | 11.88 | 70 | |
| NGC 3783 | 1.5 | NeIIref1 | 12.27 | 70 | |
| NGC 4507 | 1h | SIV | 10.49 | 75 | |
| NGC 4507 | 1h | PAH2 | 11.25 | 75 | |
| NGC 4507 | 1h | NeIIref1 | 12.27 | 80 | |
| NGC 4579 | L | SIV | 10.49 | 32 | |
| NGC 4579 | L | PAH2ref2 | 11.88 | 29 | |
| NGC 4579 | L | NeIIref1 | 12.27 | 30 | |
| NGC 4593 | 1.0 | SIV | 10.49 | 60 | |
| NGC 4593 | 1.0 | PAH2ref2 | 11.88 | 60 | |
| NGC 4593 | 1.0 | NeIIref1 | 12.27 | 65 | |
| NGC 4941 | 2.0 | NeIIref1 | 12.27 | 30 | |
| IRAS 13197-1627 | 1h | SIV | 10.49 | 120 | |
| IRAS 13197-1627 | 1h | PAH2 | 11.25 | 125 | |
| IRAS 13197-1627 | 1h | NeIIref1 | 12.27 | 140 | |
| Cen A | 2.0 | SIV | 10.49 | 6 | |
| Cen A | 2.0 | PAH2 | 11.25 | 7 | |
| Cen A | 2.0 | NeIIref1 | 12.27 | 7 | |
| NGC 5135 | 2.0 | NeIIref1 | 12.27 | 95 | |
| MCG-06-30-015 | 1.5 | SIV | 10.49 | 50 | |
| MCG-06-30-015 | 1.5 | PAH2 | 11.25 | 50 | |
| MCG-06-30-015 | 1.5 | NeIIref1 | 12.27 | 55 | |
| NGC 5995 | 1.9 | SIV | 10.49 | 180 | |
| NGC 5995 | 1.9 | PAH2 | 11.25 | 180 | |
| NGC 5995 | 1.9 | NeII | 12.81 | 195 | |
| ESO 141-G55 | 1.0 | SIV | 10.49 | 255 | |
| ESO 141-G55 | 1.0 | PAH2 | 11.25 | 245 | |
| ESO 141-G55 | 1.0 | NeIIref1 | 12.27 | 220 | |
| Mrk 509 | 1.5 | SIV | 10.49 | 205 | |
| Mrk 509 | 1.5 | PAH2 | 11.25 | 210 | |
| Mrk 509 | 1.5 | NeII | 12.81 | 245 | |
| PKS 2048-57 | 1h | SIV | 10.49 | 85 | |
| PKS 2048-57 | 1h | PAH2 | 11.25 | 85 | |
| PKS 2048-57 | 1h | PAH2ref2 | 11.88 | 90 | |
| PKS 2048-57 | 1h | NeIIref1 | 12.27 | 90 | |
| PG 2130+099 | 1.5 | SIVref1 | 9.82 | 425 | |
| PG 2130+099 | 1.5 | PAH2 | 11.25 | 475 | |
| PG 2130+099 | 1.5 | NeII | 12.81 | 510 | |
| NGC 7172 | 2.0 | NeIIref1 | 12.27 | 60 | |
| NGC 7213 | L | SIV | 10.49 | 35 | |
| NGC 7213 | L | PAH2 | 11.25 | 40 | |
| NGC 7213 | L | NeIIref1 | 12.27 | 35 | |
| 3C 445 | 1.5 | SIV | 10.49 | 325 | |
| 3C 445 | 1.5 | PAH2 | 11.25 | 335 | |
| 3C 445 | 1.5 | NeII | 12.81 | 385 | |
| NGC 7314 | 1h | SIV | 10.49 | 35 | |
| NGC 7314 | 1h | PAH2 | 11.25 | 35 | |
| NGC 7469 | 1.5 | SIV | 10.49 | 120 | |
| NGC 7469 | 1.5 | PAH2 | 11.25 | 130 | |
| NGC 7469 | 1.5 | NeIIref1 | 12.27 | 115 | |
| NGC 7674 | 1h | NeII | 12.81 | 245 | |
| NGC 7679 | 1.9 | SIV | 10.49 | 90 | |
| NGC 7679 | 1.9 | PAH2 | 11.25 | 100 | |
| NGC 7679 | 1.9 | NeIIref1 | 12.27 | 135 |
3.1 Mid-IR properties
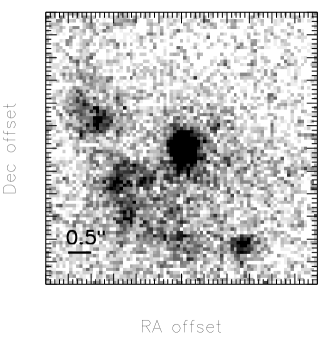
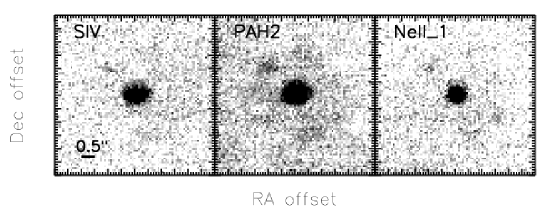
All recorded images are displayed in Figs. 1 to 6. First, we show the type I, type II and LINER AGN that do not exhibit extranuclear emission (Figs. 1, 2 and 3, respectively), then we show the three objects that do exhibit extranuclear emission, namely NGC 1097 (Fig. 4), NGC 5135 (Fig. 5) and NGC 7469 (Fig. 6). The images are linearly scaled. The minimum (white colour) is set to the mean background value . The maximum (black colour) is set to where is the standard deviation of the background.
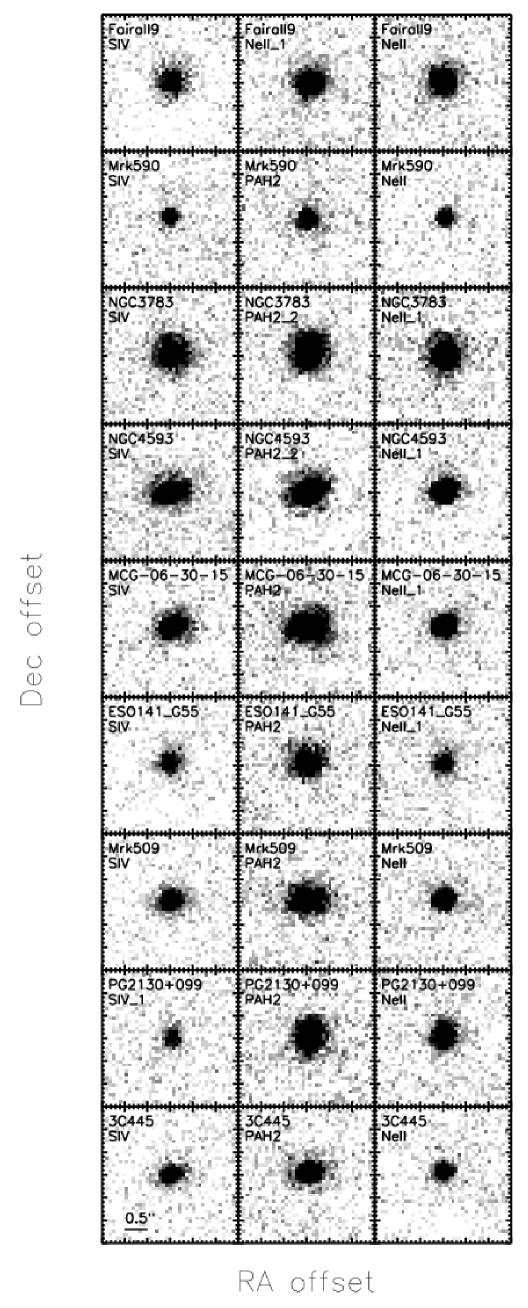
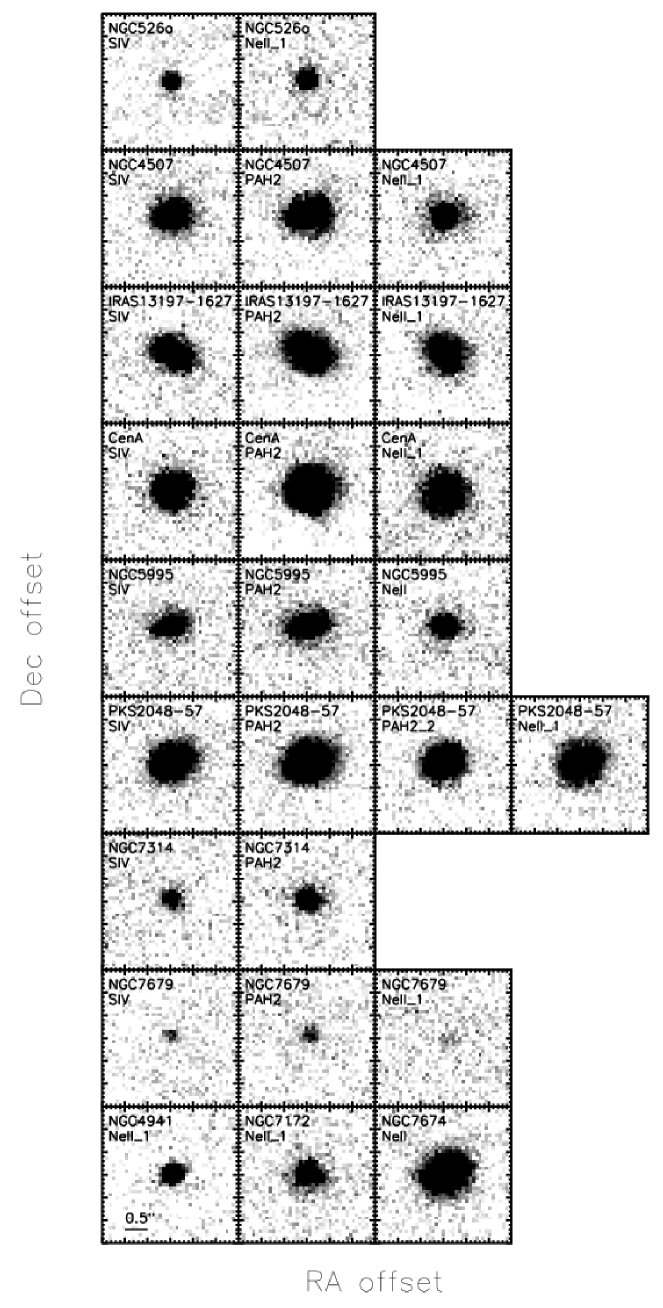
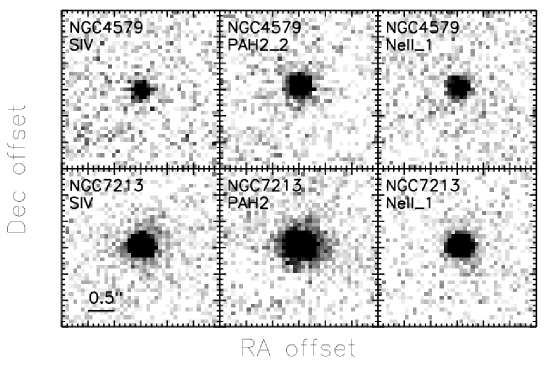
Most objects appear point-like and the torus remains unresolved in all cases. Refer to Table 2 in Paper I and Table 3 in Paper II for a comparison of object and standard star PSFs.
In some cases the observing conditions were good enough to provide us with diffraction limited imaging. In the images of NGC 3783 and NGC 4593 (third and fourth row, respectively, in Fig. 1), and NGC 4507 (second row in Fig. 2), we can see hints of the first Airy ring. It is also barely visible in a number of other images. Slight elongation of the central source is visible in IRAS 13197-1627 and NGC 5995 (third and fifth row, respectively, in Fig. 2). Extranuclear emission is observed in NGC 1097 (Fig. 4), NGC 5135 (Fig. 5) and NGC 7469 (Fig. 6). These objects will be discussed in more detail in subsection 3.2.
The slight elongation seen in the images of NGC 5995 and IRAS 13197-1627 is noteworthy. However, similar deformations of the PSF have been seen with VISIR even for standard stars. The reason for this effect is not known; one possibility is tilt anisoplanatism as described by Tokovinin et al. (2007). Since the instability of the PSF is a known problem with VISIR, we suspect that the elongation is caused by instrumental effects in both cases. These 2 objects do not belong to the “well resolved sources” sample defined in Paper II.
The spectral properties of the observed objects will be discussed in section 3.3. Please note that we only chose the NeII filter for objects which are sufficiently redshifted. Thus, our photometry is not affected by [NeII] line emission.
3.2 Morphologies of extranuclear emission
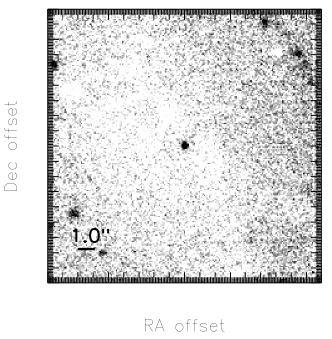
Three of the sources in our sample show extended extra-nuclear emission: NGC 1097, NGC 5135 and NGC 7469. In all three cases, we see distinct knots of star formation (SF) around the nucleus. Typical distances between SF knots and the AGN are ( pc) in NGC 1097, ( pc) in NGC 5135 and ( pc) in NGC 7469. In the latter two objects the proximity of the SF components to the AGN as well as the presence of a weak diffuse component does not allow us to rule out a significant contribution of SF to the measured flux of the central point source. We have estimated this contribution by assuming that the flux of the SF component on top of the AGN does not exceed the flux of the brightest distinct SF knot. In the NeIIref1 filter, we find that the contamination is at most 15 % for NGC 5135 and 10 % for NGC 7469 within the aperture used for the photometry.
The SF we observe in NGC 1097 (Fig. 4) is part of the well-known starburst ring of this galaxy. Unfortunately, when used with the small field objective, the VISIR field-of-view is too small to image the whole ring. Moreover, as the chop throw is of the same order of magnitude as the separation between the AGN and the SF regions, positive and negative images of different structures become intermingled. Therefore, we are not able to study the MIR properties of the starburst in NGC 1097.
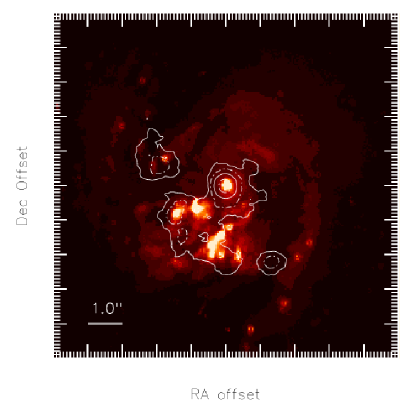
In NGC 5135, we see an arc of star formation at a distance of pc from the AGN. In Fig. 7, we show an overlay of optical and our MIR data. The optical image was taken with the WFPC2 instrument aboard the Hubble Space Telescope (HST), using the F606W filter. The MIR contours correspond to the NeIIref1 image, smoothed over 5 pixels. Alternating solid and dashed-dotted lines have been used for the contours in order to avoid confusion between different morphological features. For the relative astrometry, we matched the VISIR point source to the closest point-like source on the Hubble image. Assuming that the VISIR source is visible in the optical at all, the identification was unambiguous. Possible offsets of the mid-IR and optical, expected if torus and accretion disc are not aligned, are well below the resolution limit of both images.
The HST image shows the spiral structure of the host galaxy, with the AGN residing in the central bar. To the South, we find a very active SF region. Here, optical and mid-infrared morphologies are very similar. Two other MIR sources – one to the East and one to the Southwest of the nucleus, however, have only weak or no optical counterparts. In both cases, we likely see SF that is embedded in thick layers of dust. The dust absorbs the emission of the hidden young stars and thermally re-emits in the MIR regime. It is interesting to note that the region of SF is neither aligned to the spiral arms of the galaxy, nor does it show the characteristic ring-like structure often found around AGN.
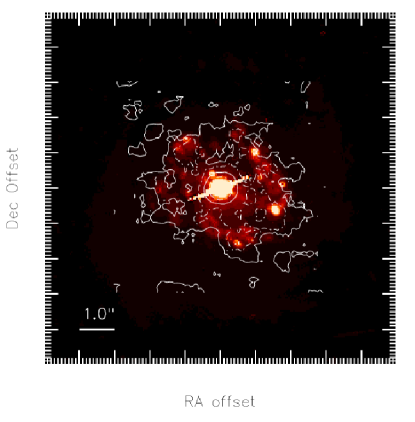
Such a ring of SF is found in NGC 7469 as can be seen in Fig. 8, where we show an overlay of an optical HST image and a VISIR NeIIref1 image. This overlay has been made in the same way as the one for NGC 5135. Again, we only find a partial coincidence of optical and MIR morphologies. Some of the less bright optical knots are strong MIR emitters, indicating SF covered by dust. It should be noted, however, that the S/N of the VISIR image in the starburst ring is rather low, not allowing for a detailed matching of morphological features.
For the two cases of NGC 5135 and NGC 7469, we find that within from the nucleus, SF contributes at least 43 % and 45 % of the total continuum flux in the NeIIref1 filter, respectively. These numbers can only be lower limits due to the observational limitations discussed above.
3.3 Comparison to Spitzer data
We have browsed the Spitzer science archive for low (spectral) resolution spectra of our sources, taken with the Infrared Spectrograph (IRS) aboard the Spitzer Space Telescope. With its 85 cm mirror, the angular resolution of Spitzer is about 10 times less than the one of the VLT. On the other hand, space-borne IR observatories are superior in terms of sensitivity and spectral coverage.
The IRS spectra allow us to look for mid-infrared emission lines and compare the spectral shapes and flux levels of our data to the spatially less resolved Spitzer observations. To this end, we downloaded reduced data and extracted the spectra with SPICE 2.0.4, using the “point source with regular extract” generic template. The absolute flux calibration was done by matching the automatic flux calibration SPICE provides for the overlapping parts of different spectral settings. With this method, we achieved an absolute flux uncertainty of mJy. Especially large discrepancies between different spectral settings were found for Cen A, MCG-06-30-15 and NGC 3783. For NGC 4579 and NGC 5995, the Spitzer science archive contains only observations made in one spectral setting as of November 2007.
| Object | SIVref1 | SIV | PAH2 | PAH2ref2 | NeIIref1 | NeII | ||||||
|---|---|---|---|---|---|---|---|---|---|---|---|---|
| [mJy] | [] | [mJy] | [] | [mJy] | [] | [mJy] | [] | [mJy] | [] | [mJy] | [] | |
| Fairall 9 | – | 5.58 | 3.16 | – | – | 29.65 | 2.86 | 38.44 | 2.95 | |||
| NGC 526a | – | -29.19 | 1.14 | – | – | -47.20 | -0.86 | – | ||||
| Mrk 590 | – | 60.98 | 2.92 | – | 80.81 (0.52) | 38.53 | – | 67.56 (0.61) | 5.20 | |||
| NGC 3783 | – | -37.61 | 0.81 | – | 15.28 | 0.70 | -47.38 | 0.70 | – | |||
| NGC 4507 | – | -44.11 | 1.25 | -52.00 | 1.69 | – | -60.85 | 1.31 | – | |||
| NGC 4579 | – | 31.84 | 1.84 | – | 51.34 (0.43) | 3.71 | 66.09 (0.52) | 3.21 | – | |||
| NGC 4593 | – | 31.71 | 1.10 | – | 70.20 | 2.69 | 29.58 | 0.40 | – | |||
| IRAS 13197-1627 | – | 28.19 | 1.65 | 43.39 | 1.21 | – | -9.82 | 0.21 | – | |||
| Cen A | – | 193.77 (0.23) | 7.28 | 418.28 (0.30) | 14.32 | – | 421.32 (0.23) | 5.76 | – | |||
| MCG-06-30-15 | – | 61.00 (0.85) | 4.42 | 35.04 | 1.27 | – | 43.19 | 0.95 | – | |||
| NGC 5995 | – | -37.18 | 1.23 | -10.03 | 0.21 | – | – | -38.59 | 0.64 | |||
| Mrk 509 | – | 34.36 | 4.48 | 69.53 (0.23) | 3.25 | – | – | 86.67 | 2.08 | |||
| PKS 2048-57 | – | -56.27 | 2.04 | -15.72 | 0.35 | -32.17 | 0.61 | -118.73 | 1.86 | – | ||
| PG 2130+099 | 11.88 | 0.49 | – | 3.80 | 0.48 | – | – | 9.49 | 0.31 | |||
| NGC 7213 | – | 4.92 | 0.79 | 56.49 | 1.47 | – | 29.29 | 1.11 | – | |||
| 3C 445 | – | -0.72 | 0.10 | 14.01 | 1.40 | – | – | 21.60 | 0.77 | |||
| NGC 7314 | – | 2.69 | 0.07 | 28.38 | 1.29 | – | – | – | ||||
| NGC 7469 | – | 133.69 (0.23) | 6.68 | 430.58 (0.47) | 11.15 | – | 373.48 (0.37) | 10.76 | – | |||
| NGC 7679 | – | 71.89 (0.63) | 5.53 | 212.38 (0.83) | 32.18 | – | 193.70 (0.81) | 10.58 | – | |||
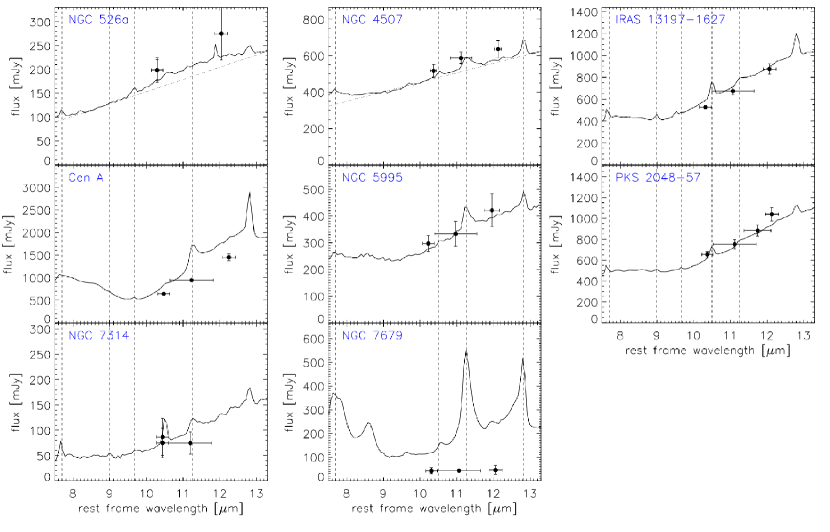
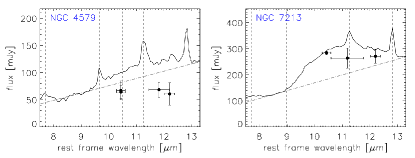
In figs. 9, 10 and 11, we show IRS spectra and our VISIR photometry for all objects which we had observed in two or more different filters and for which IRS spectra were publicly available. We compare Spitzer and VISIR data of 9 type I AGN (Fig. 9), 8 type II AGN (Fig. 10) and 2 LINERs (Fig. 11). The wavelength scale in all panels is in rest-frame, vertical dashed lines depict the positions of common mid-infrared emission lines: m PAH, m [ArIII], m H2 (0-0)S3, m [SIV], m PAH and m [NeII], in some cases blended with m PAH. In order to increase the visibility of the silicate emission feature, we also plot a linear interpolation (dashed-dotted line) with anchor points at m and m for every object that might exhibit the feature (meant to roughly depict source continuum). In Table 2, we then show the difference between IRS and VISIR fluxes, both in absolute and relative units. To compare both flux measurements, the IRS fluxes were integrated over the width of the according VISIR filter. We then find 7 out of 19 objects to exhibit a flux difference of more than and more than 50 mJy, in at least one filter. In no case do we find a VISIR flux larger at more than and more than 50 mJy than the Spitzer IRS flux.
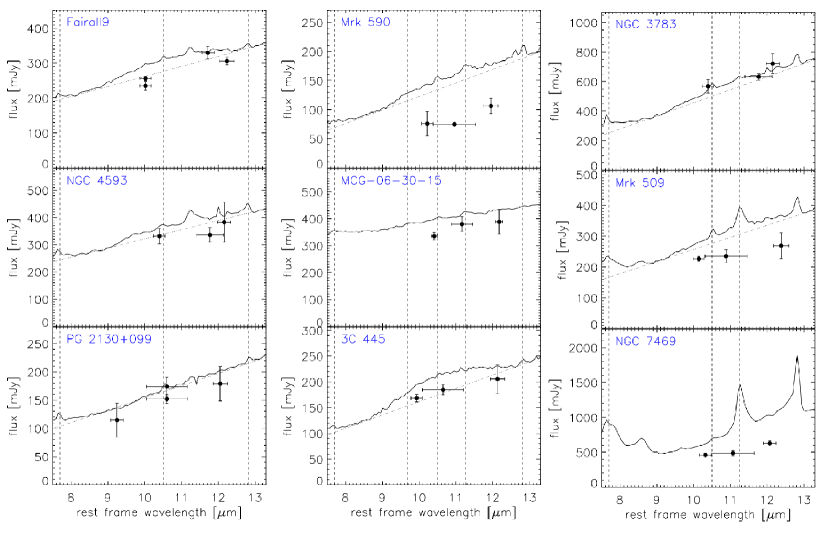
Among the type I AGN, we find a relatively good agreement between Spitzer and VISIR data, despite the difference in resolution. The flux level is in significant disagreement for Mrk 590, MCG-06-30-15, Mrk 509 and NGC 7469. Presumably, in these cases the IRS spectra contain contribution from SF around the nucleus. In NGC 7469, Spitzer is not able to resolve the SF ring we see with VISIR. The strong PAH and [NeII] emission lines in this object indicate the strong contribution of SF to the measured flux. Moreover, the flux discrepancy found is in good agreement with SF flux we estimated from our VISIR data in section 3.2. In no case do we find a VISIR flux larger than the Spitzer one. In a number of other objects, Spitzer reveals the presence of H2, PAH and [NeII] emission lines. In addition, the m silicate emission feature is present in the spectra of Fairall 9, Mrk 590, NGC 3783,NGC 4593, Mrk 509 and 3C 445. As has been observed earlier by Hao et al. (2005); Siebenmorgen et al. (2005) and Sturm et al. (2005), the centre of the feature is shifted redward to m.
For our type II sources, the IRS spectra show emission lines in every object. Especially remarkable is the spectrum of NGC 7679 which resembles the one of a starburst galaxy rather than an AGN. The VISIR photometry, however, does not appear to be significantly affected by SF as we do not find any indication for the presence of the m PAH line which is very strong in the IRS spectrum. The m silicate absorption feature is present in the spectra of IRAS 13197-1627, Cen A, NGC 5995, PKS 2048-57 and NGC 7314. Interestingly, NGC 526a may show the feature in emission rather than absorption. It is absent in NGC 4507 and the starburst-like spectrum of NGC 7679. Please note that in case of NGC 4507, a re-examination of the Spitzer data set has shown that this observation was slightly mis-pointed (M. Haas, private communication). Thus, the actual nuclear spectral shape might be different than shown in Fig. 10. This would also explain why the VISIR fluxes are slightly larger than the IRS ones. It seems possible that the same has happened for PKS 2048-57 and NGC 526a for which the fluxes measured with VISIR are slightly – but not significantly – larger than the ones observed with IRS, as well.
The two LINERs in our sample appear quite differently in VISIR and Spitzer observations. The IRS spectrum of NGC 4579 shows a rising continuum toward the red and a silicate emission feature while the VISIR measurements show a flat continuum. The strong [ArIII], PAH and [NeII] lines indicate the presence of active SF. Cold dust in the outer parts of a deeply embedded SF region could also explain the red continuum colour. In the case of NGC 7213, the continuum levels measured with VISIR and Spitzer are in agreement with each other. In the IRS spectrum, a silicate emission feature is superimposed onto the strong rise toward longer wavelengths. This feature appears to be absent in the VISIR photometry.
While a quantitative analysis of the difference in flux between IRS spectra and VISIR photometry is difficult due to the lacking accuracy of the absolute flux calibration we have performed on the IRS data, we do find that in at least 7 cases, the disagreement is significant. In these cases, between cannot be accounted for with VISIR and, thus, very likely originates in circumnuclear SF or other extra-nuclear phenomena. Interestingly, we do not find a clear dependence of the discrepancy between VISIR and IRS fluxes on the scale we resolve with VISIR, in terms of the dust sublimation radius.
The cases of Mrk 590 and MCG-06-30-15 are of particular interest in this respect as the IRS spectra of these objects do not exhibit strong emission lines indicative of star formation (i.e. PAH, [NeII]). This means that the absence of such lines does not necessarily imply a spectrum to be free of contaminating, extra-nuclear emission.
4 Discussion
4.1 Extended emission
The strength of the extended MIR emission in NGC 5135 (Fig. 5) and NGC 7469 (Fig. 6) illustrates the importance of high angular resolution for AGN studies that has been discussed in Paper II. This point is also demonstrated by the difference in flux level we see between VISIR and Spitzer observations of some of our targets. Moreover, Mrk 590 and MCG-06-30-15 indicate that significant contamination by circumnuclear emission can be present in MIR data even when IR emission lines are weak. Therefore, satellite IR data of AGN should be treated with care when directly compared to torus models.
4.2 The silicate emission feature in Seyfert AGN
As we have seen in section 3.3, 6 out of 9 type I AGN displayed in Fig. 9 show the m silicate feature in emission. Thus, silicate emission seems to be quite common in type I AGN of moderate luminosities, contrary to suggestions they may only be pronounced in QSOs (Siebenmorgen et al. 2005). Furthermore, within our limited sample statistics, we do not find a clear trend of more luminous AGN to exhibit stronger silicate features. Although the most luminous object shown in Fig. 9 – 3C 445 – also exhibits the strongest silicate emission feature, there seems to be no trend for the rest of the sample. Also note that PG 2130+099 does not show the feature at all while the less luminous objects Mrk 590, NGC 3783 and NGC 4593 do (see Paper II, for the luminosities).
While we find silicate emission to be common among type I Seyferts, the features are generally weak. Comparing this result to radiative transfer calculations of different torus models indicates that the dust is distributed in clumps rather than smoothly (see e.g. Nenkova et al. 2002; Hönig et al. 2006).
In addition to type I AGN, we see the silicate emission feature in the LINERs NGC 4579 and NGC 7213. This is another indication that the strength of the feature is not correlated to AGN luminosity. Most remarkable is the possible presence of a silicate emission feature in the type II AGN NGC 526a. This adds to the observations of silicate emission in luminous type II QSOs by Sturm et al. (2006) and Teplitz et al. (2006). Smooth torus models, on the other hand, predict type II AGN to only show the feature in absorption and not in emission.
In Paper II, we discussed the relevance of high angular resolution when AGN torus models are compared to mid-infrared observations. The comparison between our VISIR data and archival Spitzer data reveals another problem with low angular resolution studies of AGN: For some objects – NGC 4579 and NGC 7213 – the strength of silicate feature strongly depends on the resolved scale.
Recently, Schweitzer et al. (2008) discussed NLR dust clouds as the possible main source of the silicate emission feature in PG QSOs. They find that the average distance of these dust clouds to the AGN is where is the dust sublimation radius. This effect can explain both the presence of silicate emission in type II AGN such as NGC 526a and the difference in silicate feature strength between IRS and VISIR data. NGC 4579 and NGC 7213 have PSF sizes of and , respectively. Nevertheless, this could mean that for objects with very extended cloud distributions, we start to resolve these with VISIR and thus see a difference in feature strength between VISIR and Spitzer, while we fail to resolve the cloud distribution for objects with .
Neither the results of Schweitzer et al. (2008) nor our own rule out additional silicate emission from the torus itself. As the emission features seen in Fig. 9 are weak to begin with, however, the torus emission has to be low, especially when compared to prominent silicate absorption features as in e.g. Cen A or NGC 5995. The weakness of the feature is a strong argument in favour of clumpy torus models since these predict a less pronounced feature than smooth ones (see Nenkova et al. 2002; Hönig et al. 2006).
4.3 Effect of the silicate feature on our continuum photometry
In Paper II, we claimed that our measured m fluxes were not affected by the silicate feature. Despite its presence in many objects, this claim still holds. In the VISIR photometry of all type I sources, the feature is either absent or weak – even in the latter case, at m the possible contamination is below 10%. For the type II sources, the error induced by the silicate feature is slightly larger and may may amount to roughly 10% in IRAS 13197-1627 and Cen A. The only object for which we may have induced a larger error than that is NGC 7314. This will still not significantly affect the results derived in that work.
5 Conclusions
We present MIR images of 25 local AGN, obtained with VISIR at the VLT with resolution. We found two of the objects to be slightly extended – most likely due to an instrumental effect – and three to exhibit extra-nuclear emission in addition to the central point source. We identify this emission with regions of intensive star formation.
For 20 AGN, we were able to reconstruct their N-band SEDs; we find that about half of the type I AGN exhibit a silicate emission feature at m. The relative weakness of the feature and the fact that it is not present in all type I sources gives support to models of clumpy tori (Nenkova et al. 2002; Dullemond & van Bemmel 2005; Hönig et al. 2006). This matches our conclusions from Paper II.
Furthermore, by comparing our data to Spitzer IRS spectra, in three objects we find indications for the silicate emission feature to originate in an extended region. This as well as the detection of silicate emission in the type II AGN NGC 526a supports the results by Schweitzer et al. (2008) that the bulk of silicate emission may be emitted from dust clouds in the NLR rather than the obscuring torus.
The comparison with Spitzer spectra also reveals a significant offset in flux level between VISIR and IRS data in at least 7 out of 19 objects. Here, we find the contamination to be of the order of . This indicates the presence of extra-nuclear MIR emission on scales of several tens to hundreds of parsecs and underlines the need for high angular resolution in MIR studies of AGN. The cases of Mrk 590 and MCG-06-30-15 show that even objects without strong emission lines can suffer from contamination.
Acknowledgements.
We thank Dr. Eric Pantin for kindly providing us with his VISIR pipeline. We are indebted to an anonymous referee who greatly helped to improve the manuscript. H.H. acknowledges support from DFG through SFB 439. P.G. is a Fellow of the Japan Society for the Promotion of Science (JSPS). This research made use of the NASA/IPAC Extragalactic Database (NED) which is operated by the Jet Propulsion Laboratory, California Institute of Technology, under contract with the National Aeronautics and Space Administration. We acknowledge the usage of the HyperLeda database (http://leda.univ-lyon1.fr).References
- Alonso-Herrero et al. (2002) Alonso-Herrero, A., Ivanov, V. D., Jayawardhana, R., & Hosokawa, T. 2002, ApJ, 571, L1
- Antonucci (1993) Antonucci, R. 1993, ARA&A, 31, 473
- Barthel (1994) Barthel, P. D. 1994, in The First Stromlo Symposium: The Physics of Active Galaxies, ed. G. V. Bicknell, M. Dopita, & P. Quinn, Vol. 54, 175–186
- Buchanan et al. (2006) Buchanan, C. L., Gallimore, J. F., O’Dea, C. P., et al. 2006, AJ, 132, 401
- Dullemond & van Bemmel (2005) Dullemond, C. P. & van Bemmel, I. M. 2005, A&A, 436, 47
- Fritz et al. (2006) Fritz, J., Franceschini, A., & Hatziminaoglou, E. 2006, MNRAS, 366, 767
- Gandhi et al. (2008) Gandhi, P., Horst, H., Smette, A., et al. 2008, A&A, submitted
- Haas et al. (2007) Haas, M., Siebenmorgen, R., Pantin, E., et al. 2007, A&A, 473, 369
- Hao et al. (2005) Hao, L., Spoon, H. W. W., Sloan, G. C., et al. 2005, ApJ, 625, L75
- Hönig et al. (2006) Hönig, S. F., Beckert, T., Ohnaka, K., & Weigelt, G. 2006, A&A, 452, 459
- Horst et al. (2008) Horst, H., Gandhi, P., Smette, A., & Duschl, W. J. 2008, A&A, 479, 389
- Horst et al. (2006) Horst, H., Smette, A., Gandhi, P., & Duschl, W. J. 2006, A&A, 457, L17
- Houck et al. (2004) Houck, J. R., Roellig, T. L., van Cleve, J., et al. 2004, ApJS, 154, 18
- Krabbe et al. (2001) Krabbe, A., Böker, T., & Maiolino, R. 2001, ApJ, 557, 626
- Lagage et al. (2004) Lagage, P. O., Pel, J. W., Authier, M., et al. 2004, The Messenger, 117, 12
- Lutz et al. (2004) Lutz, D., Maiolino, R., Spoon, H. W. W., & Moorwood, A. F. M. 2004, A&A, 418, 465
- Nenkova et al. (2002) Nenkova, M., Ivezic, Z., & Elitzur, M. 2002, ApJ, 570, L9
- Pantin (2008) Pantin, E. 2008, in The 2007 ESO Instrument Calibration Workshop. Proceedings of the ESO Workshop held in Garching, Germany, 23-26 January 2007, ed. A. Kaufer & F. Kerber, ESO Astrophysics Symposia, 119–129
- Polletta et al. (2007) Polletta, M., Weedman, D., Hoenig, S., et al. 2007, ApJ, 675, 960
- Schartmann et al. (2005) Schartmann, M., Meisenheimer, K., Camenzind, M., Wolf, S., & Henning, T. 2005, A&A, 437, 861
- Schweitzer et al. (2008) Schweitzer, M., Groves, B., Netzer, H., et al. 2008, ApJ, 679, 101
- Siebenmorgen et al. (2005) Siebenmorgen, R., Haas, M., Krügel, E., & Schulz, B. 2005, A&A, 436, L5
- Spergel et al. (2006) Spergel, D. N., Bean, R., Doré, O., et al. 2006, ApJS, 170, 377
- Sturm et al. (2006) Sturm, E., Hasinger, G., Lehmann, I., et al. 2006, ApJ, 642, 81
- Sturm et al. (2005) Sturm, E., Schweitzer, M., Contursi, A., et al. 2005, ApJ, 629, L21
- Teplitz et al. (2006) Teplitz, H. I., Armus, L., Soifer, B. T., et al. 2006, ApJ, 638, L1
- Tokovinin et al. (2007) Tokovinin, A., Sarazin, M., & Smette, A. 2007, MNRAS, 378, 701
- Treister et al. (2008) Treister, E., Krolik, J. H., & Dullemond, C. 2008, ApJ, 679, 140
- Urry & Padovani (1996) Urry, C. M. & Padovani, P. 1996, PASP, 107, 803
- Véron-Cetty & Véron (2006) Véron-Cetty, M.-P. & Véron, P. 2006, A&A, 455, 773