Fundamental statistical features and self-similar properties of tagged networks
Abstract
We investigate the fundamental statistical features of tagged (or annotated) networks having a rich variety of attributes associated with their nodes. Tags (attributes, annotations, properties, features, etc.) provide essential information about the entity represented by a given node, thus, taking them into account represents a significant step towards a more complete description of the structure of large complex systems. Our main goal here is to uncover the relations between the statistical properties of the node tags and those of the graph topology. In order to better characterise the networks with tagged nodes, we introduce a number of new notions, including tag-assortativity (relating link probability to node similarity), and new quantities, such as node uniqueness (measuring how rarely the tags of a node occur in the network) and tag-assortativity exponent. We apply our approach to three large networks representing very different domains of complex systems. A number of the tag related quantities display analogous behaviour (e.g., the networks we studied are tag-assortative, indicating possible universal aspects of tags versus topology), while some other features, such as the distribution of the node uniqueness, show variability from network to network allowing for pin-pointing large scale specific features of real-world complex networks. We also find that for each network the topology and the tag distribution are scale invariant, and this self-similar property of the networks can be well characterised by the tag-assortativity exponent, which is specific to each system.
pacs:
02.70.Rr, 05.10.-a, 87.16.Yc, 89.20.-a, 89.75.Hc1 Introduction
Many complex systems in nature and society can be successfully represented in terms of networks capturing the intricate web of connections among the units they are made of [1, 2]. In the recent years, the research in this field have been focused mainly on the topology of the graphs corresponding to these real networks. Since this approach is rooted in, among others, statistical physics, where often the thermodynamic limit is considered and also the size of the known nets is becoming huge, several large-scale properties of real-world webs have been uncovered, e.g., a low average distance combined with a high average clustering coefficient [3], the broad (scale-free) distribution of node degree (number of links of a node) [4, 5, 6, 7] and various signatures of hierarchical/modular organisation [8, 9].
On the other hand, there has been a quickly growing interest in the local structural units of networks. Small and well defined sub-graphs consisting of a few vertices have been introduced as motifs [10, 11], whereas somewhat larger units, associated with more highly interconnected parts [12, 13, 14, 15, 16, 17, 18, 19, 20, 21, 22, 23, 24, 25, 26] are usually called communities, clusters, cohesive groups, or modules. These structural sub-units can correspond to multi-protein functional units in molecular biology [8, 27], a set of tightly coupled stocks or industrial sectors in economy [28, 29], groups of people [19, 30, 31], cooperative players [32, 33, 34], etc. The location of such building blocks can be crucial to the understanding of the structural and functional properties of the systems under investigation.
The majority of the complex network studies concern “bare” graphs corresponding to a simple list of connections between the nodes, or at most weighted networks where a connection strength (or intensity) is associated to the links. However, the introduction of node tags (also called as attributes, annotations, properties, categories, features) leads to a richer structure, opening up the possibility for a more comprehensive analysis of the systems under investigation. These tags can correspond to basically any information about the nodes and in most cases a single node can have several tags at the same time. The use of such annotations in biological networks is a common practice [35, 36, 37, 38, 39, 40], where the tags usually refer to the biological function of the units (proteins, genes, etc.). Another interesting application of node features can be seen in the studies of co-evolving network models, where the evolution of the network topology affects the node properties and vice versa [41, 42, 43, 44, 45, 46, 47, 48, 49, 50]. These models are aimed at describing the dynamics of social networks, in which people with similar opinion are assumed to form ties more easily, and the opinion of connected people becomes more similar in time. Finally, we mention the study of collaborative tagging in Ref.[51], where tripartite networks were constructed from data concerning users who associated tags to some kind of items, (such as music listeners classifying music records). The three types of nodes corresponded to the users, the tags, and the items. The tagging was carried out without any central authority and according to the results, the analysis of the bi- and unipartite projection of the networks can help in structuring the contents (e.g., define a hierarchy between the tags).
In this paper we study tagged networks from yet another point of view. Our focus is on networks where the links are in principle not related to tagging, however tags can be associated with the nodes quite naturally. The PACS numbers or key-words in case of co-authorship networks, the scope of business or the industrial sector of companies in the context of financial networks, or the status of employees in the case of a network representing the social ties inside a large firm provide plausible examples for possible tags. The complexity of the networks studied these days is rapidly increasing together with their size. The use of tags associated with the nodes can help in revealing hidden structures or fasten searching within the networks. Since the usefulness of such attributes has already been proven in biology, the inclusion of tags in the analysis of other networks as well is expected to give a deeper understanding of the interrelations shaping the structure and dynamics of the systems under study.
Along this line, in the present paper we study the fundamental statistics characterising the distribution of tags in large annotated real networks. By choosing networks representing completely unrelated systems (a co-authorship network, a protein interaction network, and the English Wikipedia), we seek for signs of universality in these statistics. Furthermore, we are interested in the relations between the network topology and the distribution of tags. The tags enable the definition of a similarity function between the nodes which is a priori independent of the topology. We shall refer to this quantity as the tag-similarity of the nodes in order to distinguish it from the usual structural similarity of the nodes (based on the similarity between the nearest neighbours). The study of the tag-similarity opens up further directions for exploring the intricate relations between the annotations and the graph structure itself. Interestingly, in all selected systems, the tags form a sort of taxonomy: they correspond to features ranging from very specific to rather general ones, which are embedded in a hierarchic structure held together by “is a sub-category of” type relations. This inter-relatedness of the tags adds an extra twist to the definition of the quantities we study.
The paper is organised as follows. In Sect.2. we define the most important quantities we aim to study, whereas the construction of the investigated networks (and the hierarchy of the corresponding node labels) is detailed in Sect.3. The results are presented in Sect.4 and we close the paper with with some concluding remarks in Sect.5.
2 Definitions
2.1 Basic statistics
2.1.1 Number of tags on a node
In principle, nodes in a network can be tagged with almost anything. Here we list a few basic types followed by particular examples in parenthesis: real numbers (the accumulated impact factors of authors in a co-authorship network), integers (the number of articles of an author), or character strings (functions of proteins in a protein-protein interaction network). However, in most cases, (including the systems we study in the present paper), the node attributes correspond to character strings, chosen from a finite set of possible tags. Usually a node can have more than one tag attached to it, e.g., numerous proteins appearing in a protein-protein interaction (PPI) network have multiple functions. One of the basic statistics about the annotations is the distribution of the number of tags on the nodes.
2.1.2 Tag frequencies
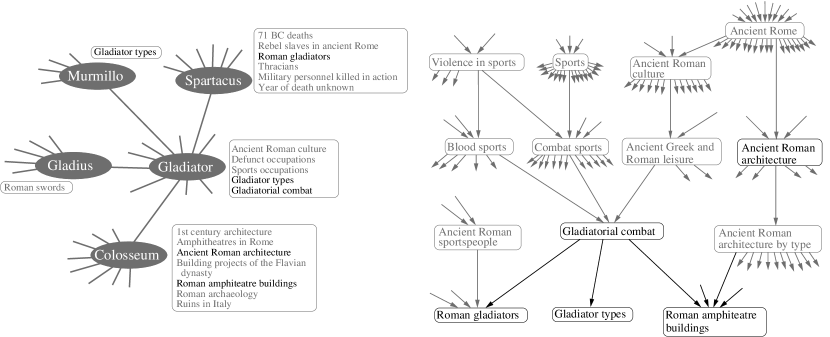
Similarly to the varying number of tags on the nodes, the frequency of the different tags can also be rather heterogeneous. What makes the picture even more complex is that in many cases the tags refer to categories of a taxonomy or ontology (capturing the view of a certain domain, e.g., protein functions). This means that the tags are organised into a structure of relationships which can be represented by a directed acyclic graph (DAG), where the directed links between two categories represent an “is a sub-category of” relation. The nodes close to the root in the DAG are usually related to general properties, and as we follow the links towards the leafs, the categories become more and more specific. In some cases we can find categories in the DAG with more than one in-neighbours, meaning that the given sub-category is part of more than one categories (that are not parts of one another). Also note that nodes can be classified not only by the leaf-categories e.g., several proteins in a PPI network can be found with rather general functional descriptions. We illustrate the concept of tagged networks and the corresponding DAG of categories in Fig.1. with the help of the English Wikipedia.
Given the DAG between the possible tags, we can define the frequency of a given tag in two different ways:
| (1a) | |||||
| (1b) | |||||
where denotes the number of nodes tagged with , stands for the number of nodes tagged with or any of its descendents, and is equal to the total number of nodes in the network. From these definitions it follows that when the number of un-tagged nodes is zero, the root of the annotation DAG will receive , whereas for the leaf categories . Furthermore, if category is a descendent of , then . Low frequency tags are more specific in an information theoretical sense, whereas high frequency tags carry almost no information (e.g., being tagged by the root in the annotation DAG adds absolutely no information to the description of a node).
In the following, we shall refer to the sub-graph induced by the nodes (i.e. constituted by these nodes and all links between them) marked by the tag and any of its descendents as the tag-induced sub-graph of . The number of nodes in this sub-graph is given by , whereas the number of links can vary between and . It is interesting to compare to the number of links one would expect in a random sub-graph of the same size: if is significantly larger/smaller than , then nodes sharing the tag attract/repel each other in the sense that they are linked with higher/smaller probability than at random.
2.2 Tag-similarity
Our aim in this section is to define a similarity function between the nodes which is based solely on the tags, therefore, it can be evaluated without any knowledge about the graph structure. Although we refer to this quantity as the tag-similarity of the nodes in general, we shall use the term similarity in the same sense for short.
2.2.1 Simple similarity measures
To what extent two nodes and having a set of tags and are similar is a question far from trivial, as the number of possible similarity measures is vast. A simple approach is to use the Jaccard-similarity [52] defined as
| (1b) |
where is equal to the number of common tags and is equal to the total number of different tags in and . Another possibility is to represent the annotations as vectors and , where the number of entries in the vectors is equal to the number of different tags in the network, and the non-zero elements indicate the presence (or possibly the weight) of the actual tags on the given node. In this approach the cosine similarity
| (1c) |
yields a simple similarity value for a pair of nodes and .
The advantage of the above methods is that they do not depend on the DAG between the tags, therefore, they can be applied even when the tags are not part of a structured taxonomy. However, when a tag refers to a sub-category of another tag, the similarity measure should be refined. As an example, let us assume that node is tagged exclusively with category , and node has a single tag , that is a direct descendent of (e.g., ”knife” and ”kitchen knife”). In this case both (1b) and (1c) yield , which is not what we would expect.
2.2.2 Semantic similarities
To overcome the problem raised above, we should use a similarity measure which takes into account the structure of the annotation DAG. At this point we divide the evaluation of similarity into two parts: first we deal with the similarity between a pair of tags, then elaborate on how to combine the pairwise similarities between the sets of tags , associated with a pair of nodes and to obtain .
A simple choice for determining the similarity between two tags is the length of the longest shared path towards the root of the annotation DAG. A somewhat more sophisticated approach is to use semantic similarities. The basic idea behind these methods is to take into account the frequency of the tags: sharing a rare tag by two nodes should indicate high similarity, whereas sharing a frequent tag should not. The semantic similarity between tags and derived by Resnik [53] as
| (1d) |
where denotes the set of common ancestors of , and corresponds to the information content of category . From this definition it follows that if is a descendent of , then , and when the two compared tags are not connected by a directed path, then is equal to the information content of one of their nearest common ancestors. A closely related similarity measure was proposed by Lin [54] as
| (1e) |
In practice (1e) was reported to slightly under perform (1d) [55], however the big advantage of (1e) is that becomes bounded in . The maximal possible obtained from (1d) depends on the frequency of the rarest tag, which in our case is strongly varying from system to system. For this reason, we shall use (1e) for calculating the similarity between categories.
When moving from the similarity of tags to the similarity of nodes, again we have a number of possibilities to choose from. A simple approach is to use the average of the pairwise similarities as
| (1f) |
where and denote the number of tags on node and respectively. The problem with the expression above is that if the labels associated with a given node are very different from each other, then by comparing this node even to itself, the “cross-terms” reduce the similarity value. A simple solution is to replace the average in (1f) by the maximal pairwise similarity amongst the tags:
| (1g) |
Another possibility along this line is to organise the pairwise similarities between the tags into an by matrix, and define the quantities and as the average of the maximal values in the rows and columns of this matrix respectively. The similarity between the two annotation vectors can then be given as either the average or the maximum of and [56]. In our studies we shall use (1g) due to its computational simplicity and the fact that it is analogous to the concept of minimum linkage clustering, where the distance between two sets of elements (the tags) is defined as the minimum pairwise distance between the elements.
2.3 Tag-assortativity
A plausible hypothesis about tagged real networks is that links are likely to form ties between similar nodes and vice versa, we expect connected nodes to share common tags with enhanced probability. However, this property is not evident in all cases. E.g., if we colour the nodes in a network according to the famous vertex colouring problem [57], (namely we seek for the minimal number of colours which can be distributed in such a way that no neighbours have the same colour), and identify the node colours as the tags, then similar nodes are actually never connected.
In general, the property that nodes are more frequently connected to others that are similar/different in some quality is referred to as assortativity/disassortativity. The most typically considered quality – which is based on the network’s topology – is the degree of the nodes. In tagged networks, however, another natural way of comparing nodes can be based on the above defined tag-similarity. We can thus introduce the notion of tag-assortativity (to distinguish this property from the degree-assortativity), and call a network tag-assortative/tag-disassortative if nodes having similar tags are linked with higher/lower probability than at random.
2.4 Uniqueness
Interestingly it is not uncommon to find tags associated with the same node which are rather different from each other, e.g., in the PPI network studied in this paper more than 10% of the nodes have at least one pair of tags for which the nearest common ancestor is actually the root of the annotation DAG. This means that the given protein can take part in very different biological processes. On the other hand, many nodes have more or less similar categories in their annotation, so they take part in more or less similar processes.
To quantify the above aspect, we introduce the node uniqueness, defined as
| (1h) |
In principle, we could have chosen rather than in the definition above. However, since for every , if node has only a single tag, then would be unity independent of whether this tag is frequent or not. By using the the Resnik-similarity (1d) for which , we can differentiate between nodes with single tags as well, based on the tag frequencies. The lowest possible value for occurs in the case where a node belongs to more than one categories, out of which at least two have the root of the DAG as their nearest common ancestor. The highest possible value for occurs if a node belongs to a single category, and this category happens to be the rarest among all. We note that in Ref.[51] a closely related quantity called node diversity was defined for the case where the tags are not part of a hierarchical taxonomy.
3 Applications
We studied the node annotations in three networks of high importance from the aspect of practical applications, capturing the relations between interacting proteins, collaborating scientists, and pages of an on-line encyclopedia. The PPI network of MIPS [58] contained proteins, connected by links, and the tags attached to the nodes corresponded to categories describing the biological processes the proteins take part in. The DAG between these categories was obtained from the Genome Ontology database [59].
The investigated co-authorship network is known as the MathSciNet (Mathematical review collection of the American Mathematical Society) [60], and represents the links of collaboration between mathematicians. The node tags were obtained from the different subject classes of the articles, which were organised into a DAG. Thus, the set of tags attached to each author was the union of all subject-classes that appeared on her/his papers.
Finally, the nodes in the third studied network corresponded to the pages of the English Wikipedia [61, 62, 63, 64], connected by the hyperlinks embedded in the text of the pages. At the bottom of each page, one can find a list of categories, which were used as node tags. Since each wiki-category is a page in the Wikipedia as well, we removed these pages from the network to keep a clear distinction between nodes and attributes. Furthermore, we kept only the mutual links between the remaining pages. Similarly to the biological processes in the MIPS network or the subject classes in the MathSciNet, the wiki-categories can have sub-categories and are usually part of a larger wiki-category. However, when representing these relations as a directed graph, some directed loops appear, therefore, they do not form a strict DAG as required for e.g., the semantic similarity measures (1d-1e). In order to be able to use these similarity functions, we removed a few relations from this graph until it turned into a DAG, following a method detailed in the Appendix.
Due to the very large size of this network, some of the analysis we carried out turned out to be very time consuming, therefore, in certain cases we used only smaller sub-graphs of the Wikipedia, induced by rather general categories e.g., “Soccer”, “Japan”, etc. (The tags which were not descendents of the chosen category were naturally dropped from the nodes in the tag-induced sub-graph). The advantage of this method is that the categories appearing as node tags in the resulting sub-graph also form a DAG which is equivalent to the DAG of the descendents of (in which the root is ). In this paper we show the results for the case where “Japan”, (altogether nodes, links and sub-categories), however other choices resulted in very similar results as well.
We also checked whether this sort of sampling from the networks distorts the studied statistics by examining tag-induced sub-graphs in the other two networks (and smaller tag-induced sub-graphs in the Wikipedia/Japan network) as well. We found that for all statistics studied in this paper the results in a large enough tag-induced sub-graph are very similar to those for the whole network, and the differences can be mostly attributed to the different system sizes.
4 Results
4.1 Basic statistics
We begin our investigations in Fig.2. with the distribution of the tag frequencies in the three networks. According to Fig.2a, the distribution of resembles a power-law for the MIPS network and the Wikipedia, whereas it resembles an exponential distribution for the MathSciNet. When moving from to (by including the nodes tagged with any descendents of as well), the tail of the distribution becomes power-law like for each network, as shown in Fig.2b.

This is consistent with the hierarchical nature of the annotation DAG: categories high up in the DAG correspond to general concepts, therefore apply to a vast number of nodes, whereas leaf categories (without any descendents) refer to something specific, therefore occur rarely [65, 66, 67].

Our main goal in this paper is to study the relations between the distribution of node tags and the network topology. One of the most basic statistical quantity which can be studied in this respect is the number of tags for each node . In Fig.3a we display the density distribution of in the studied systems, whereas Fig.3b shows the average number of tags, as a function of the node degree. Since the range of the possible values is rather wide (especially in case of the MathSciNet), we used exponentially increasing bin sizes in Fig.3a. The decay of the distributions towards large values seems exponential. Concerning the curves shown in Fig.3b, a plausible hypothesis about tagged real networks is that they show tag-assortativity, namely links form ties between similar nodes more frequently than at random. Therefore, we expect connected nodes to share common tags with enhanced probability. Consequently hubs are expected to have a larger number of tags than nodes with small degrees, since they have to share common attributes with a large number of other nodes. Interestingly, in Fig.3b the MathSciNet behaves as expected from this point of view (with a monotonously increasing curve), whereas the MIPS network and the Wikipedia do not. For both networks, is increasing at small degrees, then in case of the MIPS network it saturates, whereas for the Wikipedia it even drops down at high degrees. This implies that the simple picture shown above, in which the hubs correspond to versatile nodes with a large number of different tags does not hold in these systems.
4.2 Tag-induced sub-graphs
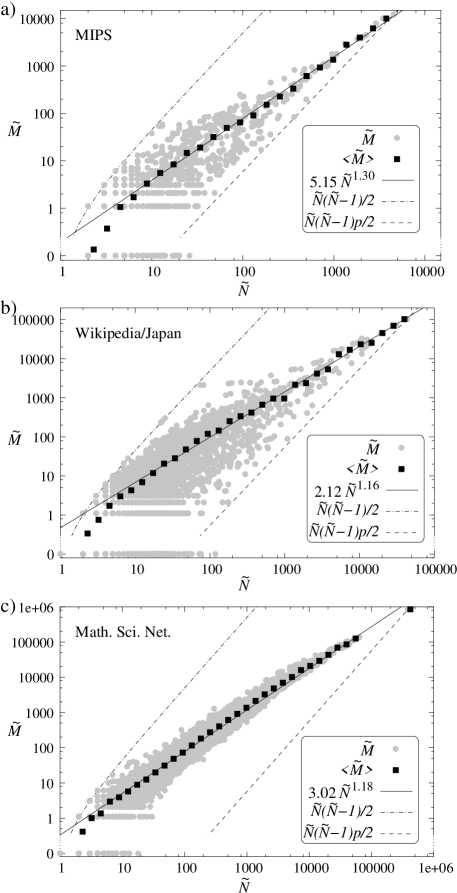
Due to the size of the entire Wikipedia, we have been able to analyse only some of its tag-induced sub-graphs, as described in Sect.3. To get a better understanding of the relationship between tag distribution and network topology, it is very insightful to go further down this line, and compare some of the basic properties of the tag-induced sub-graphs for every category (all the way from the root to the leafs) in all of our three networks. The scatter plots in Fig.4. with gray symbols depict the link number () vs. node number () relation for each category. has a maximum of , when the sub-graph forms a clique, i.e., each node is linked to all the others. This upper bound is shown with a dashed-dotted line. The estimate of the number of links between randomly selected nodes, is also plotted with a dashed line, where the linkage probability is defined as . According to the scatter plots, in all the three systems the number of links in every tag-induced sub-graph (with some exception at ) exceeds the number of links expected for a link distribution that is uncorrelated to the tag distribution. This strongly indicates that the networks under study are tag-assortative.
An even more intriguing property of the scatter plots is that if the average number of links are plotted (with black symbols) as a function of the number of nodes (using logarithmic binning), then they strictly follow a power law (solid lines) for several orders of magnitude (with a deviation only at the smallest sub-graphs). The tag-assortativity exponent , defined by this power law, takes the values of , , and for the MIPS, the Wiki-Japan, and the MathSciNet networks, respectively. The physical meaning of this exponent can be demonstrated by considering the relation between the tag-induced sub-graph of some category and those of its sub-categories. If the tag-induced (not necessarily disjoint) sub-graphs of the sub-categories inherit all the links of the parent category “homogeneously” and without having inter-sub-graph links (i.e., having no links between any pair of sub-graphs other than those originating in the intersection), then the number of links corresponding to a sub-category is expected to scale linearly with the number of its nodes, implying . If, however, inter-sub-graph links also appear (cf. Fig.5), then the number of links corresponding to a sub-category is expected to drop faster than linearly, leading to . Although cannot be ruled out (at least locally, between a particular category and its sub-categories), it requires very peculiar topologies (e.g. large link density in the intersection between the tag-induced sub-graphs of two sub-categories) and, thus, we do not anticipate to obtain such values for real systems.
In brief, a value of indicates tag-disassortativity; characterises no correlation between tag-similarity and link distribution (cf. ); whereas is the regime of tag-assortativity with the amendment that would represent extreme tag-assortativity. This classification scheme affirms that the tag-assortativity exponent defined above is indeed an appropriate quantity for characterising the extent of tag-assortativity. Our finding that its value for the three networks we have studied is closer to than to suggests that these networks exhibit a significant tag-assortativity, MIPS being somewhat less tag-assortative than the other two.
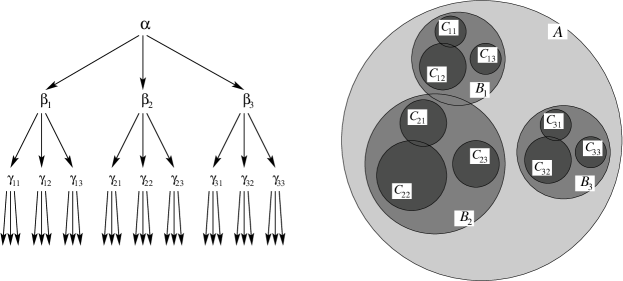
Both the fact that the statistical properties of tag-induced sub-graphs are similar to those of the entire graph and also the fact that a single well defined exponent characterises tag-assortativity over several orders of magnitudes of the sub-graph size imply prominent self-similarity in the structure of tagged networks. Briefly speaking, the tag-induced sub-graph of some category is related to the tag-induced sub-graphs of its sub-categories statistically the same way as the sub-graphs of categories to the tag-induced sub-graphs of their sub-categories , as demonstrated in Fig.5, i.e. both the network topology and the tag distribution appear to be scale invariant.
4.3 Similarity
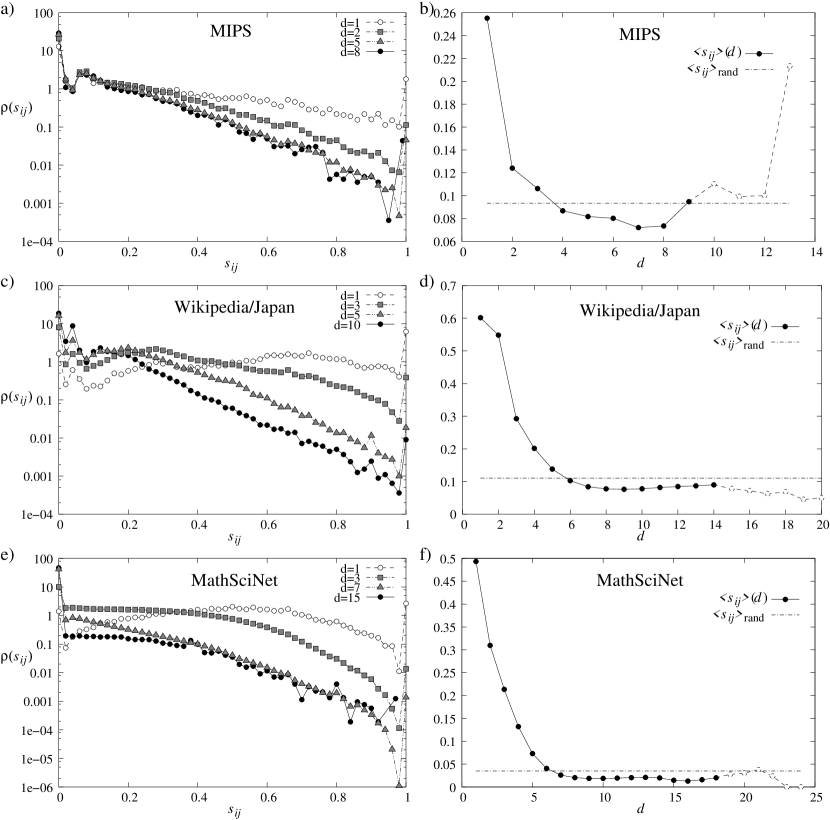
The introduction of a similarity measure based on the node tags enable us to study other type of relations between the topology and the annotations as well. In Fig.6 we follow the change of the similarity between the nodes with the distance in the three networks. The right column of the figure shows the density distribution for obtained from (1g), whereas the left column displays the corresponding average similarity, as a function of the node distance . The distributions are shifted towards lower values with increasing distance between the nodes and accordingly a rapid decreasing tendency can be observed in the function at small distances. At medium node distances becomes more or less constant, suggesting that the nodes become independent of each other. In consistency with the results of Sect.4.2., this is another indication of tag-assortativity: if links were drawn between the nodes at random, the would be independent of the distance between the nodes (the would resemble a flat line). The prominent peak at distance signals that neighbouring nodes are much more similar to each other than at larger distances and much more similar to each other than at random as well.
At large node distances the number of pairs is rapidly decreasing (i.e., at the possible maximum distance only a few pairs of nodes can contribute to ). To indicate that the number of samples in this regime is not enough for a significant statistical analysis, we changed the filled symbols (and solid lines) to empty symbols (and dashed lines) in Figs.6b,6d and 6e. Interestingly, for the MIPS network becomes increasing in this region, reaching a value at the maximal distance almost as high as at . However, this is due the fact that the five nodes making up the pairs at happen to be more similar to a randomly chosen node than average. (Nodes having a couple of non-specific tags can be indeed quite similar to the majority of the nodes). Since the number of pairs at large is small, the contribution from these nodes is significant, and becomes larger than at medium , where the vast number of other nodes counter balance this distortion.
4.4 Node uniqueness
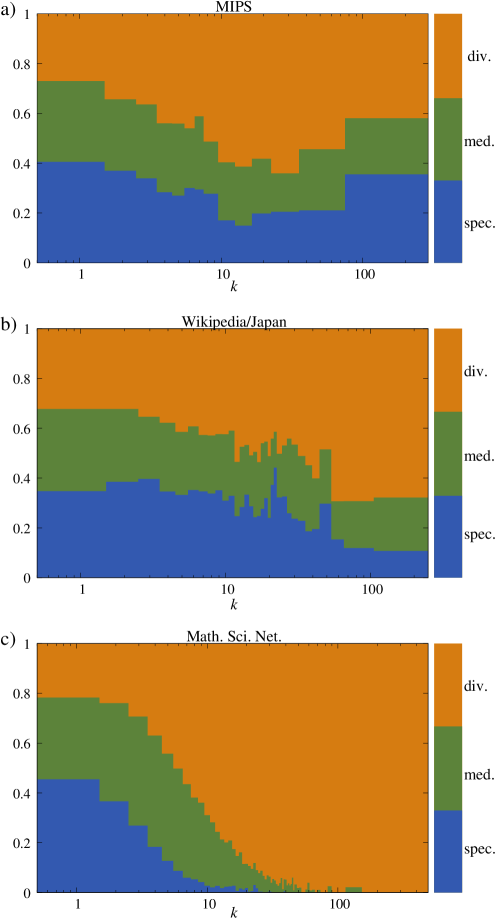
We now move on to the investigation of the node uniqueness, defined in (1h). Our main interest concerns the dependence of on the node degree. We divide the nodes into three classes of equal size depending on their value: specific nodes have relatively high (marked by either a rare label or a few closely related rare labels), medium nodes have a value around the average, whereas diverse nodes have a relatively low value (marked by frequent or un-related labels). In Fig.7. we show the participation ratio of the nodes in the three classes as a function of the node degree . Again, the three systems show different behaviour. In case of the Wikipedia and the MathSciNet, the ratio of diverse nodes is increasing monotonously with the node degree. This tendency is very pronounced in the latter network (Fig.7c), where in fact all hubs are classified as diverse above a certain degree. This is consistent with the steady increase in the average number of tags as a function of the node degree in Fig.3b (square symbols): for nodes with tags we expect to find at least a few pairs of rather un-related categories resulting in a low value. In contrast, for the MIPS network, the monotonous increase in the ratio of diverse nodes with the node degree is followed by a sudden drop at the largest degrees. This means that a significant portion of the hubs in this network have rather specific functions.
5 Summary and conclusion
We studied the basic statistical properties of tags in real networks, with an interest in the relation between the topology and the tag distribution. We found that the investigated systems show universal features in some aspects with interesting differences from other perspectives. At small and intermediate degrees the average number of tags per node is increasing with the degree, and accordingly the node uniqueness is decreasing. For the MathSciNet this tendency is prolonged in the high degree regime as well. In contrast, the number of tags on the hubs in the MIPS network drops down and simultaneously the ratio of nodes with large uniqueness becomes increasing. The behaviour of the English Wikipedia is somewhere in between: the number of tags saturates for the hubs and the further increase in the ratio of nodes with low uniqueness is marginal. This comparison reflects the difference in the behaviour of hubs in these networks: the hubs of the MathSciNet are very versatile with huge amounts of different tags and low values of uniqueness, whereas in the MIPS network a significant portion of the hubs correspond to proteins with rather specific functions.
We introduced the tag-similarity of nodes, which (in contrast to the usual structural similarity) can be calculated independently of the graph topology, and is based on the set of tags associated with the nodes. According to our results, the studied real networks show tag-assortativity: the similarity is decreasing with the node distance at small range and reaches a minimum at medium distances. In other words, tag-similar nodes are linked with each other at higher probability than at random. The tag-assortativity is supported by the investigation of the tag-induced sub-graphs as well, since the number of links between the nodes sharing a given tag is always larger than (or at least equal to) the number of links expected at random.
An even more interesting property of the tag-induced sub-graphs is that the average number of their links follow a power law as a function of the number of their nodes for several orders of magnitude. The magnitude of the tag-assortativity exponent , defined by this power law is in close relation with the tag-assortativity property of the network: a value of indicates tag-disassortativity; characterises no correlation between tag-similarity and link distribution; whereas is the regime of tag-assortativity (with representing extreme tag-assortativity). The tag-assorativity exponent was slightly above 1 for all studied networks in our case.
The above scaling also reveals that the structure of the studied tagged networks is self-similar. This is supported by the fact that the statistical properties of tag-induced sub-graphs are similar to those of the entire graph. This means that in the statistical sense, the network is related to a sub-graph induced by a given category in the same way as this sub-graph is related to the tag-induced sub-graph of a descendent of , i.e. both the network topology and the tag distribution are scale invariant.
Appendix
Preparing a Directed Acyclic Graph (DAG) from the category hierarchy of the English Wikipedia
In Wikipedia the classification terms of each page (appearing at the bottom of the page) are called categories and are arranged into a hierarchy, i.e. a directed network where a more general term is connected to each of its child terms via a directed link. It is important to note that this directed graph contains cycles (loops): a closed path of nodes where each node (a category) is a sub-category of the previous one and the first is a sub-category of the last. Many of these loops are short and are made up of a small group of synonymous terms, e.g., the categories Hindustani and Urdu are very closely related and are both sub-categories of the other. An example for a longer loop is Education: Social sciences: Academic disciplines: Academia: Education, and a loop of length has been found, too, in the English Wikipedia [68].
Loops in the category hierarchy can confuse both readers and search engines, and prohibit a tree-based semantic analysis of annotations. For example, with loops it would impossible to identify the closest common ancestor(s) of two arbitrary terms and decide their level of relatedness. To delete all loops from the hierarchy of Wikipedia categories, first we devised an algorithm eliminating all loops from a generic directed network by sequentially removing single directed links and modifying the directed network by the smallest possible amount. Then, we applied the algorithm to the directed network defined by the category hierarchy of the English Wikipedia.
The algorithm can be applied to an arbitrary directed network (nodes connected with directed links) and it has two parts. First, it identifies the ”loop sub-graph” of the full directed graph, the set containing precisely the directed links of all loops. This is achieved by an iteration where in each step all directed links are removed that have either a start node that is a source (no incoming link) or an end node that is a drain (no outgoing links). Neither of these two node types (source and drain) can be in a loop. Repeating this removal step until at least one node is removed lead to a sub-graph containing precisely the loops of the full graph. Note that the loop sub-graph may have more than one graph component.
The second step of the algorithm identifies a set of directed links () whose removal from the loop sub-graph eliminates all of its loops. As the loop sub-graph is by definition the set of loops of the original graph, removing the same directed links from the full graph will eliminate its loops. We selected the set of removed links, , with the goal to modify the full graph by the smallest possible amount. This concerns not only the size of (the number of links removed), but also selecting links with the smallest significance as viewed from the full graph. Turning back to one of the above examples, one has to decide which of the two directed links ”Urdu is a sub-category of Hindustani” or ”Hindustani is a sub-category of Urdu” is less relevant from the point of view of the entire directed network. More generally, suppose that in a (directed) network the directed links AB and BA are both present. To eliminate the loop BA, one of the two links has to be removed.
To decide which of the two links is less significant, consider another example. In a directed network with the four links MA, AB, BA and BN, the link AB is more important than BA, because it is contained by a long continuous path, MABN. On the other hand, BA points in the opposite direction, thus, it is likely to be a ”side effect”. The difference between these two links can be measured. The number of point-to-point shortest directed paths passing through AB is larger (: MN, AN and AN) than the number of those containing BA (only : BA). In a directed network the number of shortest paths passing through a given (directed) link is called the directed betweenness centrality of that link. Multiple shortest paths between two nodes are accounted for by weighting, see e.g., Ref. [2] for the undirected case. Based on the above observation, we quantified the significance of each directed link by its directed betweenness centrality, , as measured in the full network.
Now let us return to the second part of the algorithm starting from the loop sub-graph. Knowing of each link in this sub-net, we can select and remove the least important link, i.e. the one with the lowest value. This link removal may produce source nodes (only outgoing links) and drain nodes (only incoming links). Again we iteratively remove links not contained by loops until the remaining network ”melts down” to the set of remaining loops. We repeat this step – deleting the link with smallest and then iteratively removing all non-loop links – until no more links remain. We save the set of removed links, , and remove the same set of links from the full graph to eliminate all of its loops by modifying it by the smallest possible amount.
The full category hierarchy of the English Wikipedia (Oct/17/2007 version) contains nodes (categories) and directed links (category - sub-category connections). The loop sub-graph has nodes and (directed) links. The total number of removed links was . Data together and processing programs can be downloaded from the website http://CFinder.org .
Acknowledgment
We thank E. Gabrilovich for public domain pre-processing software of Wikipedia. This work was supported by the Hungarian National Science Fund (OTKA K68669, K75334 and T049674), the National Research and Technological Office (NKTH, CellCom RET, Textrend) and the János Bolyai Research Scholarship of the Hungarian Academy of Sciences.
References
References
- [1] R. Albert and A.-L. Barabási. Statistical mechanics of complex networks. Rev. Mod. Phys., 74:47–97, 2002.
- [2] J. F. F. Mendes and S. N. Dorogovtsev. Evolution of Networks: From Biological Nets to the Internet and WWW. Oxford University Press, Oxford, 2003.
- [3] D. J. Watts and S. H. Strogatz. Collective dynamics of ’small-world’ networks. Nature, 393:440–442, 1998.
- [4] M. Faloutsos, P. Faloutsos, and C. Faloutsos. On power-law relationships of the internet topology. Comput. Commun. Rev., 29:251–262, 1999.
- [5] A.-L. Barabási and R. Albert. Emergence of scaling in random networks. Science, 286:509–512, 1999.
- [6] S. Boccaletti, V. Latora, Y. Moreno, M. Chavez, and D.-U. Hwang. Complex networks: Structure ad dynamics. Physics Reports, 424:175–308, 2006.
- [7] H. Jeong, B. Tombor, R. Albert, Z. N. Oltvai, and A.-L. Barabási. The large-scale organization of metabolic networks. Nature, 407:651–654, 2000.
- [8] E. Ravasz, A. L. Somera, D. A. Mongru, Z. N. Oltvai, , and A.-L. Barabási. Hierarchical organization of modularity in metabolic networks. Science, 297:1551–1555, 2002.
- [9] J.-D. J. Han, N. Bertin, T. Hao, D. S. Goldberg, G. F. Berriz, L. V. Zhang, D. Dupuy, A. J. M. Walhout, M. E. Cusick, F. P. Roth, and M. Vidal. Evidence for dynamically organized modularity in the yeast protein2̆013protein interaction network. Nature, 430:88–93, 2004.
- [10] R. Milo, S. Shen-Orr, S. Itzkovitz, N. Kashtan, D. Chklovskii, and U. Alon. Network motifs: Simple building blocks of complex networks. Science, 298:824–827, 2002.
- [11] R. Milo, S. Itzkovitz, N. Kashtan, R. Levitt, S. Shen-Orr, I. Ayzenshtat, M. Sheffer, and U. Alon. Superfamilies of evolved and designed networks. Science, 303:1538–1542, 2004.
- [12] M. Blatt, S. Wiseman, and E. Domany. Super-paramagnetic clustering of data. Phys. Rev. Lett., 76:3251–3254, 1996.
- [13] M. Girvan and M. E. J. Newman. Community structure in social and biological networks. Proc. Natl. Acad. Sci. USA, 99:7821–7826, 2002.
- [14] H. Zhou. Distance, dissimilarity index, and network community structure. Phys. Rev. E, 67:061901, 2003.
- [15] M. E. J. Newman. Fast algorithm for detecting community structure in networks. Phys. Rev. E, 69:066133, 2004.
- [16] F. Radicchi, C. Castellano, F. Cecconi, V. Loreto, and D. Parisi. Defining and identifying communities in networks. Proc. Natl. Acad. Sci. USA, 101:2658–2663, 2004.
- [17] D. M. Wilkinson and B. A. Huberman. A method for finding communities of related genes. Proc. Natl. Acad. Sci. USA, 101:5241–5248, 2004.
- [18] J. Reichardt and S. Bornholdt. Detecting Fuzzy Community Structures in Complex Networks with a Potts Model. Phys. Rev. Lett., 93:218701, 2004.
- [19] J. Scott. Social Network Analysis: A Handbook. Sage Publications, London, 2nd edition, 2000.
- [20] R. M. Shiffrin and K. Börner. Mapping knowledge domains. Proc. Natl. Acad. Sci. USA, 101:5183–5185 Suppl. 1, 2004.
- [21] B. S. Everitt. Cluster Analysis. Edward Arnold, London, 3d edition, 1993.
- [22] S. Knudsen. A Guide to Analysis of DNA Microarray Data. Wiley-Liss, 2nd edition, 2004.
- [23] M. E. J. Newman. Detecting community structure in networks. Eur. Phys. J. B, 38:321–330, 2004.
- [24] G. Palla, I. Derényi, I. Farkas, and T. Vicsek. Uncovering the overlapping community structure of complex networks in nature and society. Nature, 435:814–818, 2005.
- [25] S. Fortunato and C. Castellano. Community structure in graphs. Springer, Berlin, 2009.
- [26] A. Lancichinetti, S. Fortunato, and J. Kertész. Detecting the overlapping and hierarchical community structure of complex networks. arXiv:0802.1218, 2008.
- [27] V. Spirin and K. A. Mirny. Protein complexes and functional modules in molecular networks. Proc. Natl. Acad. Sci. USA, 100:12123–12128, 2003.
- [28] J.-P. Onnela, A. Chakraborti, K. Kaski, J. Kertész, and A. Kanto. Dynamics of market correlations: Taxonomy and portfolio analysis. Phys. Rev. E, 68:056110, 2003.
- [29] T. Heimo, J. Saramäki, J.-P. Onnela, and K. Kaski. Spectral and network methods in the analysis of correlation matrices of stock returns. Physica A-Statistical Mechanics and its Applications, 383:147–151, 2007.
- [30] D. J. Watts, P. S. Dodds, and M. E. J. Newman. Identity and search in social networks. Science, 296:1302–1305, 2002.
- [31] G. Palla, A.-L. Barabási, and T. Vicsek. Quantifying social group evolution. Nature, 446:664–667, 2007.
- [32] G. Szabó, J. Vukov, and A. Szolnoki. Phase diagrams for an evolutionary prisoner’s dilemma game on two-dimensional lattices. Phys. Rev. E, 72:047107, 2005.
- [33] J. Vukov, G. Szabó, and A. Szolnoki. Cooperation in the noisy case: Prisoner’s dilemma game on two types of regular random graphs. Phys. Rev. E, 73:067103, 2006.
- [34] G. Szabó and G. Fáth. Evolutionary games on graphs. Physics Reports-Review Section of Physics Letters, 446:97–216, 2007.
- [35] O. Mason and M. Verwoerd. Graph theory and networks in Biology. IET Systems Biology, 1:89–119, 2007.
- [36] X. Zhu, M. Gerstein, and M. Snyder. Getting connected: analysis and principles of biological networks. Genes & Development, 21:1010–1024, 2007.
- [37] T. Aittokallio and B. Schwikowski. Graph-based methods for analysing networks in cell biology. Briefings in Bioinformatics, 7:243–255, 2006.
- [38] G. Finocchiaro, F. M. Mancuso, D. Cittaro, and H. Muller. Graph-based identification of cancer signaling pathways from published gene expression signatures using PubLiME. Nucl. Ac. Res., 35:2343–2355, 2007.
- [39] P. F. Jonsson and P. A. Bates. Global topological features of cancer proteins in the human interactome. Bioinformatics, 22:2291–2297, 2006.
- [40] P. F. Jonsson, T. Cavanna, D. Zicha, and P. A. Bates. Cluster analysis of networks generated through homology: automatic identification of important protein communities involved in cancer metastasis. BMC Bioinformatics, 7:2, 2006.
- [41] M. G. Zimmermann, V. M. Eguíluz, and M. S. Miguel. Coevolution of dynamical stats and interactions in dynamic networks. Phys. Rev. E, 69:065102(R), 2004.
- [42] V. M. Eguíluz, M. G. Zimmermann, and C. J. Cela-Conde. Cooperation and the emergence of role differentiation in the dynamics of social networks. Am. J. Sociol., 110:977–1008, 2005.
- [43] G. Kossinets and D. J. Watts. Empirical analysis of an evolving social network. Science, 311:88–90, 2006.
- [44] G. C. M. A. Ehrhardt and M. Marsili. Phenomenological models of socioeconomic network dynamics. Phys. Rev. E, 74:036106, 2006.
- [45] P. Holme and M. E. J. Newman. Nonequilibrium phase transition in the coevolution of networks and opinions. Phys. Rev. E, 74:056108, 2006.
- [46] S. Gil and D. H. Zanette. Coevolution of agents and networks: Opinion sperading and community disconnection. Phys. Lett. A, 356:89–94, 2006.
- [47] F. Vazquez, J. C. González-Avella, V. M. Eguíluz, and M. S. Miguel. Time-scale competition leading to fragmentation and recombination transitions in the coevolution of network and states. Phys. Rev. E, 76:046120, 2007.
- [48] F. Vazquez, V. M. Eguíluz, and M. S. Miguel. Generic absorbing transition in coevolution dynamics. Phys. Rev. Lett., 100:108702, 2008.
- [49] B. Kozma and A. Barrat. Consensus formation on adaptive networks. Phys. Rev. E, 77:016102, 2008.
- [50] I. J. Benczik, S. Z. Benczik, B. Schmittmann, and R. K. P. Zia. Lack of consensus in social systems. Europhys. Lett., 82:48006, 2008.
- [51] R. Lambiotte and M. Ausloos. Collaborative tagging as a tripartite network. Lect. Notes in Computer Sci., 3993:1114–1117, 2006.
- [52] P. Jaccard. Nouvelles recherches sur la distribution florale. Bull. Soc. Vandoise des Sci. Nat., 44:223–270, 1908.
- [53] P. Resnik. Semantic similarity in a taxonomy: an information-based measure and its application to problems of ambiguity in natural language. J. Artif. Intel. Res., 11:95–130, 1999.
- [54] D. Lin. An information-theoric definition of similarity. In Proceedings of the 15th International Conference on Machine Learning, pages 296–304, San Francisco CA, 1998.
- [55] X. Guo, R. Liu, C. D. Shriver, H. Hu, and M. N. Liebman. Assessing semantic similarity measures for the characterization of human regulatory pathways. Bioinformatics, 22:967–973, 2006.
- [56] A. Schlicker, F. S. Domingues, J. Rahnenführer, and T. Lengauer. A new measure for functional similarity of gene products based on gene ontology. BMC Bioinformatics, 7:302–317, 2006.
- [57] T. R. Jensen and B. Toft. Graph Coloring Problems. Wiley-Interscience, New York, 1995.
- [58] H. W. Mewes, S. Dietmann, D. Frishman, R. Gregory, G. Mannhaupt, K. Mayer, M. Muensterkötter, A. Ruepp, M. Spannagl, V. Stuempflen, and T. Rattei. Mips: Analysis and annotation of genome information in 2007. Nucl. Acids Res., 36:D196–D201, 2008.
- [59] The Gene Ontology Consortium. Gene ontology: tool for the unification of biology. Nature Genetics, 25:25–29, 2000.
- [60] http://www.ams.org/mathscinet.
- [61] http://en.wikipedia.org.
- [62] V. Zlatić, M. Božičević, H. Štefančić, and M. Domazet. Wikipedias: Collaborative web-based encyclopedias as complex networks. Phys. Rev. E, 74:016115, 2006.
- [63] A. Capocci, V. D. P. Servedio, F. Colaiori, L. S. Buriol, D. Donato, S. Leonardi, and G. Caldarelli. Preferential attachment in the growth of social networks: The internet encyclopedia wikipedia. Phys. Rev. E, 74:036116, 2006.
- [64] A. Capocci, F. Rao, and G. Caldarelli. Taxonomy and clustering in collaborative systems: The case of the on-line encyclopedia wikipedia. Europhys. Lett., 81:28006, 2008.
- [65] P. De Los Rios. Power law size distribution of supercritical random trees. Europhys. Lett., 56:898–903, 2001.
- [66] G. Caldarelli, C. Caretta Cartozo, P. De Los Rios, and V. D. P. Servedio. Widespread occurrence of the inverse square distribution in social sciences and taxonomy. Phys. Rev. E, 69:035101, 2004.
- [67] C. Caretta Cartozo, D. Garlaschelli, C. Ricotta, M. Barthélemy, and G. Caldarelli. Quantifying the taxonomic diversity in real species communities. J. Phys. A: Math. Theor., 41:224012, 2008.
- [68] http://en.wikipedia.org/wiki/Wikipedia:Categorization.