Chemical evolution of high-mass stars in close binaries. I. The eclipsing binary V453 Cygni
Abstract
The eclipsing and double-lined spectroscopic binary system V453 Cygni consists of two early B-type stars, one of which is nearing the terminal age main sequence and one which is roughly halfway through its main sequence lifetime. Accurate measurements of the masses and radii of the two stars are available, which makes a detailed abundance analysis both more interesting and more precise than for isolated stars. We have reconstructed the spectra of the individual components of V453 Cyg from the observed composite spectra using the technique of spectral disentangling. From these disentangled spectra we have obtained improved effective temperature measurements of K and K, for the primary and secondary stars respectively, by fitting non-LTE theoretical line profiles to the hydrogen Balmer lines. Armed with these high-precision effective temperatures and the accurately known surface gravities of the stars we have obtained the abundances of helium and metallic elements. A detailed abundance analysis of the primary star shows a normal (solar) helium abundance if the microturbulence velocity derived from metallic lines is used. The elemental abundances show no indication that CNO-processed material is present in the photosphere of this high-mass terminal age main sequence star. The elemental abundances of the secondary star were derived by differential study against a template spectrum of a star with similar characteristics. Both the primary and secondary components display elemental abundances which are in the ranges observed in the Galactic OB stars.
keywords:
elemental abundances – spectroscopy: binary stars1 Introduction
High-mass stars are major producers of ultraviolet light and byproducts of thermonuclear fusion, so are important objects in the study of star formation, and galactic chemical and kinetic evolution (e.g. Samland 1998). The large luminosities of high-mass stars means that they are important distance indicators in both a galactic and cosmological context (e.g. Guinan et al. 1998; Ribas et al. 2005; Southworth et al. 2005, 2007).
In the last decade new theoretical models have been constructed which incorporate a number of physical processes important to the structure and evolution of high-mass stars, including convective core overshooting, semiconvection, rotational mixing and mass loss. Overshooting and rotation can both have a large effect on the predicted lifetimes and luminosities of high-mass stars (c.f. review by Maeder & Meynet 2000). However, empirical constraints on these processes remain hard to come by, despite a steady improvement in observational techniques and capabilities (see Hilditch 2004).
Detached eclipsing binaries (dEBs) are vital objects for obtaining observational constraints on the structure and evolution of high-mass stars, since they are the primary source of directly measured stellar properties (Andersen 1991). Unfortunately, accurate (2% or better) physical properties are available for only eight high-mass dEBs111An up-to-date compilation of the properties of well-studied dEBs is available at http://www.astro.keele.ac.uk/jkt, and most of these objects have no observational constraints on their chemical composition. Chemical abundances are difficult to determine from the spectra of high-mass dEBs for several reasons. Firstly, they tend to display only a small number of spectral lines. Secondly, the often high rotational velocities of these objects means their spectral lines are wide and shallow so high signal-to-noise ratio (S/N) spectra are needed to obtain useful results. Thirdly, in dEBs the spectral lines from one component interfere with the line profiles of the other component (‘line blending’).
In a seminal work, Simon & Sturm (1994) introduced the technique of spectral disentangling (spd), by which individual spectra of the component stars of a double-lined spectroscopic binary system can be deduced from a set of composite spectra observed over a range of orbital phases. spd can be used to measure spectroscopic orbits which are not affected by the line blending which afflicts other methods, such as cross-correlation (see Southworth & Clausen 2007). The resulting disentangled spectra also have a much higher S/N than the original observations, making them very useful for chemical abundance analyses. As a bonus, the strong degeneracy between effective temperature () and surface gravity () is not a problem for dEBs because surface gravities can be measured to high accuracy (0.01 dex or better) for both components. A detailed study of these possibilities is given by Pavlovski & Hensberge (2005; hereafter PH05).
1.1 The eclipsing binary system V453 Cyg
V453 Cyg belongs to rather sparse group of high-mass close binary systems for which accurate physical properties have been measured for both components. In the most recent study of V453 Cyg, Southworth, Maxted & Smalley (2004b; hereafter SMS04) analysed new spectroscopic observations and previously published light curves, obtaining masses of and , and radii of and . The high precision of the radius measurements was helped by the geometry of the V453 Cyg system, which exhibits deep and total eclipses. SMS04 derived effective temperatures of K and K from the equivalent widths of several \textHe i and \textHe ii lines, using an analysis based on local thermodynamic equilibrium (LTE) synthetic spectra but with a correction for non-LTE effects.
V453 Cyg is known to display the phenomenon of apsidal motion, which can be used as a probe of the internal structure of the components of an eccentric binary system (e.g. Claret & Giménez 1993). SMS04 found an apsidal period of yr, which gives the structural parameter222Note that the value in the abstract of SMS04 is incorrect: the correct value is given in SMS04 (their Section 7.2) and here. . The masses, radii, s and of V453 Cyg match theoretical predictions for an age of Myr and an approximately solar metal abundance. The primary component (the hotter and more massive star) is reaching the terminal age of its main sequence lifetime (TAMS) whilst the secondary star is roughly halfway through its MS life. The significant difference between the properties of the two stars means that V453 Cyg is a very useful system for testing evolutionary models.
In this work we analyse the spectroscopy of V453 Cyg obtained by SMS04 and by Simon & Sturm (1994) in order to obtain new s and accurate chemical abundances for the stars. V453 Cyg was targeted by SMS04 as part of a program to study dEBs which are members of open clusters (see Southworth, Maxted & Smalley 2004a; Southworth et al. 2004c). It is a probable member of NGC 6871, so our results can be compared to published analyses of single stars which are also cluster members.
2 Spectroscopic data
| Set | ID | HJD | S/N | (Å) | Cycle |
|---|---|---|---|---|---|
| A | 21x | 48813.39567 | 150 | 4010 | 2435.4036 |
| A | 43x | 48814.63754 | 150 | 4010 | 2435.7229 |
| A | 51x | 48816.38687 | 160 | 4010 | 2436.1726 |
| A | 61x | 48817.38987 | 170 | 4010 | 2436.4304 |
| A | 71x | 48818.37820 | 190 | 4010 | 2436.6845 |
| A | 81x | 48819.38231 | 190 | 4010 | 2436.9427 |
| A | 32 | 49201.45130 | 140 | 4010 | 2535.1653 |
| A | 41 | 49202.35881 | 170 | 4010 | 2535.3986 |
| A | 51 | 49203.46754 | 190 | 4010 | 2535.6837 |
| B | 22x | 48813.47704 | 180 | 4290 | 2435.4245 |
| B | 42x | 48815.46905 | 170 | 4290 | 2435.9366 |
| B | 62x | 48816.52872 | 220 | 4290 | 2436.2091 |
| B | 72x | 48817.64888 | 200 | 4290 | 2436.4970 |
| B | 85x | 48818.60773 | 190 | 4290 | 2436.7435 |
| B | 82x | 48819.47156 | 190 | 4290 | 2436.9656 |
| C | 23x | 48812.57408 | 180 | 4520 | 2435.1924 |
| C | 32x | 48814.48183 | 180 | 4520 | 2435.6828 |
| C | 41x | 48815.40237 | 140 | 4520 | 2435.9195 |
| C | 52x | 48816.42184 | 190 | 4520 | 2436.1816 |
| C | 63x | 48816.63435 | 210 | 4520 | 2436.2362 |
| C | 83x | 48818.59129 | 200 | 4520 | 2436.7393 |
| D | 11x | 48812.48692 | 200 | 4750 | 2435.1700 |
| D | 11 | 49199.49495 | 200 | 4750 | 2534.6624 |
| D | 12 | 49199.60984 | 190 | 4750 | 2534.6919 |
| D | 13 | 49199.65734 | 150 | 4750 | 2534.7041 |
| D | 21 | 49200.38908 | 170 | 4750 | 2534.8923 |
| D | 31 | 49201.41599 | 180 | 4750 | 2535.1562 |
| D | 33 | 49201.66650 | 150 | 4750 | 2535.2207 |
| D | 42 | 49202.38781 | 170 | 4750 | 2535.4061 |
| Set | ID | HJD | S/N | (Å) | Cycle |
| E | 323747 | 52562.50016 | 160 | 4360 | 3399.2270 |
| E | 323867 | 52563.31850 | 110 | 4360 | 3399.4374 |
| E | 324029 | 52564.31988 | 160 | 4360 | 3399.6948 |
| E | 324255 | 52565.33945 | 180 | 4360 | 3399.9569 |
| E | 324455 | 52566.29608 | 140 | 4360 | 3400.2029 |
| E | 324462 | 52566.31116 | 140 | 4360 | 3400.2068 |
| E | 324505 | 52566.43565 | 180 | 4360 | 3400.2388 |
| E | 324581 | 52568.34709 | 160 | 4360 | 3400.7302 |
| E | 324757 | 52569.31004 | 100 | 4360 | 3400.9777 |
| E | 324774 | 52569.34031 | 130 | 4360 | 3400.9855 |
| F | 323085 | 52559.33775 | 210 | 4580 | 3398.4140 |
| F | 323086 | 52559.34009 | 210 | 4580 | 3398.4146 |
| F | 323285 | 52560.31872 | 150 | 4580 | 3398.6662 |
| F | 323286 | 52560.32104 | 150 | 4580 | 3398.6668 |
| F | 323287 | 52560.32335 | 150 | 4580 | 3398.6674 |
| F | 323288 | 52560.32567 | 150 | 4580 | 3398.6680 |
| F | 323289 | 52560.32799 | 150 | 4580 | 3398.6686 |
| F | 323317 | 52560.40911 | 130 | 4580 | 3398.6894 |
| F | 323318 | 52560.41142 | 130 | 4580 | 3398.6900 |
| F | 323319 | 52560.41375 | 130 | 4580 | 3398.6906 |
| F | 323320 | 52560.41606 | 130 | 4580 | 3398.6912 |
| F | 323321 | 52560.41837 | 130 | 4580 | 3398.6918 |
| F | 323479 | 52561.30395 | 140 | 4580 | 3398.9195 |
| F | 323480 | 52561.30627 | 150 | 4580 | 3398.9201 |
| F | 323481 | 52561.30858 | 150 | 4580 | 3398.9207 |
| F | 323482 | 52561.31091 | 140 | 4580 | 3398.9213 |
| F | 323483 | 52561.31322 | 150 | 4580 | 3398.9219 |
| F | 323744 | 52562.49486 | 160 | 4580 | 3399.2257 |
| F | 323864 | 52563.31216 | 110 | 4580 | 3399.4358 |
| F | 324026 | 52564.31111 | 170 | 4580 | 3399.6926 |
| F | 324247 | 52565.32035 | 180 | 4580 | 3399.9520 |
| F | 324584 | 52568.35585 | 170 | 4580 | 3400.7324 |
| F | 325129 | 52570.35446 | 170 | 4580 | 3401.2462 |
| F | 325348 | 52571.30720 | 180 | 4580 | 3401.4911 |
2.1 Calar Alto spectra
A total of 29 spectra of V453 Cyg were obtained by Simon & Sturm (1994) during two observing runs in 1990 and 1992 with the 2.2 m telescope at the German-Spanish Astronomical Centre at Calar Alto, Spain (Table 1). Four different spectral intervals were observed with the coudé spectrograph, each covering 250 Å. The intervals are centred on the hydrogen lines H (4050), H (4430), H (4850), and on a 4533–4730 Å region containing metallic lines, \textHe ii 4686 and \textHe i 4712. The reciprocal dispersion is 0.13 Å px-1 for the 1990 spectra and 0.20 Å px-1 for the 1992 data. The S/N ratios are 140–220; further details are given by Simon et al. (1994).
2.2 La Palma spectra
A set of 43 spectra of V453 Cyg were secured in 2001 October with the 2.5 m Isaac Newton Telescope and Intermediate Dispersion Spectrograph at La Palma, Spain (Table 2). These are split between two spectral intervals of length 260 Å, reciprocal dispersion 0.11 Å px-1 and resolution 0.20 Å. Most spectra are centred on 4360 Å and the remainder on 4580 Å: both datasets cover the \textHe i 4471 and \textMg ii 4481 lines, which are good lines for radial velocity (RV) determination over a wide range of spectral types (Andersen 1975). A few additional spectra were obtained with central wavelengths of 4340 Å and 4840 Å; they are not used here. The S/N of the La Palma spectra is 100–450 per pixel, with most close to 150. We have rejected a few spectra with a S/N below 100.
3 Method
Our aim is to perform a detailed test of the predictions of stellar evolution models of high-mass stars using strict empirical constraints. This aim can only be reached by studying dEBs, as these are the only objects where we can measure masses and radii of high-mass stars to accuracies of 1%. In this context the spd technique has an important role both in mass and abundance determination. RV and mass measurements of OB-type dEBs are difficult because their spectra generally contain only a few lines, which have strong rotational broadening and so suffer line blending.
Using spd and a set of spectra taken at a range of orbital phases, it is possible to determine the individual component spectra. One can also simultaneously solve for the RVs for each component and spectrum, or directly for the orbital parameters of the system. Contrary to the cross-correlation method (Simkin 1974; Tonry & Davis 1979) no template spectrum is needed since the individual component spectra are themselves used as templates, so a significant source of bias is bypassed (c.f. Hensberge & Pavlovski 2007).
Several studies have put extensive effort into reconciling RVs measured by several techniques to orbital parameters derived using spd. Orbital parameters from RVs determined by multi-component Gaussian fitting to complex line profiles have been found to be inferior to those derived by spd (Simon & Sturm 1994b; Simon, Sturm & Fiedler 1994; Hensberge et al. 2000). spd also performs better than standard cross-correlation (Holmgren et al. 1997).
Southworth & Clausen (2007) critiqued these methods and the two-dimensional cross-correlation technique todcor (Zucker & Mazeh 1994) in an analysis of the dEB DW Carinae. The main problem in RV determination was found to be line blending. spd gave the most reliable RVs, and fitting a double-Gaussian also gave acceptable results. Cross-correlation techniques could not properly account for line blending and gave results which were systematically biased towards smaller stellar masses. These conclusions were obtained in a case when the two component stars had very similar properties and individual spectral lines were studied, so some of the benefits of cross-correlation could not be accessed.

4 Spectroscopic orbits through spectral disentangling
| Parameter | SMS04 | Subset C | Subset F |
|---|---|---|---|
| 0.022 (fixed) | |||
| (∘) | 140.1 (fixed) | ||
| ( km s-1) | |||
| ( km s-1) | |||
Two spectroscopic datasets are available for analysis which were obtained about 10 years apart (Section 2). As V453 Cyg exhibits fast apsidal motion (see Section 1.1) these cannot be analysed together. The datasets are split over a number of spectral windows: subset F (La Palma) is the most extensive and includes 24 spectra centred on 4580 Å. This subset was used for determination of the orbital parameters. The phase distribution of the spectra is reasonable but suffers slightly from the orbital period of V453 Cyg (3.89 d) being close to an integer number of days: phases – could not be covered. However, an observation was deliberately obtained during secondary eclipse, where only the primary star is visible. This spectrum was actually used as the template in the todcor analysis performed by SMS04 as it is a good match to both stars. Disentangled spectra formally contain no information about the continuum level for each star (PH05), but in the case of V453 Cyg this secondary-eclipse spectrum can be used to reliably determine how much light each star contributes.
We have performed a spectral disentangling analysis in velocity space (see Hadrava 1995) using the fdbinary333http://sail.zpf.fer.hr/fdbinary/ code (Ilijić et al. 2004). In Fourier spd individual pixel flux uncertainties cannot be used but individual spectra can be assigned a weight based on their quality. We weighted the input spectra according to their S/N and adopted as our initial orbit the final solution given by SMS04. We fixed the orbital period at 3.889825 d (SMS04).
spd was performed over the spectral region 4540–4690 Å. The strong lines of \textHe ii 4471 and \textMg ii 4481 were excluded in the determination of the orbital parameters, as in our experience better results are obtained for larger numbers of weak lines than for a few strong lines. The resulting parameters are given in Table 3. The errors are determined by the jackknife method (e.g., Yang & Robinson 1986), which seems to be an appropriate approach for error calculations in spd. Table 3 also contains the final orbit of SMS04, which is in good agreement with the results found here. Note that, in their analysis, SMS04 used todcor to measure RVs so were only able to use spectra where the two stars had very different RVs. They thus fixed the eccentricity, , and periastron longitude, , to the values found from their apsidal motion analysis. In our solution we were able to use all the available 4580 Å spectra (subset F), including that obtained during secondary eclipse (phase 0.50). The orbital parameters are therefore more reliable, particularly and . An example of spd of the observed composite spectra and resulting disentangled spectra are shown in Fig. 1.
For the Calar Alto spectra, subset C was chosen to be the master dataset for determining the orbital parameters. Since the individual Calar Alto datasets contain fewer spectra than the La Palma ones, we fixed the eccentricity to the value obtained from subset F (). Other parameters were adjusted in spd. Other subsets (A, B, and D) were disentangled keeping the orbital parameters fixed to those obtained for subset C. The La Palma spectra were disentangled using the orbital parameters obtained for subset F.
A feature of spd is that the disentangled spectra are effectively co-added from the original observations and so have a higher S/N. The total S/N in a disentangled spectrum of component is
where is the fractional light contribution for component , and and are the S/N and number of input spectra. Both sets of the La Palma spectra cover the 4455–4505 Å region (which includes \textHe i 4471 and \textMg ii 4481), so the total number of observations of this spectral window is 45. We have disentangled this region separately, yielding individual component spectra with S/N of about 700 for the primary and 250 for the secondary ( and ). For comparison, disentangling the eight spectra in subset C (Calar Alto) gives individual spectra with S/N of about 380 and 130. The enhanced S/N in the disentangled spectra of the components relative to the observed spectra can be seen in Fig. 1. The two disentangled spectra have different S/N because the secondary star is fainter than the primary.
5 Spectral analysis of both components
The primary goal of this study is to measure the photospheric elemental abundances of the components of V453 Cyg, which requires knowledge of their s and s. Whilst disentangled spectra can be analysed in the same ways as single-star spectra, a potential drawback is that the continuum level for each star is not specified by spd, short of ensuring individual spectral lines do not dip below zero flux. For V453 Cyg this is not a problem because spectra have been obtained during eclipses (spectrum 324777 in subset F and spectrum 11x in subset D). Also, the solution of the Cohen (1974) light curves of V453 Cyg (SMS04) allows us to assign a light factor to the two stars for each observed spectrum. We have renormalised the disentangled spectra using the method and formulae presented by PH05. The mid-eclipse spectra are themselves suitable for the following analysis, but we have used the renormalised disentangled spectra due to their much higher S/N.
Abundance analyses of single stars can suffer from a strong correlation between the and measurements from stellar spectra. In the case of dEBs this can be avoided because the of each star can be measured accurately. The values for V453 Cyg are and (SMS04).
 |
 |
 |
5.1 Effective temperature determination
SMS04 used the equivalent widths of helium lines and LTE theoretical spectra (with a correction for non-LTE effects) to derive K and K, but noted that the helium abundance might be enhanced and that this could affect the measurements. As the helium abundance is an important part of the current analysis, we could not use helium lines to measure s.
A standard way of deriving for a sequence of B stars is from the \textSi ii/\textSi iii/\textSi iv ionisation equilibrium (c.f. Becker & Butler 1990). Some spectral lines of these three ions are visible in the primary’s disentangled spectra, but its relatively high projected rotational velocity (110 km s-1) means the equivalent width of \textSi ii 4128 is difficult to measure to sufficient accuracy. Also, some important lines (e.g. \textSi ii 5379) are not covered by the available spectra. In the secondary’s spectrum, \textSi iv 4212 is barely visible.
We have instead used the Balmer lines, which are good indicators of in hot stars if is already known from elsewhere. Our disentangled spectra cover H, H and H. In OB stars the Balmer lines are affected by numerous oxygen, nitrogen and silicon lines, so we carefully preselected ‘clean’ parts suitable for matching to theoretical line profiles. Grids of theoretical spectra were calculated for – K and for the known s of the components of V453 Cyg. For these calculations we used atlas9 model atmospheres (Kurucz 1974) with a microturbulence velocity of km s-1 and solar metal abundances. The codes detail (Giddings 1981; Butler 1994) and surface (Butler 1984) were used for the non-LTE calculations – detail determines the atomic level populations by jointly solving the radiative transfer and statistical equilibrium equations, and surface computes the emergent fluxes and line profiles. Model atoms were used for H (Herrero 1987; Husfeld et al. 1989), He (Husfeld et al. 1989), \textC ii (Eber & Butler 1988), \textN ii (Becker & Butler 1989), \textO ii (Becker & Butler 1988), \textMg ii (Przybilla et al. 2001), \textAl iii (Dufton et al. 1986), and \textSi ii, \textSi iii and \textSi iv (Becker & Butler 1990).
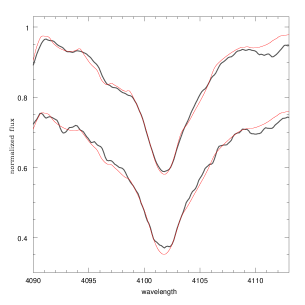
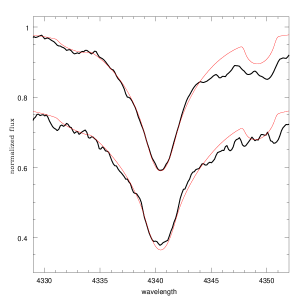
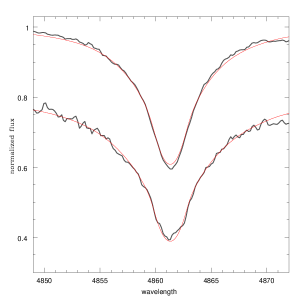
fortran programs have been developed which fit theoretical line profile to hydrogen lines by minimisation in . More weight was given to the H profile since it was derived using a dataset which contains a spectrum taken during mid-eclipse, and is covered by both the Calar Alto and the La Palma data sets. Parts of the profiles which are affected by metallic lines were excluded from the fit. The best fits were found for K and K, and are plotted in Fig. 2 for the H and H lines. These s are larger by 1.5 and 1.7 than the values found by SMS04, which can be ascribed to the importance of non-LTE effects at these temperatures. Note that this does not affect the light or RV curve analyses presented by SMS04.
While not used in deriving the above s, the lines of \textHe ii were examined for the reliability of the results. Our data cover three \textHe ii lines, at at 4199, 4541 and 4686. A broad and diffuse line at 4199 is barely visible in the primary star’s spectrum. The lines at 4541 and 4685 are consistent with derived primary but are better fitted with K (0.75 lower than found above). The match of the \textHe ii line at 4686 in the secondary’s spectrum with theoretical profiles for K is excellent.
The projected rotational velocities () of the components were derived from the widths of the clean spectral features due to \textC ii 4267, \textSi iii 4553, \textSi iii 4568, \textO ii 4591, \textO ii 4596, and \textO ii 4662, avoiding \textHe i and \textMg ii lines (Hensberge et al. 2000), using a set of the theoretical spectra calculated for different values. We find km s-1 and km s-1. These figures are in excellent agreement with those found by SMS04. The pseudo-synchronous rotational velocities are 110 km s-1 and 71 km s-1; the primary is therefore pseudo-synchronised but the secondary is rotating more quickly than expected.
In their abundance analysis of disentangled component spectra of the eclipsing and double-lined binary V578 Mon, a member of the Rosette nebula cluster NGC 2244, PH05 used a sharp-lined spectrum of the cluster member star #201 as a template spectrum. Vrancken et al. (1997) derived K and for this star, so it should be a good match to V453 Cyg B. A rotationally broadened spectrum of #201 closely resembles V453 Cyg B, which lends additional support to the s derived in this work.
As an independent check we have used Strömgren calibrations to obtain the mean of the system. The , and indices given by Crawford & Barnes (1974) and Reimann (1989) are in good agreement with each other, indicating that they are not affected by the photometric variability of V453 Cyg. The uvbybeta code was used to apply the calibration of Moon & Dworetsky (1985) to the Strömgren indices. We found a reddening of mag, which is in excellent agreement with the value of mag found by Massey, Johnson & DeGioia-Eastwood (1995) for NGC 6871, and a of 27 720 K. This value is a flux-weighted mean for the two stars because we do not have individual Strömgren indices for the two components, and is in good agreement with the values we find from the Balmer line profiles.
5.1.1 Implications of the new effective temperature measurements
Armed with the values determined above, we have calculated the distance to V453 Cyg using theoretical bolometric corrections published by Bessell, Castelli & Plez (1998) and by Girardi et al. (2002). We adopted the spectroscopic orbits of the two stars from Section 4 and the photometric parameters from SMS04. The two sources of bolometric corrections are in almost perfect agreement, and lead to a -band distance of pc and a -band value of pc. The uncertainty in the reddening towards V453 Cyg dominates the uncertainty in but is much less important for . This distance is not in good agreement with the value of pc found for NGC 6871 by Massey et al. (1995), but is consistent with other values in the literature.
We have compared the properties of V453 Cyg with several sets of theoretical models, but cannot find a good match for any of the chemical compositions for which models are available. Interestingly, the best (i.e. least bad) match is obtained with the Claret (1995) models for a ‘solar’ metal abundance (), a high fractional helium abundance of , and an age of 7.4 Myr. In this case the s and the radius of the primary star are correctly predicted, but the measured radius of the secondary star is a few sigma smaller than the model value. A new photometric analysis of V453 Cyg would help to investigate this discrepancy further.
5.2 Helium abundance
The spectra of early-B stars are rich in strong hydrogen and \textHe i lines. For the hottest B stars, \textHe ii lines become visible. The inclusion of non-LTE effects is important when determining the helium abundance of such stars, but its importance varies for different lines. The detail and surface codes use a model atom calculated including transitions up to (Przybilla & Butler 2001), so the 4471 and 4922 helium lines are calculated precisely but the diffuse 4026 and 4388 lines are calculated less precisely. 4713 is also reliable as it comes from a transition to level . As discussed in detail by Lyubimkov et al. (2004) regarding line broadening theory, the 4471 and 4922 lines are to be preferred for helium abundance determinations.
There is growing evidence that, in the calculation of helium line profiles, should be carefully investigated (Gies & Lambert 1992; McErlean, Lennon & Dufton 1999; Lyubimkov, Rostopchin & Lambert 2004). Therefore, an extended grid of theoretical spectra were calculated for the s and s found for the components of V453 Cyg and for helium abundances from – in steps of , and –20 km s-1 in steps of 5 km s-1.
First, we have used the approach of Lyubimkov et al. (2004) to simultaneously determine and . 4471 and 4922 were used for determining as they have only a slight dependence on . The 4713 line has a strong dependence on so was used to constrain this parameter once was determined. As before, minimisation was used. The results are given in Table 4 (columns 2 and 3). We find an enhanced helium abundance of for the primary star. It is evident that a large scatter between different \textHe i lines is present. The two largest values of the helium overabundance were obtained for the \textHe i 4471 and 4921 lines, i.e. the lines Lyubimkov et al. (2004) favoured in determination of the helium abundance in their sample. Conversely, we find a normal abundance of for the secondary star. These results are discussed further in Section 6.
| Line | (He) | free | (He) | fixed |
|---|---|---|---|---|
| 4026 | 0.0960.006 | 53 | 0.0810.008 | 15 (fix) |
| 4388 | 0.1130.008 | 72 | 0.0750.010 | 15 (fix) |
| 4471 | 0.1520.006 | 63 | 0.1030.006 | 15 (fix) |
| 4713 | 0.1180.009 | 72 | - | - |
| 4921 | 0.1340.009 | 82 | 0.0860.012 | 15 (fix) |
| mean | 0.1230.017 | 72 | 0.0860.012 | 15 (fix) |
Secondly, we have determined the helium abundances using the value of obtained from metallic lines, in particular oxygen. In hot OB stars the \textO ii lines are relatively strong and numerous, so are well suited to this purpose. was derived by requiring the abundances from individual \textO ii lines to be independent of the line strengths. The equivalent widths were measured for 22 \textO ii lines which are not severely blended. We find km s-1.
It is well documented by previous studies that the tends to be larger for lower surface gravities (e.g. Kilian 1992; Vrancken et al. 2000; Daflon et al. 2004 and references therein). In the sample of nine slowly-rotating Cephei stars recently analyzed by Morel et al. (2008), three stars have km s-1, whilst the full range of is 1–14 km s-1. All of these objects are in similar evolutionary state as V453 Cyg A () so our derived should be reliable.
Theoretical \textHe i line profiles were calculated for –0.15 and km s-1. The and were taken from Section 5.1. The best fit by minimisation is a mean helium abundance which is considerably different from results obtained with as a free parameter. The mean helium abundance in the primary’s photosphere from the four \textHe i lines is , almost equal to the canonical solar helium abundance []. The importance of this result is discussed in Section 6.
5.3 Metals
5.3.1 Primary star
Determination of the of the primary star also yielded an oxygen abundance of . This estimate is obtained from 22 \textO ii lines, and the quoted error is the rms around the mean. The abundances of the other elements were estimated from fitting synthetic spectra to the disentangled spectrum of the primary star. A grid of synthetic spectra were calculated for the parameters of the star and different elemental abundances. The was fixed to 15 km s-1, the value found from fitting the star’s oxygen lines.
About ten lines were available for the estimates of the abundances for nitrogen and silicon. The majority of N lines are blended by \textO ii lines, but show a good interagreement for an abundance (11 lines). By contrast, our measurement of the Si abundance (, 9 lines) suffers from a larger scatter in results for individual lines. The strong \textSi iii triplet at 4550 to 4580 give larger abundances than the weak \textSi iii lines on the far blue wing of H. This could be due to an incorrect or to contamination by the H line. Interestingly, the analysis of Cephei stars by Morel et al. (2008), also shows the largest dispersion in abundances for Si. This issue is also discussed by Trundle et al. (2008) who used silicon lines for deriving .
Only four carbon lines are present in our spectra: the strong \textC ii 4267, the weaker \textC iii 4186, and two \textC ii lines at 4650–4680 which are heavily blended with \textO ii lines. Our estimated C abundance (Table 5) suffers from the small number of useful lines and also from the quality of the available model atom (Trundle et al. 2008; Nieva & Przybilla 2008).
The only visible magnesium line in the spectrum of the primary star is \textMg ii 4481, which is blended with \textAl iii 4479. Aluminium is also detectable through other two lines (\textAl iii 4512 and 4532). The abundances of Mg and Al were derived by calculating theoretical spectra fitting blended line profiles in the 4477–4484 Å region. The best match was found for and . The other two \textAl iii lines give abundances consistent with this.
Beside intrinsic (random) errors, several systematic errors affect the determination of abundances, such as uncertainties in the atmospheric parameters (, and ) and in fundamental atomic data ( values). Morel et al. (2006) and Trundle et al. (2007) have discussed these problems, and we have adopted their approach in estimating the overall uncertainties in our abundance measurements. We repeated our abundance analysis using synthetic spectra with atmospheric parameters modified by K, and km s-1. The uncertainty in the s of V453 Cyg is only 0.01 dex, so is negligible here. The overall uncertainties in the abundances for the primary star (Table 5) include the line-to-line scatter and the effects of changes in and . The error budget was calculated only for O, N and Si, for which sufficient lines are present in the primary star’s spectrum. For the other elements, a conservative upper limit on the total error of 0.20 dex is assigned.
5.3.2 Secondary star
We have so far concentrated on the primary star, as its mass and evolutionary state are astrophysically very interesting. We now measure elemental abundances for the secondary star by differential analysis. In the study of the dEB V578 Mon, PH05 devised a complete methodology for the determination of elemental abundances from disentangled spectra of high-mass stars. Special attention was given to the minimisation of systematic errors arising from continuum placement. The abundance determinations were made relative to rotationally broadened spectra of a slowly-rotating star which was otherwise similar to the components of the binary. A detailed examination of the spectra and comparison to template spectra made it possible to extract the blended line profiles. Here we use the same methodology and wavelength ranges as in PH05.
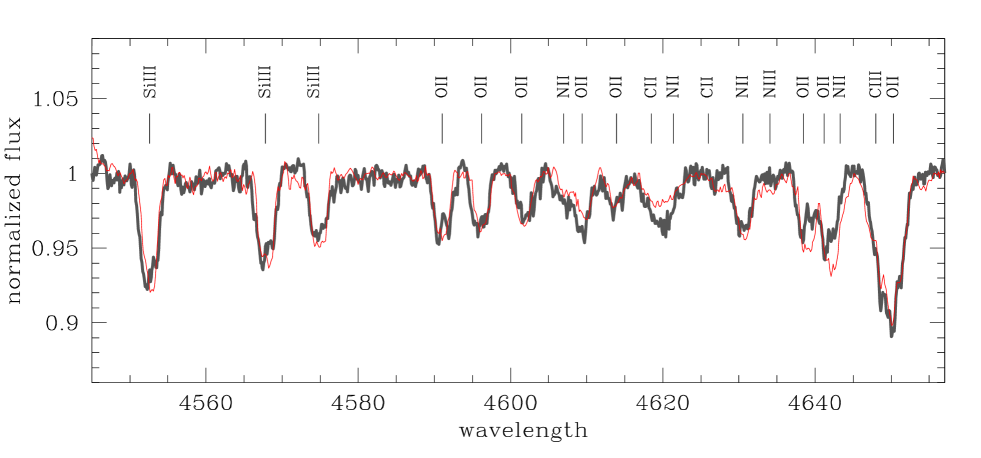
V453 Cyg B ( K) closely resembles V578 Mon B ( K). Their surface gravities differ by only 0.15 dex and their rotational velocities are similar, so a direct comparison of their spectra is possible. Fig. 3 is a plot of the 4635–4657 spectral region for the two stars, which contains a complex blend of \textO ii, \textN ii, \textN iii, \textC ii, \textC iii and \textSi iv lines.
There is striking similarity of both spectra throughout the observed spectral windows. Some slight differences can be found, and it is almost certain that these are intrinsic to the stars rather than an artifact of spd. For comparison synthetic spectra have been calculated for elemental abundances of an ’average’ main-sequence B star; mean values of the abundances are , , , and (Daflon, Cunha & Becker 2004). The spectra of both stars closely follow the characteristics of the synthetic spectrum. The elemental abundances of V578 Mon B resemble ’average’ B-dwarf abundances in the quoted errors (PH05, their table 3).
As V453 Cyg is a probable member of the open cluster NGC 6871, which is part of the Cyg OB3 association, we can compare our results with the work of Daflon et al. (2001). These authors determined elemental abundances of OB stars in five OB associations. Spectra of eights objects from Cyg OB3 were obtained, but final analyses were performed for only three sharp lined targets444V453 Cyg was included in the study by Daflon et al. (2001), who found K and . The composite nature of the spectra was not accounted for, so these quantities are not reliable..
The results of Daflon et al. (2001) for the stars in Cyg OB3 are: , , , , . Our quantities for both V453 Cyg A and V453 Cyg B are in excellent agreement with these figures.
| Abundance | Primary | Secondary | OB stars |
|---|---|---|---|
| H/He | 0.0940.015 (4) | 0.0980.011 | 0.10 |
| 8.150.20 (2) | 8.300.12 | 8.2 | |
| 7.800.10 (11) | 7.600.10 | 7.6 | |
| 8.580.12 (22) | 8.550.05 | 8.5 | |
| 7.580.20 (1) | 7.500.10 | 7.4 | |
| 7.270.16 (9) | 7.250.12 | 7.2 | |
| 6.120.20 (3) | - | 6.1 |
6 Discussion
Due to the serious problems of line blending and high rotational velocities, abundances have been measured for only a few high-mass stars in double-lined binary systems. Prior to the invention of spd (Simon & Sturm 1994) some helium abundances in high-mass binaries were determined from equivalent widths measured using Gaussian fitting (Lyubimkov 1998; Pavlovski 2004 and references therein). The use of spd has allowed helium abundances to be measured for four close binaries: DH Cep (Sturm & Simon 1994), Y Cyg (Simon et al. 1994), V578 Mon (Hensberge et al. 2000), and DW Car (Southworth & Clausen 2007). Preliminary results have also been announced for V380 Cyg (Pavlovski et al. 2005), and V478 Cyg and CW Cep (Pavlovski & Tamajo 2007). Finally, Freyhammer et al. (2001) have derived helium abundances for the components of CPD 59∘2628 by fitting theoretical spectra.
Lyubimkov et al. (2004) found an enrichment of helium during the MS evolution of their sample of stars, although many theoretical evolutionary models (e.g. Schaller et al. 1992) predict no surface enrichment of helium or other CNO-cycle elements. However, more recent theoretical studies (Maeder & Meynet 2000; Heger & Langer 2000) have found that rotationally induced mixing can affect the chemical composition of the surface layer of high-mass stars even whilst they are on the MS. Due to CNO processing in the stellar core, He and N should be enriched and C and O depleted. The strength of these effects depends on initial rotational velocity, so observational constraints can be used to both calibrate theoretical models and check their predictions (e.g. Venn et al. 2000).
The observations of 100 Galactic B stars by Lyubimkov et al. (2000, 2004) have confirmed that helium overabundance is correlated with stellar age expressed as a fraction of its MS lifetime. Large spectroscopic surveys of OB stars in our Galaxy and the Large and Small Magellanic Clouds (Hunter et al. 2008) have further confirmed this effect at a range of metallicities. Unfortunately, investigations using single stars suffer from the low accuracy with which their masses, radii and ages can be measured. Further work must therefore concentrate on binary stars, where all these properties can be measured to within a few percent (e.g. SMS04).
The subsample of high-mass stars in the sample of OB stars studied by Lyubimkov et al. (2004) show helium enrichment during their MS lifetimes, which has been found previously for close binaries (see Lyubimkov 1998 and references therein). In two recent studies in which large samples of B stars were analysed, progressively increasing helium enrichment from the ZAMS to the TAMS was found (Lyubimkov et al. 2004, Huang & Gies 2006). Both studies saw this effect over their whole mass ranges, with large enrichments for high-mass stars. Moreover, Huang & Gies noted that the effect is large among the faster rotators (see their fig. 12). Lyubimkov et al. derived both from helium lines and from \textO ii, while Huang & Gies (working with only a limited spectral range around H) accepted km s-1 for all their sample after considering the discussion of in Lyubimkov et al. (2004). Therefore, the agreement achieved by these studies may depend on their use of a common .
So far, in the sample of OB binaries studied by spd and cited above, no MS star has been found to have a helium enrichment. To this list we add now both components of V453 Cyg. The ages of the stars on the list lie between 0 and 0.8 of their MS lifetimes, with V453 Cyg A contributing the upper limit. Possible explanations for the non-detection of any changes in elemental abundances are moderate rotational velocity and tidal effects between the components. In this context it is interesting that detailed abundance analyses of about a dozen Cephei stars (Morel et al. 2006) has given an average helium abundance of , with a range from to . These objects are slowly-rotating stars in advanced phases of their MS lifetimes and do not show enhanced helium abundances. The and of V453 Cyg A fall within the range of their sample, and this star also does not show enhanced helium. These two results are in excellent agreement and corroborate previous finding of Herrero et al. (1992), who found a very clear dependence of helium enrichment on rotational velocity, but not on fractional lifetime on the MS, for O-type stars.
In Section 5.2 we determined the He abundance in V453 Cyg A by two approaches: (i) simultaneous line-profile fitting allowing to be a free parameter; (ii) fixing to the value obtained from \textO ii lines. When using a fixed we found a normal helium abundance (), but when was a free parameter we found a helium overabundance () and also erratic metal abundances. We therefore reject the helium enrichment scenario and caution that it is crucial to carefully consider the value of in similar studies.
7 Summary
Binary and multiple stellar systems are our primary source of fundamental measurements of the basic physical properties of stars. Modern observational data and analytical tools allow us to determine stellar masses and radii with accuracies of 1% or better, which in turn yields surface gravity measurements accurate to a few hundredths of a dex. When combined with advanced spectroscopic and abundance analysis techniques it is now possible to perform detailed tests of the rotation and magnetic effects included in modern theoretical evolutionary models.
In this work we have studied the eclipsing double-lined spectroscopic binary V453 Cyg, a system which contains two stars with accurately measured masses and radii. V453 Cyg A is approaching the TAMS and V453 Cyg B has completed about half of its MS phase. These characteristics make V453 Cyg ideal for testing the MS chemical evolution of high-mass stars, which is affected by convection, rotational mixing, and magnetic fields.
Through spd of several sets of phase-resolved high-resolution spectroscopy we have obtained the individual spectra of the two stars. By fitting the hydrogen line profiles with non-LTE synthetic spectra, we have measured the effective temperatures for the two stars to be K and K. The high precision of these measurements was achieved because the surface gravities of the two stars are known to within 0.01 dex (SMS04). The s are larger than have been found previously, and are supported by the Strömgren photometric indices of the system.
The new values imply a distance of pc to V453 Cyg (using theoretical bolometric corrections), which is in good agreement with most literature values but still shorter than the distance of pc found for NGC 6871 by Massey et al. (1995). The predictions of theoretical stellar evolutionary models are unable to match the properties of V453 Cyg.
Using the disentangled spectra we have measured the helium and metal abundances in the photospheres of the two stars by fitting non-LTE synthetic spectra to the observed line profiles. The metal abundances for the secondary star were estimated by differential analysis to a template star of similar and . We find that the helium in the photosphere of the primary has a solar abundance if we adopt a microturbulent velocity obtained from metallic lines. This result does not contradict evolutionary calculations (Meynet & Maeder 2000; Heger & Langer 2000) because a slight helium enrichment is predicted only for highly rotating stars, and/or after TAMS. Also, as is expected for the stars which were formed from the same interstellar material, no significant difference in the chemical composition between the two components is apparent. Their photospheric abundances resemble those of the typical Galactic OB stars (c.f. Herrero 2003 and references therein).
We are planning to extend our analysis to larger numbers of spectral lines, which will require new spectroscopic observations with a wider wavelength coverage. This will make it possible to refine the present abundance analysis, and to address more thoroughly the question of which to adopt for different ions. Échelle spectroscopic observations will be well suited to this task.
Acknowledgements
We would like to thank Dr. Klaus Simon who kindly put spectra of V453 Cyg, obtained at German-Spanish Astronomical Centre on Calar Alto, Spain, at our disposal. We would also like to thank Dr. Herman Hensberge for contributing a spectrum of NGC 2244 #201. We are grateful to Prof. Artemio Herrero for careful and critical reading of the first draft. Thanks are also due to Dr. Simon Daflon and Dr. Thierry Morel for illuminating discussions. Research by KP is funded through a research grant from Croatian Ministry of Science & Education. JS acknowledges financial support from STFC in the form of a postdoctoral research associate position.
References
- [] Andersen J., 1975, A&A, 44, 355
- [] Andersen J., 1991, A&AR, 3, 91
- [] Becker S.R., Butler K., 1988, A&A, 201, 232
- [] Becker S.R., Butler K., 1989, A&A, 209, 244
- [] Becker S.R., Butler K., 1990, A&A, 235, 326
- [] Bessell M. S., Castelli F., Plez B., 1998, A&A, 333, 231
- [] Butler K., 1984, PhD Thesis, University of London
- [] Claret A., 1995, A&AS, 109, 441
- [] Claret A., Giménez A., 1993, A&A, 277, 487
- [] Cohen H.L., 1974, A&AS, 15, 181
- [] Crawford D.L., Barnes J.V., 1974, AJ, 79, 623
- [] Daflon S., Cunha K., Becker S., Smith V.V. 2001, ApJ, 552, 309
- [] Daflon S., Cunha K, Becker S. 2004, ApJ, 604, 362
- [] Dufton P.L., Brown P.J.F., Lennon D.J., Lynas-Gray A.E., 1986, MNRAS, 222, 712
- [] Eber F., Butler K., 1988, A&A, 202, 153
- [] Evans C.J., Smartt S.J., Lee J.-K., et al., 2005, A&A, 437, 467
- [] Freyhammer L.M., Clausen J.V., Artentoft T., Sterken C., 2001, A&A, 369, 561
- [] Giddings J., 1981, PhD Thesis, University of London
- [] Gies D.R, Lambert, D.L., 1992, ApJ, 387, 673
- [] Girardi L., Bertelli G., Bressan A., Chiosi C., Groenewegen M. A. T., Marigo P., Salasnich B., Weiss A., 2002, A&A, 391, 195
- [] Guinan E.F., Fitypatrick E.L., Dewarf L.E., et al., 1998, ApJ, 509, L21
- [] Hadrava P., 1995, A&AS, 95, 101
- [] Heger A., Langer N., 2000, ApJ, 544, 1016
- [] Hensberge H., Pavlovski K., 2007, IAU Symp. 240, 136
- [] Hensberge H., Pavlovski K., Verschueren W., 2000, A&A, 358, 553
- [] Herrero A., 1987, A&A, 171, 189
- [] Herrero A., 2003, ASP Conf. Ser. 304, 10
- [] Herrero A., Kudritzki R.P., Vilchez J.M., Kunze D., Butler K., Haser S., 1992, A&A, 261, 209
- [] Hilditch R.W., 2004, ASP Conf. Ser., 318, 198
- [] Holmgren D.E., Hadrava P., Harmanec P., Koubský P., Kubát J., 1997, A&A, 322, 565
- [] Huang W., Gies D.R., 2006, ApJ, 648, 591
- [] Hunter I., Brott I., Lennon D., et al., 2008, ApJ, 676, L29
- [] Husfeld D., Butler K., Heber U., Drilling J.S., 1989, A&A, 222, 150
- [] Ilijić S., Hensberge H., Pavlovski K., Freyhammer, L.M., 2004, ASP Conf. Ser., 318, 111
- [] Kilian J., 1992, A&A, 262, 171
- [] Lyubimkov L.S., 1998, Astron. Rep., 42, 52
- [] Lyubimkov L.S., Lambert D.L., Rachkovskaya T.M., et al., 2000, MNRAS, 316, 19
- [] Lyubimkov L.S., Rostopchin S.I., Lambert D.L., 2004, MNRAS, 351, 745
- [] Lyubimkov L.S., Rostopchin S.I., Rachkovskaya T.M., Poklad D.B., Lambert D.L., 2005, MNRAS, 358, 193
- [] Maeder A., Meynet G., 2000, ARA&A, 38, 143
- [] Massey P., Johnson K. E., DeGioia-Eastwood K., 1995, ApJ, 454, 151
- [] McErlan N.D., Lennon D.J., Dufton P.L., 1999, A&A, 349, 553
- [] Meynet G., Maeder, A., 2000, A& A, 361, 101
- [] Moon T. T., Dworetsky M. M, 1985, MNRAS, 217, 305
- [] Morel T., Butler K., Aerts C., Neiner C., Briquet M., 2006, A&A, 457, 651
- [] Morel T., Hubrig S., Birquet M., 2008, A&A, 481, 453
- [] Pavlovski K., 2004, ASP Conf. Ser., 318, 206
- [] Pavlovski K., Hensberge H., 2005, A&A, 439, 309 (PH05)
- [] Pavlovski K., Tamajo E., 2007, IAU Symp. 240, 209
- [] Pavlovski K., Holmgren D.E., Koubský P., Southworth J., Yang S., 2006, Ap&SS, 304, 329
- [] Przybilla N., Butler K., 2001, A&A, 379, 955
- [] Reimann H.-G., 1989, AN, 310, 273
- [] Ribas I., Jordi C., Vilardell F., Fitzpatrick E.L., Hilditch R.W., Guinan E.F., 2005, ApJ, 635, L37
- [] Samland M., 1998, ApJ, 496, 155
- [] Schaller G., Schaerer D., Meynet G., Maeder A., 1992, A&AS, 96, 269
- [] Simkin S.M., 1974, A&A, 31, 129
- [] Simon K.P., Sturm E., 1994, A&A, 281, 286
- [] Simon K.P., Sturm E., Fiedler A., 1994, A&A, 292, 507
- [] Southworth J., Clausen J.V., 2007, A&A, 461, 1077
- [] Southworth J., Bruntt H., Buzasi D.L., 2007, A&A, 467, 1215
- [] Southworth J., Maxted P.F.L., Smalley B., 2004a, MNRAS, 349, 547
- [] Southworth J., Maxted P.F.L., Smalley B., 2004b, MNRAS, 351, 1277 (SMS04)
- [] Southworth J., Zucker S., Maxted P.F.L., Smalley B., 2004c, MNRAS, 355, 986
- [] Southworth J., Maxted P.F.L., Smalley B., 2005, A&A, 429, 645
- [] Sturm E., Simon K.P., 1994, A&A, 282, 93
- [] Tonry J., Davis M., 1979, AJ, 84, 1511
- [] Trundle C., Dufton P.L., Hunter I., et al., 2007, A&A, 471, 625
- [] Venn K.A., Brooks A.M., Lambert D.L., et al., 2002, ApJ, 565, 571
- [] Vrancken M., Hensberge H., David M., Verschueren W., 1997, A&A, 320, 878
- [] Vrancken M., Lennon D.J., Dufton P.L., Lambert D.I., 2000, A&A, 358, 639
- [] Yang M.C.K., Robinson D.H., 1986, Understanding and Learning Statistics by Computer, World Scientific, Singapore
- [] Zucker S., Mazeh T., 1994, ApJ, 420, 806