Simultaneous H.E.S.S. and Chandra observations of Sgr A⋆
during an X-ray flare
The rapidly varying (10 minute timescale) non-thermal X-ray emission observed from Sgr A⋆ implies that particle acceleration is occuring close to the event horizon of the supermassive black hole. The TeV -ray source HESS J1745290 is coincident with Sgr A⋆ and may be closely related to its X-ray emission. Simultaneous X-ray and TeV observations are required to elucidate the relationship between these objects. We report on joint H.E.S.S./Chandra observations performed in July 2005, during which an X-ray flare was detected. Despite a factor of 9 increase in the X-ray flux of Sgr A⋆, no evidence is found for an increase in the TeV -ray flux from this region. We find that an increase in the -ray flux of a factor of 2 or greater can be excluded at a confidence level of 99%. This finding disfavours scenarios in which the keV and TeV emission are associated with the same population of accelerated particles and in which the bulk of the -ray emission is produced within cm (100) of the supermassive black hole.
Key Words.:
X-rays:individual sources:Sgr A*, gamma-rays:observations1 Introduction
Measurements of stellar orbits in the central parsec of our galaxy have revealed the existence of a supermassive, solar mass, black hole coincident with the radio source Sgr A⋆ Eisenhauer et al. (2005). The compact nature of Sgr A⋆ has been demonstrated both by direct VLBI measurements Shen et al. (2005) and by the observation of X-ray and near IR flares with timescales as short as a few minutes (see for example Porquet et al. (2008), Eckart et al. (2006) and Porquet et al. (2003)). Variability on these timescales limits the emission region to within Schwarzschild radii () of the black hole. X-ray flares from Sgr A⋆ reach peak luminosities of erg s-1, two orders of magnitude brighter than the quiescent value Porquet et al. (2003); Baganoff et al. (2003), and exhibit a range of spectral shapes Porquet et al. (2008). Several models of the origin of this variable emission exist, many of which invoke non-thermal processes close to the event horizon of the central black hole to produce a population of relativistic particles (see e.g. Markoff et al. 2001; Yuan et al. 2003; Aharonian & Neronov 2005a; Liu et al. 2006a, b).
Model-independent evidence that ultra-relativistic particles exist close to Sgr A⋆ can be provided by the observation of TeV -rays from this source. Indeed, TeV -ray emission has been detected from the Sgr A region by several ground-based instruments Kosack et al. (2004); Tsuchiya et al. (2004); Aharonian et al. (2004); Albert et al. (2006). The most precise measurements of this source, HESS J1745290, are those performed using the H.E.S.S. telescope array. The centroid of the source is located from Sgr A⋆, and has an rms extension of Aharonian et al. (2006a), with work underway to reduce these uncertainties van Eldik et al. (2007).
TeV emission from Sgr A⋆ is expected in several models of particle acceleration in the environment of the black hole. In some of these scenarios Levinson & Boldt (2002); Aharonian & Neronov (2005a), TeV emission is produced in the immediate vicinity of the SMBH, and variability is expected. In alternative scenarios, particles are accelerated close to Sgr A⋆ but radiate within the central 10 parsec region Aharonian & Neronov (2005b), or are accelerated at the termination shock of a wind driven by the SMBH Atoyan & Dermer (2004). However, several additional candidate objects exist for the origin of the observed -ray emission. The radio centroid of the supernova remnant (SNR) Sgr A East lies from Sgr A⋆, only marginally inconsistent with the position of the TeV source presented by Aharonian et al. (2006a). Shell-type SNR are now well established TeV -ray sources Aharonian et al. (2007a, b) and several authors have suggested that Sgr A East is the origin of the TeV emission (see for example Crocker et al. 2005). However, improvements in the uncertainty in the centroid position of HESS J1745290 van Eldik et al. (2007) effectively exclude the possibility of Sgr A East being the dominant -ray source in the region. The pulsar wind nebula candidate G 359.950.04 discovered by Wang et al. (2006) is located only 9′′ from Sgr A⋆ and can plausibly account for the TeV emission Hinton & Aharonian (2007). Particle acceleration at stellar wind collision shocks within the central young stellar cluster has also been hypothesised to explain the -ray source Quataert & Loeb (2005). Finally, the possible origin of this source in the annihilation of WIMPs in a central dark matter cusp has been discussed extensively Hooper et al. (2004); Profumo (2005); Aharonian et al. (2006a).
Given the limited angular resolution of current VHE -ray telescopes, the most promising tool in identifying the TeV source is the detection of correlated variability between the -ray and X-ray, and/or NIR regimes. A significant increase in the flux of HESS J1745290, occuring simultaneously with a flare detected in a waveband with sufficient angular resolution to isolate Sgr A⋆, would unambiguously identify the -ray source. Therefore, whilst not all models of the TeV emission from Sgr A⋆ predict variability in the VHE source, coordinated IR/keV/TeV observations can be seen as a key aspect of the ongoing program to understand the nature of this enigmatic source.
2 Observations and Results
A coordinated multiwavelength observing campaign targeting Sgr A⋆ was performed during July/August 2005. As part of this campaign, observations with H.E.S.S. occurred for 4-5 hours each night from July 27 to August 1 (MJD 53578-53584). Four Chandra observations with IDs 5950-5954 took place between July 2 and August 2. A search for flaring events in the X-ray data yielded two significant events during the Chandra campaign, the first during observation (obs.) ID 5952 on July 29, and the second during obs. ID 5953 on July 30. The second of these flares occurred during a period of H.E.S.S. coverage and is described in detail here.
The 49 ks of ACIS-I data from obs. ID 5953 were analysed using CIAO version 3.4 and a light curve was extracted from a circular aperture of radius 2.5′′, centred on Sgr A⋆ (RA 17h45m40.039s, Dec. -29∘00′28.12′′). Consistent results were obtained using a 1.5′′ aperture. The background level was estimated from a surrounding region of 8.3′′ radius, offset by 5.8′′ to the East of Sgr A⋆ to avoid contamination from the stellar complex IRS 13 (Maillard et al. 2004) and G 359.950.04. All photons in the energy range of 300 eV to 8 keV were included in the analysis. The resulting background-subtracted light curve (with 400 s binning) is shown in Fig. 1. A significant flare, peaking at MJD , was detected. Before and after the flare the event rate was consistent with a constant value of () counts ks-1, which is consistent with the level found by Baganoff et al. (2003). The shape of the flare is well described by a Gaussian of full width half maximum (1.60.2) ks. No indication of additional variation or significant substructure was found when testing residuals with 200 s, 500 s, and 1500 s binning. The flare reached a peak level of () counts ks-1 (from the Gaussian fit), times the quiescent level. The flare duration is comparable with that of other flares detected previously from Sgr A⋆ (for example Eckart et al. 2006), and is amongst the brightest detected by Chandra so far with a net integrated signal of () counts.
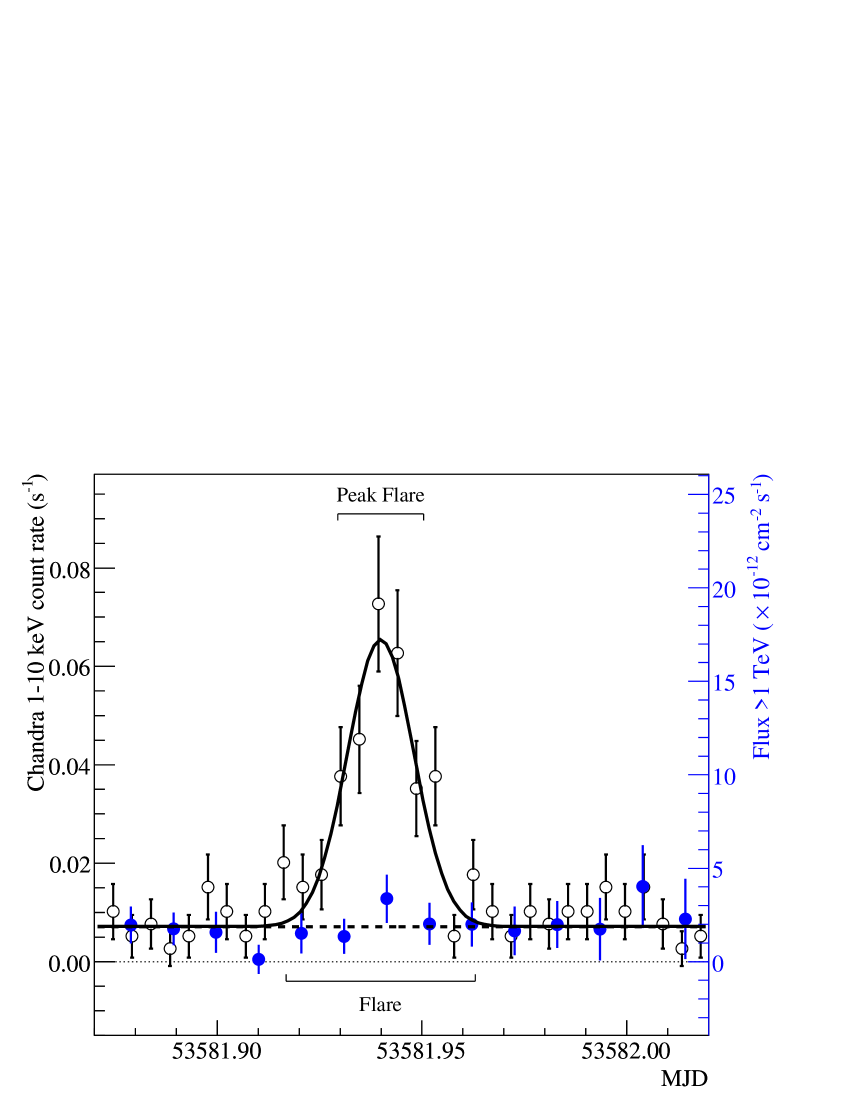
The -ray data consist of 72 twenty-eight minute runs, 66 of which pass all quality selection cuts described by Aharonian et al. (2006b). All runs on the night of the X-ray flare pass these cuts and we find no evidence for cloud cover in simultaneous sky temperature (radiometer) measurements (see Aharonian et al. 2006b; Le Gallou & H. E. S. S. Collaboration 2003). The data were analysed using the H.E.S.S. standard Hillas parameter based method with the standard -ray selection cuts (including a cut on angular distance from Sgr A⋆ of 6.7′) described in Aharonian et al. (2006b), resulting in an energy threshold of 160 GeV. There is no evidence of variations in the flux on timescales of days, and the mean -ray flux for this week of observations was () cm-2 s-1, consistent with the average value for H.E.S.S. observations in 2004, () cm-2 s-1 Aharonian et al. (2006a). An independent analysis based on the Model Analysis method described by de Naurois (2006), produced consistent results.
The time window for the -ray analysis is defined to be the region within of the best-fit peak time of the X-ray flare (containing % of the signal). The mean flux within this window (marked “Flare” in Figure 1) is () cm-2 s-1. This flux level is almost identical to the mean flux level for the entire week of observations. There is, therefore, no evidence for an increase in -ray flux of HESS J1745290 during the X-ray flare and a limit to the relative flux increase of less than a factor 2 is derived at the 99% confidence level. In principle, a (positive or negative) time lag might be expected between the X-ray flare and any associated -ray flare. The existence of a counterpart -flare with a flux increase of a factor (relative to the mean -ray flux level) requires a lag of at least 80 minutes (to fall outside the period of H.E.S.S. observations).
The results of a spectral analysis of the X-ray emission from Sgr A⋆ during obs. ID 5953 are presented in Table 1. Spectra are given for the entire period (Overall), intervals of ks (Flare) and ks (Peak Flare, ) around the maximum, and for the part of the dataset outside ks of the maximum (Quiescent). For all four data-sets, the background subtracted spectra were fitted with an absorbed power-law model using a fixed value of cm-2, as found from fitting the (Overall) dataset with free, which is consistent with the value found by Baganoff et al. (2003) of cm-2. The flare spectrum is harder than that found in the quiescent state (at the level). The quiescent state spectrum is consistent with that found previously Baganoff et al. (2003).
| /dof | |||
|---|---|---|---|
| Overall | 2.580.20 | 2.71 | 24.6/24 |
| Quiescent | 3.080.27 | 1.82 | 16.3/17 |
| Flare | 1.830.43 | 14.8 | 2.88/6 |
| Peak Flare | 1.700.41 | 19.0 | 3.1/5 |
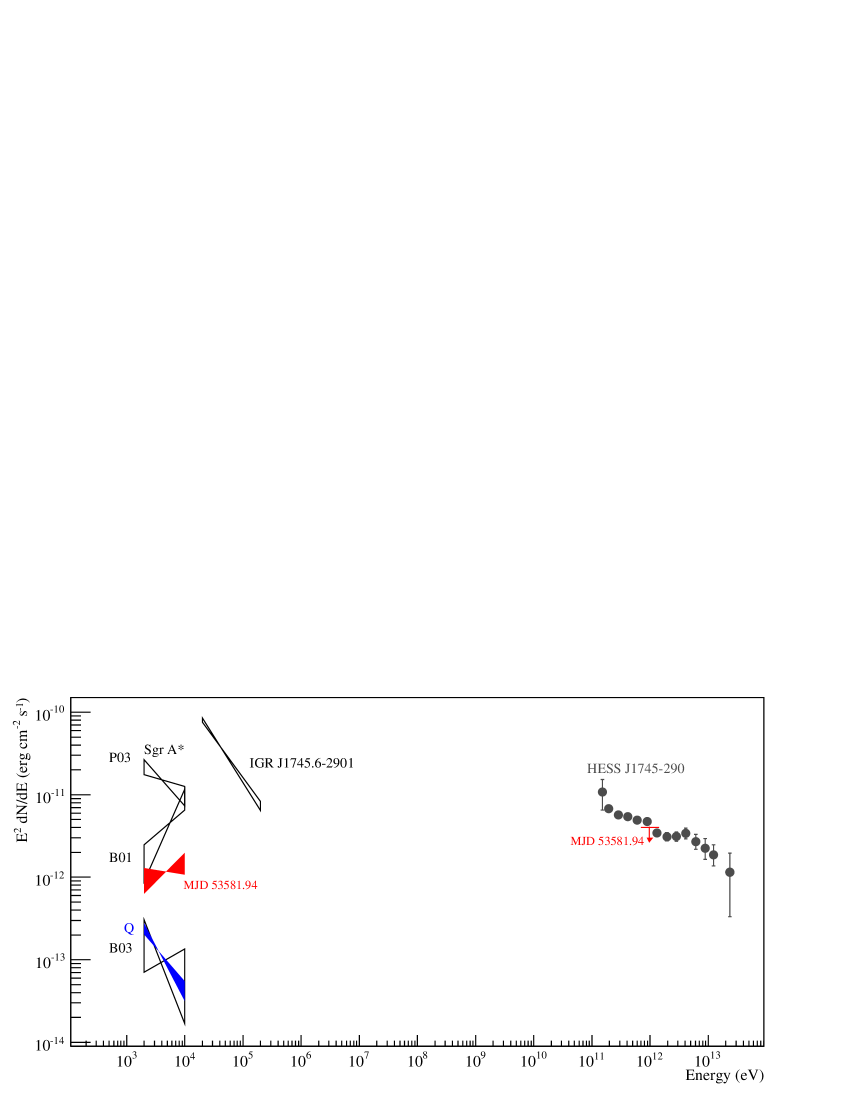
The simultaneous spectral energy distribution for the Galactic Centre from these observations is compared, in Fig. 2, with previous measurements of Sgr A⋆ and the possible high energy counterparts IGR J1745.62901 (Bélanger et al. 2004) and HESS J1745290.
3 Conclusion
The absence of a significant increase in the 160 GeV -ray flux of HESS J1745-290 during a major X-ray flare (corresponding to an increase in flux by a factor of approximately 9 at maximum) suggests strongly that the keV and TeV emission cannot be attributed to the same parent population of relativistic particles. A possible component of the -ray signal that has the same flaring behaviour as the X-rays is limited to a flux less than 100% of the quiescent state signal or erg s-1 cm-2 (2–10 TeV), which should be compared with the erg s-1 cm-2 2–10 keV flux during the same period ( the quiescent flux). The region of variable X-ray emission is limited by causality arguments to a size of or cm. Following Atoyan & Dermer (2004), the radiation energy density at these distances from Sgr A⋆ is erg cm-3. If the X-ray emission is interpreted as synchrotron emission of TeV electrons, then the flux limit to inverse Compton (IC) emission at VHE energies during the flare implies that and hence mG in this region. Since stronger magnetic fields are, in general, expected in this region (see e.g. Yuan et al. 2003), our result does not constrain models where the X-ray flares are assumed to be produced by synchrotron emission of relativistic electrons. We note that the arguments given above assume that the synchrotron flare is caused by an increase in the number of relativistic electrons. The alternative explanation that an increase in synchrotron emission occurs due to an impulsive increase in the magnetic field (with no direct effect on the IC flux) cannot be excluded.
The fact that HESS J1745290 does not appear to be associated with radiation processes within cm (or 100) of the supermassive black hole does not exclude all scenarios in which Sgr A⋆ is the acceleration site for the particles responsible for the TeV emission. Scenarios in which the energy losses of the accelerated particles occur much farther from Sgr A⋆ (for example Aharonian & Neronov (2005b), Atoyan & Dermer (2004) and Ballantyne et al. (2007)) remain viable explanations for this -ray source.
Acknowledgements.
The support of the Namibian authorities and of the University of Namibia in facilitating the construction and operation of H.E.S.S. is gratefully acknowledged, as is the support by the German Ministry for Education and Research (BMBF), the Max Planck Society, the French Ministry for Research, the CNRS-IN2P3 and the Astroparticle Interdisciplinary Programme of the CNRS, the U.K. Science and Technology Facilities Council (STFC), the IPNP of the Charles University, the Polish Ministry of Science and Higher Education, the South African Department of Science and Technology and National Research Foundation, and by the University of Namibia. We appreciate the excellent work of the technical support staff in Berlin, Durham, Hamburg, Heidelberg, Palaiseau, Paris, Saclay, and in Namibia in the construction and operation of the equipment. We would also like to thank the anonymous referee for his/her helpful comments.References
- Aharonian et al. (2004) Aharonian, F., Akhperjanian, A. G., Aye, K.-M., et al. 2004, A&A, 425, L13
- Aharonian et al. (2006a) Aharonian, F., Akhperjanian, A. G., Bazer-Bachi, A. R., et al. 2006a, Physical Review Letters, 97, 221102
- Aharonian et al. (2006b) Aharonian, F., Akhperjanian, A. G., Bazer-Bachi, A. R., et al. 2006b, A&A, 457, 899
- Aharonian et al. (2007a) Aharonian, F., Akhperjanian, A. G., Bazer-Bachi, A. R., et al. 2007a, A&A, 464, 235
- Aharonian et al. (2007b) Aharonian, F., Akhperjanian, A. G., Bazer-Bachi, A. R., et al. 2007b, ApJ, 661, 236
- Aharonian & Neronov (2005a) Aharonian, F. & Neronov, A. 2005a, ApJ, 619, 306
- Aharonian & Neronov (2005b) Aharonian, F. & Neronov, A. 2005b, Ap&SS, 300, 255
- Albert et al. (2006) Albert, J., Aliu, E., Anderhub, H., et al. 2006, ApJ, 638, L101
- Atoyan & Dermer (2004) Atoyan, A. & Dermer, C. D. 2004, ApJ, 617, L123
- Baganoff et al. (2001) Baganoff, F. K., Bautz, M. W., Brandt, W. N., et al. 2001, Nature, 413, 45
- Baganoff et al. (2003) Baganoff, F. K., Maeda, Y., Morris, M., et al. 2003, ApJ, 591, 891
- Ballantyne et al. (2007) Ballantyne, D. R., Melia, F., Liu, S., & Crocker, R. M. 2007, ApJ, 657, L13
- Bélanger et al. (2004) Bélanger, G., Goldwurm, A., Goldoni, P., et al. 2004, ApJ, 601, L163
- Crocker et al. (2005) Crocker, R. M., Fatuzzo, M., Jokipii, J. R., Melia, F., & Volkas, R. R. 2005, ApJ, 622, 892
- de Naurois (2006) de Naurois, M. 2006, astro-ph/0607247
- Eckart et al. (2006) Eckart, A., Baganoff, F. K., Schödel, R., et al. 2006, A&A, 450, 535
- Eisenhauer et al. (2005) Eisenhauer, F., Genzel, R., Alexander, T., et al. 2005, ApJ, 628, 246
- Hinton & Aharonian (2007) Hinton, J. A. & Aharonian, F. A. 2007, ApJ, 657, 302
- Hooper et al. (2004) Hooper, D., de la Calle Perez, I., Silk, J., Ferrer, F., & Sarkar, S. 2004, Journal of Cosmology and Astro-Particle Physics, 9, 2
- Kosack et al. (2004) Kosack, K., Badran, H. M., Bond, I. H., et al. 2004, ApJ, 608, L97
- Le Gallou & H. E. S. S. Collaboration (2003) Le Gallou, R. & H. E. S. S. Collaboration. 2003, in International Cosmic Ray Conference, 2879
- Levinson & Boldt (2002) Levinson, A. & Boldt, E. 2002, Astroparticle Physics, 16, 265
- Liu et al. (2006a) Liu, S., Melia, F., & Petrosian, V. 2006a, ApJ, 636, 798
- Liu et al. (2006b) Liu, S., Melia, F., Petrosian, V., & Fatuzzo, M. 2006b, ApJ, 647, 1099
- Maillard et al. (2004) Maillard, J. P., Paumard, T., Stolovy, S. R., & Rigaut, F. 2004, A&A, 423, 155
- Markoff et al. (2001) Markoff, S., Falcke, H., Yuan, F., & Biermann, P. L. 2001, A&A, 379, L13
- Porquet et al. (2008) Porquet, D., Grosso, N., Predehl, P., et al. 2008, A&A, 488, 549
- Porquet et al. (2003) Porquet, D., Predehl, P., Aschenbach, B., et al. 2003, A&A, 407, L17
- Profumo (2005) Profumo, S. 2005, Phys. Rev. D, 72, 103521
- Quataert & Loeb (2005) Quataert, E. & Loeb, A. 2005, ApJ, 635, L45
- Shen et al. (2005) Shen, Z.-Q., Lo, K. Y., Liang, M.-C., Ho, P. T. P., & Zhao, J.-H. 2005, Nature, 438, 62
- Tsuchiya et al. (2004) Tsuchiya, K., Enomoto, R., Ksenofontov, L. T., et al. 2004, ApJ, 606, L115
- van Eldik et al. (2007) van Eldik, C., Bolz, O., Braun, I., et al. 2007, ArXiv e-prints, 0709.3729
- Wang et al. (2006) Wang, Q. D., Lu, F. J., & Gotthelf, E. V. 2006, MNRAS, 367, 937
- Yuan et al. (2003) Yuan, F., Quataert, E., & Narayan, R. 2003, ApJ, 598, 301