On the antimatter signatures of the cosmological dark matter subhalos
Abstract
While the PAMELA collaboration has recently confirmed the cosmic ray positron excess, it is interesting to review the effects of dark matter (DM) subhalos on the predicted antimatter signals. We recall that, according to general subhalo properties as inferred from theoretical cosmology, and for DM with constant annihilation cross section, the enhancement cannot be 20 for the antimatter yield. This bound is obviously different from that found for -rays. We also recall some predictions for supersymmetric benchmark models observable at the LHC and derived in the cosmological N-body framework, showing in the meantime the existing discrepancy between profiles derived from N-body experiments and the current observations of the Milky Way.
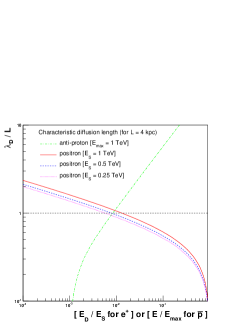
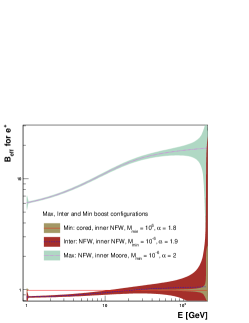
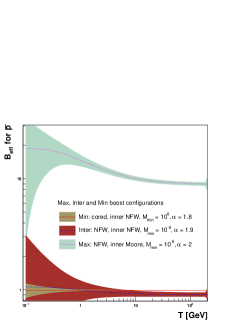
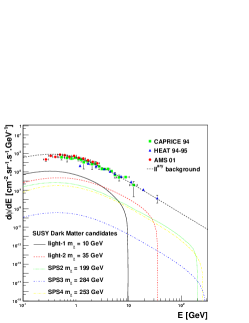
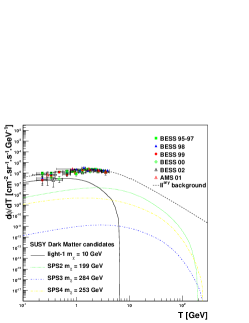
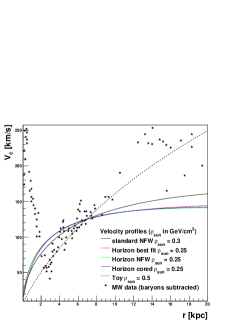
The positron () cosmic ray (CR) fraction has recently drawn considerable attention due to the confirmation of a excess reported by the PAMELA collaboration up to 270 GeV (Adriani et al., 2008). While the amplitude of this excess is unclear according to the most recent predictions of the secondary flux at the Earth (Delahaye et al., 2008, where we have emphasized the role of the ’s), dark matter (DM) annihilation has been again proposed as a source of such , as it was already the case with the less clear HEAT excess ten years ago (Barwick et al., 1997; Baltz & Edsjö, 1998). However, this primary contribution usually needs to be amplified to fit the data, and most of the authors have invoked some ad hoc boost factor coming from the presence of DM substructures in the Milky Way (MW), which should indeed increase the average annihilation rate. Such subhalos are expected in the frame of hierarchical structure formation, and well resolved down to in cosmological N-body simulations as performed in the -CDM scheme. Here we shortly review the effects of DM clumps on the antimatter yield, focusing on and antiprotons (). We will not discuss the PAMELA fraction, since it is worth waiting for the release of the spectra themselves. The results and figures that we present here have been derived in (Lavalle et al., 2007, 2008b, 2008a), to which we refer the reader for more details and references. Relevant scales for and . As the DM distribution is usually found to exhibit a steep spatial dependence in N-body simulations, the knowledge of the typical CR propagation scale is useful: it characterizes the spatial extension over which the observed signal at the Earth is integrated, and depends on both the propagation model and the CR species. In the GeV-TeV energy range, CRs diffuse on the Galactic magnetic turbulences, which ensure their confinement in the MW in a region which can be extended by a few kpcs above and below the Galactic disk. They interact through various processes with the interstellar medium (ISM) and/or the interstellar radiation field (ISRF). When propagating, mostly experience spallation in the disk, where the ISM is located, and convection outward the disk. These processes are efficient at low energies GeV, while energy losses are almost irrelevant; reacceleration can also be neglected. obey to the same spatial diffusion as , but lose very quickly their energy, mostly through scattering on the ISRF. Their propagation is thus mainly set by the synchrotron and inverse Compton energy losses, of typical timescale Myr, which occur in the whole diffusion zone. Other processes can be neglected without loss of accuracy above a few GeV. This allows to infer the characteristic propagation lengths for and : and , where km/s is the convection velocity, and is the injected energy at the source, is the diffusion coefficient, with , being the normalization at GeV. The propagation length for a quickly increases with energy scaling like the diffusion coefficient . This is the opposite for , since the propagation length increases only as a loses its energy. This is illustrated in the left panel of Fig. 1. For , the characteristic propagation length is of order of a few kpcs, much lower than for , so the signal at the Earth comes from limited regions around, slightly enlarging as the detected energy decreases. Large integration volumes for () will be found at low (high) energy only, even reaching regions close to the Galactic center (GC). Therefore, local fluctuations of the injection rate mostly affect the high (low) energies for cosmic (). DM distribution in the MW and subhalos. The DM annihilation rate is set by the squared DM density. In the frame of -CDM cosmology, the DM distribution is found to be rather scale invariant and close to universal in N-body simulations, when baryons are not considered. This is the seminal result obtained by Navarro et al. (1997) (NFW), and confirmed, though with some scatter in the parameters, by many other groups since then. These scale invariant profiles are often given in the following spherical form: , where is a scale radius, the index will refer here to the Sun location, such that kpc and . A NFW profile corresponds to , and is usually found 20 kpc for MW-like objects. Although it makes sense to constrain the DM distribution from a top-down approach, it might sound risky to use such profiles, obtained without baryons, to make predictions at the sub-galactic scale, where baryons are expected to play a major role, but this has been done by many authors (including ourselves). Indeed, some observational constraints exist, so do many consistent dynamical modelings of the baryon component of the MW. In particular, Englmaier & Gerhard (2006) subtracted their baryon mass model to the velocity curves derived from CO and HI observations, and provided a set of data points on which one can directly constrain the DM contribution. In the right panel of Fig. 2, we show these data, on which we draw several density profiles. One is the NFW profile as employed for the MW, the others have been derived from fits on a N-body MW-like galaxy of the HORIZON project (Teyssier, 2002). These profiles clearly overestimate the central DM mass, so the DM annihilation rate close to the GC as well. While this will not affect that much the predictions for antimatter CRs, which are mostly set by the local density, this is instead expected to lower the -ray predictions. Now, we shortly turn to DM subhalos. For what concerns indirect detection of DM, the important features are their predicted spatial distribution, mass distribution and inner individual profile. There is no unique values predicted for these ingredients, so a way to estimate the theoretical uncertainties is to bracket each of them with the most extreme possibilities. As regards the spatial distribution, it is found antibiased with respect to the smooth profile in some N-body experiments (Diemand et al., 2007), which means , but we have also studied the case where subhalos track the smooth profile. The mass distribution is usually found close to , as expected in the linear theory, and seems reasonable. The minimal mass is set by the free streaming scale of DM particles at the collapsing time. For weakly interacting particles with masses GeV, the minimal clump mass is (Profumo et al., 2006), which will be taken as a minimum here. The mass function can be assumed to be independent of the spatial distribution, so that the subhalo number distribution will be given by , where is the total number of clumps in the MW. The inner subhalo profile is mainly featured by its inner logarithmic slope and the so-called concentration parameter. The latter is defined by , i.e. the ratio of the subhalo virial radius to the radius at which the logarithmic slope of the profile is -2, and is found to decrease with the subhalo mass. Different models exist, usually fitted on N-body data, and we use two extreme configurations which encompass the wide range of possibilities: one optimistic extrapolated from Bullock et al. (2001), and a second minimal from Eke et al. (2001), referred to as B01 and ENS01. Finally, the main quantity at stake when computing the antimatter flux is the intrinsic subhalo annihilation rate, which depends on its mass, concentration, and inner profile: , which has the dimension of a volume, and is normalized to the local rate. Note finally that clumps are not expected to be numerous in the central regions of the MW because of tidal disruption, and in any case not concentrated enough to dominate over the smooth annihilation rate there. Fluxes and boost factors. The antimatter CR flux originating from the smooth DM halo is given by , where depends on the DM particle properties (whose annihilation cross section is assumed constant), is the Green function associated with the CR propagation, and is the injected CR spectrum at the source. The flux due to subhalos is given by , where is the convolution of the Green function with the injected spectrum, and means the average over the relevant subhalo distribution (space or mass). The boost factor is given by , where is the fraction of the local density in forms of clumps. It does depend on the energy, because of the energy dependence of the propagation scale, which sets the integration volume. It is independent from the injected spectrum only for . It is useful to derive the local asymptotic limit of the boost factor, since this allows the computation of its maximal value. It is valid at short propagation scales, i.e. at high (low) energy for (): , where is neglected. This expression does not depend on the CR species, and provides a good way to check numerical computations. We have calculated the boost factors and associated statistical variances for and , by considering a flat spectrum for the former, and a 200 GeV monochromatic line for the latter. We have studied different subhalo configurations, and different propagation models. The latter test mainly influences the variance, slightly the energy dependence of the central values, since it only affects the propagation scales. The former is instead responsible for a huge scatter in the single clump luminosity, but, interestingly, the central values still lie in a small range, since the smooth component is found to dominate the overall signal in most of cases. As shown in the middle and right panels of Fig. 1, the maximal value obtained for both and is , which corresponds to the maximal clump configuration: clumps in the MW, of minimal mass of , steep mass distribution , spatially tracking the smooth NFW halo, with inner profiles and B01 concentrations. Such a configuration is theoretically very optimistic, so rather unlikely. Taking clumps of would give an asymptotic value of , which is still very weak, and considering a nearby very massive clump is unlikely and observationally constrained. The relative variance scales like , as expected: the number of sources is greater in larger volumes. Moreover, at large , the boost is close to 1 and the variance is small in any case, since the smooth contribution of the GC comes into play and dominates the signal, further shrinking the variance accordingly. We finally went beyond this analytical study by directly using a N-body galaxy from the HORIZON project, in which we could study more complex effects, e.g. density fluctuations (beside clumps themselves) or departure from spherical symmetry. We have quantified these effects to be small, and shown that a mere spherical smooth halo provides a good estimate of the antimatter fluxes. We show the predictions that we have derived for supersymmetric benchmark models observable at the LHC in Fig. 2. Why is the boost for -rays different from that of CRs ? The argument is actually very simple. Indeed, for -rays, the signal is integrated along a line of sight, within a solid angle featured by the angular resolution of the telescope. It is therefore very natural to find that the boost for -rays is a function of the Galactic latitude: at low latitude, one looks toward the GC, where the smooth DM contribution dominates over that of subhalos, and the boost is very small; this situation is reversed at high latitude, where the boost is much more important, while the absolute flux remains small (Bergström et al., 1999). For antimatter CRs, one integrates the signal over very different regions which are much more concentrated around the Earth, where clumps are not expected to dominate. These regions are bounded by the CR propagation scale, which depends on both the species and the energy. It is therefore not surprising at all to find results different from -rays, even when adopting exactly the same subhalo configuration. For comparison, the maximal boost of 20 obtained for CRs would give instead a maximum of a few hundreds for -rays. Conclusion. We have shown that subhalos are not expected to provide an important enhancement to the antimatter flux expected from DM annihilation originating from a smooth description of the halo. Instead, one of the most important uncertainties affecting the predictions on the absolute fluxes is the local DM density. We have also stressed the origin of the differences between the boosts as computed for CRs and for -rays: the signals are integrated over quite different regions for those different messengers. Finally, we have reminded that the usual description of the Galactic DM halo, as very often employed for predictions of indirect astrophysical imprints of DM annihilation, is not consistent with the current observational constraints, and may lead to over-optimistic expectations. While the effect will be important for -rays, this has less impact on the predictions for antimatter CRs which are less sensitive to the yield from the central regions of the MW. Acknowledgements. We warmly thank all of our collaborators having been involved in the derivation of the results summarized in this proceeding. In particular, we are grateful to J. Pochon, P. Salati and R. Taillet, with whom we performed the very early studies on the topic. We are also indebted to L. Athanassoula, X.-J. Bi, F.-S. Ling, D. Maurin, E. Nezri, R. Teyssier and Q. Yuan for further more detailed and complete analyses achieved afterward. We finally thank the organizers of the conference for having offered such a nice environment, which warmly benefited to the interesting discussions and even debates hold in the sessions.
References
- Adriani et al. (2008) Adriani, O., Barbarino, G. C., Bazilevskaya, G. A., et al. 2008, arXiv:0810.4995
- Baltz & Edsjö (1998) Baltz, E. A. & Edsjö, J. 1998, PRD 59, 023511
- Barwick et al. (1997) Barwick, S. W., Beatty, J. J., Bhattacharyya, A., et al. 1997, ApJL 482, L191+
- Bergström et al. (1999) Bergström, L., Edsjö, J., Gondolo, P., & Ullio, P. 1999, PRD 59, 043506
- Bullock et al. (2001) Bullock, J. S., Kolatt, T. S., Sigad, Y., et al. 2001, MNRAS 321, 559
- Delahaye et al. (2008) Delahaye, T., Donato, F., Fornengo, N., et al. 2008, arXiv:0809.5268
- Diemand et al. (2007) Diemand, J., Kuhlen, M., & Madau, P. 2007, ApJ 657, 262
- Eke et al. (2001) Eke, V. R., Navarro, J. F., & Steinmetz, M. 2001, ApJ 554, 114
- Englmaier & Gerhard (2006) Englmaier, P. & Gerhard, O. 2006, Celestial Mechanics and Dynamical Astronomy, 94, 369
- Lavalle et al. (2008a) Lavalle, J., Nezri, E., Ling, F. ., Athanassoula, L., & Teyssier, R. 2008a, PRD 78, 103526
- Lavalle et al. (2007) Lavalle, J., Pochon, J., Salati, P., & Taillet, R. 2007, A&A 462, 827
- Lavalle et al. (2008b) Lavalle, J., Yuan, Q., Maurin, D., & Bi, X.-J. 2008b, A&A 479, 427
- Navarro et al. (1997) Navarro, J. F., Frenk, C. S., & White, S. D. M. 1997, ApJ 490, 493
- Profumo et al. (2006) Profumo, S., Sigurdson, K., & Kamionkowski, M. 2006, PRL 97, 031301
- Teyssier (2002) Teyssier, R. 2002, A&A 385, 337