75282
22email: biscardi@oa-teramo.inaf.it
I. Biscardi
Optical SBFs of shell galaxies
Abstract
We measure Surface Brightness Fluctuations (SBFs) for a sample of distant shell galaxies observed with the Advanced Camera for Survey (ACS) on board of HST. To evaluate the distance at galaxies, theoretical SBF magnitudes for the ACS@HST filters are computed for single burst stellar populations covering a wide range of ages (t=1.5-14 Gyr) and metallicities (Z=0.008-0.04). Using these stellar population models we provide the first versus calibration. The results suggest that optical SBFs can be measured at using high resolution spatial optical data.
keywords:
galaxies: elliptical and lenticular, cD — galaxies: distances — galaxies: photometry — galaxies: fundamental parameters — cosmology: distance scale1 Introduction
The SBF method is a powerful technique to derive distance to galaxies as far as 130 Mpc with uncertainties lower then 10%. The SBFs can be evaluated for elliptical, spiral galaxies with prominent bulge and dwarf galaxies. An interesting case is represented by shell elliptical galaxies. Shell structures are considered robust indicator of past interactions events and the stellar population in the shell depends on the galaxy with which the merger has taken place (e.g. Malin & Carter (1983)) and on the time spent since the shell structure has formed. Then, it is reasonable to expect that the presence of shells might influence the SBF signal of the galaxy. In this respect, the high quality of ACS images is crucial to allow the measurement of SBF of the galaxy, even at high distances.
2 Data Analysis
To derive the SBF measurements from ACS images, we follow the procedure adopted in Cantiello et al. (2005, 2007) and Biscardi et al. (2008), that we can summarize as follow:
-
1.
Sky and galaxy-model subtraction.
-
2.
Removal of large residual background + shell features (residual frames determination).
-
3.
Photometry of external sources (globular cluster + background galaxies).
-
4.
Mask of the most prominent unsubracted shell, if necessary.
-
5.
Evaluation of the residual frame power spectrum, and its fitting using a PSF template power spectrum.
3 Stellar Population models and Calibrations
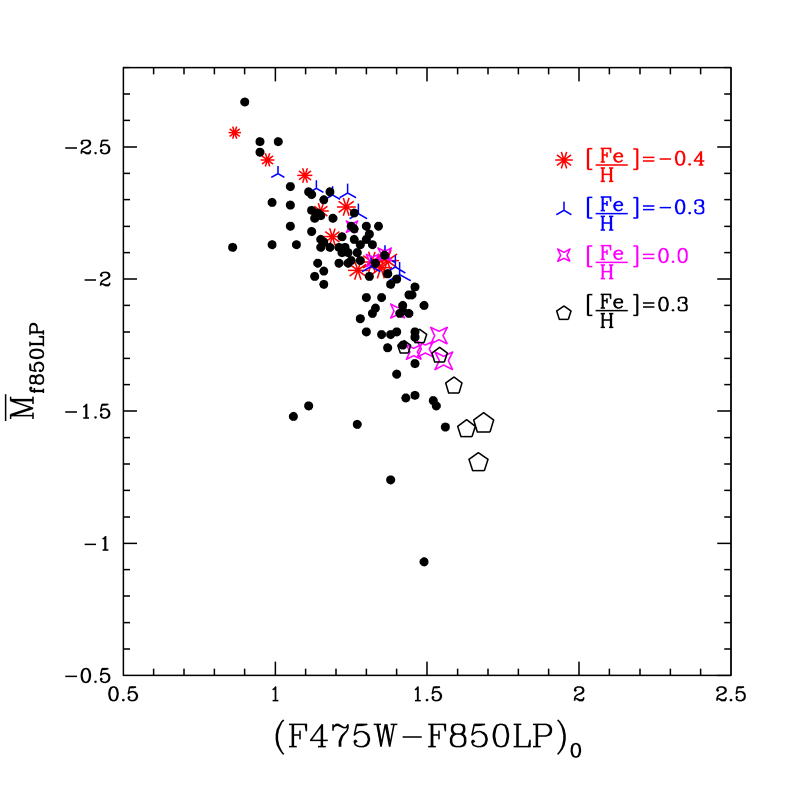
We provide new SBF predictions together with new calibrations of absolute SBF magnitudes for the ACS HST filters. These models, showed in Figure 1, are the most updated version of the code SPoT (Stellar Population Tools, Raimondo et al., 2005)111http://www.oa-teramo.inaf.it/SPoT and they are based on single-burst stellar population (SSP) of age ranging from t=1.5 Gyr up to t=14 Gyr and metallicity from Z=0.008 to Z=0.04.
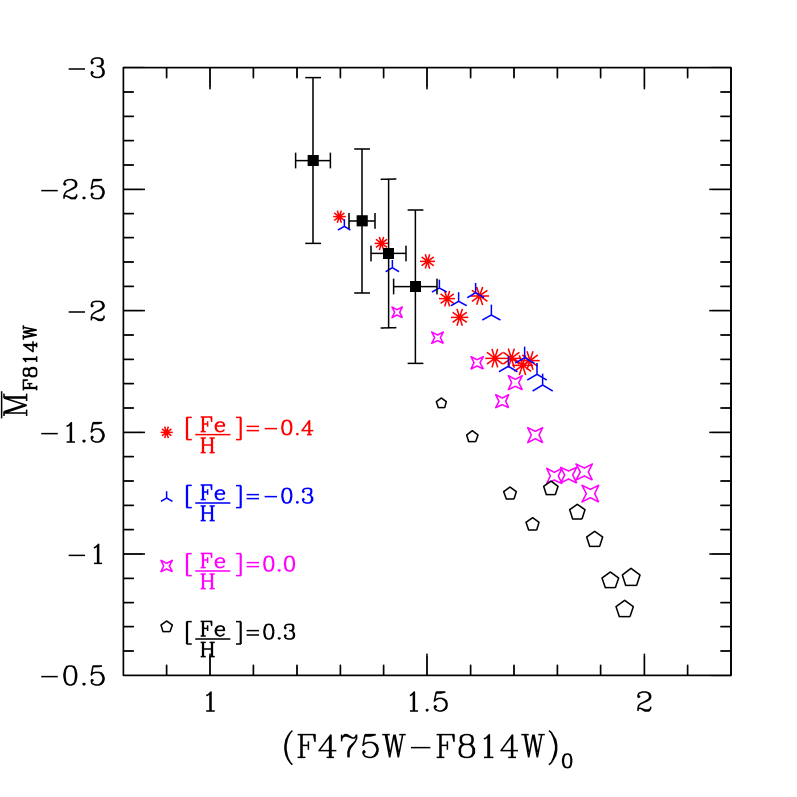
Using these SSP models we derive the following theoretical calibrations:
| (1) |
| (2) |
| (3) |
which provide a very good agreement when compared with observational data (Figure 2).
4 Distance and H0 determination
Coupling theoretical calibration (Eq. 1) and SBF measurements, the distance moduli are derived for the first time for the galaxies in Table LABEL:tab1. The present measurements show that distances of galaxies beyond 100 Mpc can be derived in optical filters, with SBF method.
| Galaxy | |
|---|---|
| PGC 6510 | 33.7 0.25 |
| PGC 10922 | 34.2 0.25 |
| PGC 42871 | 34.7 0.25 |
| PGC 6240 | 35.2 0.25 |
An estimation of is also obtained.
References
- Biscardi et al. (2008) Biscardi, I., Raimondo, G., Cantiello, M., & Brocato, E., 2008, ApJ, 678, 168
- Cantiello et al. (2005) Cantiello, M., Blakeslee, J. P., Raimondo, G., Mei, S., Brocato, E., & Capaccioli, M. 2005, ApJ, 634, 239
- Cantiello et al. (2007) Cantiello, M., Raimondo, G., Blakeslee, J. P., Brocato, E., & Capaccioli, M. 2007, ApJ, 662, 940
- Malin & Carter (1983) Malin, D. F., & Carter, D. 1983, ApJ, 274, 534
- Mei et al. (2007) Mei, S. et al. 2007, ApJ, 655, 144
- Raimondo et al. (2005) Raimondo, G., Brocato, E., Cantiello, M., & Capaccioli, M. 2005, AJ, 130, 2625