Disk reflection signatures in the spectrum of the bright Z-source GX 340+0 111Based on observations obtained with XMM-Newton, an ESA science mission with instruments and contributions directly funded by ESA Member States and NASA
Abstract
We present the preliminary results of a 50 ks long XMM-Newton observation of the bright Z-source GX 340+0. In this Letter we focus on the study of a broad asymmetric emission line in the Fe K energy band, whose shape is clearly resolved and compatible with a relativistically smeared profile arising from reflection on a hot accretion disk extending close to the central accreting neutron star. By combining temporal and spectral analysis, we are able to follow the evolution of the source along its Horizontal Branch. However, despite a significant change in the continuum emission and luminosity, the line profile does not show any strong correlated variation. This broad line is produced by recombination of highly ionized iron (Fe XXV) at an inferred inner radius close to 13 Rg, while the fit requires a high value for the outer disk radius. The inclination of the source is extremely well constrained at 35 deg, while the emissivity index is -2.50.
1 Introduction
GX 340+0 is a bright Low-Mass X-ray Binary (LMXB) belonging to the class of the Z sources (Hasinger & van der Klis, 1989), and its inferred luminosity is close to the Eddington limit (2 1038 erg/s for a 1.4 M⊙ NS). The source has also a radio counterpart, from which a distance of 11 3 kpc has been estimated (Penninx et al., 1993); radio emission from the counterpart is, however, highly variable, and seems to be correlated with the X-ray flux when the source is in its Horizontal Branch (HB), but anticorrelated on the other branches (Oosterbroek et al., 1994); it can also show periods of radio quenching, becoming extremely faint (Berendsen et al., 2000).
Temporal analysis studies have shown a complex phenomenology, linked to the accretion state, with characteristics typical of the Z-class (Jonker et al., 2000). The power spectrum shows a low-frequency (tens of Hz) quasi-periodic oscillation when the source resides on its HB (called Horizontal Branch Oscillation, HBO) while at higher frequencies the source shows, at the same time, twin kiloHz Quasi-Periodic Oscillations (kHz QPOs), whose centroid frequencies are correlated with the HBO peak frequency. Although no burst has been yet observed, the very fast timing variability (at more than 800 Hz) and the similarities with the other Z-sources indicate that the compact object is a neutron star.
The spectral properties of the source have not been fully investigated so far; Schulz & Wijers (1993) studied the 2–12 keV spectrum using EXOSAT data; the spectrum could be well described by a single component due to thermal Comptonization of soft photons, emerging from the NS surface, in a hot corona of moderately optical thickness ( 5–6);
Lavagetto et al. (2004) presented the first broadband (0.1–200 keV) spectrum of the source using data from a BeppoSAX observation. The spectrum could be decomposed into the sum of a soft thermal component of temperature of 0.5 keV, an optically thick Comptonized component, and an excess at energies above 20 keV that they fitted with a simple power law. A high resolution spectrum of the source was studied by Ueda et al. (2005), using a Chandra observation; Chandra data clearly showed the presence of an emission line, fitted with a simple Gaussian profile, at 6.57 keV with 40 eV equivalent width.
In this Letter we report the results of an XMM-Newton observation of GX 340+0. Thanks to the large collecting area of the EPIC-PN instrument and its good spectral resolution, we find evidence of a strong broad emission line at 6.7 keV; the line profile is very well reproduce by a smeared disk-reflected profile; we find, moreover, evidence ot other disk reflection signatures supporting the common scenario, valid for AGNs, galactic black hole and NS systems, that broad iron fluorescence lines are produced by reflection of photons from a hot corona on the surface of an accretion disk that extends very close to the compact object.
2 Observation, data reduction and spectral selection criteria
GX 340+0 was observed with XMM-Newton from 2007 September 2 at 13:18:00 to September 3 at 02:32:05 UTC, for a total observing time of 47640 s (Obs.ID 0505950101). However, because of the high count rate reached in the EPIC-PN CCDs during most of the observation, the effective exposure was reduced by data losses due to telemetry saturation. The total good time intervals, thus, resulted in 40562 s effective exposure. In this work we use data collected by the EPIC-PN instrument in fast timing mode; the source region (the background region) has been selected using CCD rows RAWX = 28-48 and RAWY = 0-200 (RAWX = 2-8 and RAWY = 0-200). No background flaring was present during the observation. We selected only events with PATTERN 4 (singles and doubles) and FLAG = 0 and restricted our analysis to the energy range 2.2–11.8 keV. We excluded data from PN below 2.2 keV and rely on the Reflection Grating Spectrometers (RGS1 and RGS2, in the 0.4–2.0 keV energy band) for the soft energy band, because PN data present strong systematic residuals of instrumental origin which affect the overall continuum determination. PN data have been progressively rebinned to avoid data oversampling; RGS data are rebinned in order to have at least 25 counts per energy channel. Source, background spectra and response matrices were extracted using the XMM-Newton Science Analysis Software (SAS, ver. 7.1.0). Spectral analysis was performed using Xspec ver. 12.4.0. Temporal analysis was performed using the FTOOLS ver. 6.4.1.
In Figure 1 we show the light curve obtained by the EPIC-PN instrument in the 0.5–10 keV energy range. The source shows significant X-ray variability, with a 40% decrease in count rate between the beginning and end of the observation.
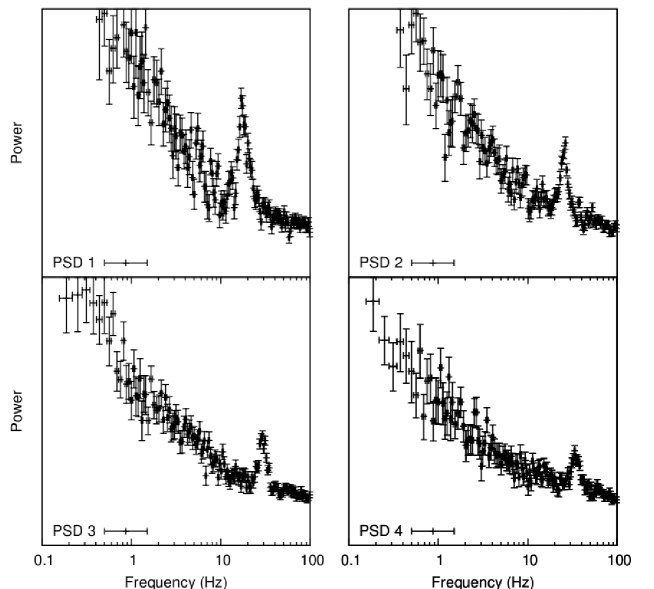
Besides the spectral analysis we also performed a study of the temporal variability. We extracted power spectral densities (PSD) from the EPIC-PN data in the frequency range 1/16 Hz to 512 Hz. We obtained a single PSD after averaging every 128 PSD, thus having a total of 20 PSD for the entire observation. We fitted the averaged PSD using two zero-centered Lorentzians, to account for the broadband low frequency noise, a constant term to fit the white noise and a Lorentzian to fit a broad quasi-periodic oscillation. We identify this broad QPO as the HBO (Jonker et al., 2000); this feature, as clearly shown by Jonker et al. (2000) is a good tracer of the overall temporal variability, which in turn, can be used to track the accretion state of the source in the X-ray Color-Color Diagram. With the exception of the first two PSD, when the source was at the highest count rate, we clearly detect the HBO in all the remaining PSD. The HBO centroids span a range of frequencies from 17 to 37 Hz, and we noted this frequency to be correlated with the source count rate. We used these results to derive the good time intervals from which we extracted the corresponding energy spectra. After some trials, we decided to slice the observation into five segments; this choice allows us to trail the spectral evolution of the source, still obtaining a high statistics spectrum to constrain all the spectral parameters. We denote from Spectrum 1 to Spectrum 5 the PN and RGS energy spectra extracted in the time intervals when the HBO frequency was in the 17–22 Hz, 22–27 Hz, 27–32 Hz, 32–37 Hz, 37 Hz (or not detected) range, respectively (see the time selected intervals shown in Figure 1). In Figure 2, we show the time averaged power spectra for the time intervals 1 to 4: the HBO evolved during the observation, moving from lower frequencies, small widths and high spectral power (Spectrum 1) to higher frequencies, larger widths and less spectral power (Spectrum 4). The HBO is probably undetected in Spectrum 5 because of the lower statistics, and because it is too broad to be resolved.
Given the high count rate of the source, we carefully investigated pile-up related effects by extracting our spectra from rectangular regions with and without the inclusion of the brightest central rows 222Strictly following the SAS thread as described in in http://heasarc.nasa.gov/docs/xmm/sas/USG/node63.html. Through several different trials, and with the help of the tool, we concluded that spectra 1 to 4 are not significantly affected by pile-up, and, as far as we are mostly concerned with the spectral shape of the broad iron Fe K line, the spectral parameters are, within the relative uncertainties, self-consistent for region masks with and without the inclusion of the central brightest rows. On the other hand, the time-selected region 5 is affected by pile-up; we extracted, therefore, the associated energy spectrum excluding the central 2 brightest pixel rows, in order to avoid significant pile-up dependent spectral distortions.
3 Spectral Analysis
We analyzed the time selected spectra independently, adopting a continuum model consisting of soft thermal disk emission (diskbb component, Makishima et al. 1986) and a thermal, harder, blackbody emission (component blackbody). We used for the interstellar absorption the vphabs model with crss-sections of Verner et al. (1996) and table abundances of Wilms et al. (2000). We found significant residuals at the neutral iron edge (7.11 keV); leaving the iron abundance free to vary resulted in a significant improvement in the and in the residuals scattering; iron is under-abundant with respect to the assumed Wilms et al. (2000) solar value (see also Ueda et al. (2005)).
Although broadband spectra of Z-sources reveal that the hard component is better described by thermal Comptonization models (see e.g. Lavagetto et al., 2004), XMM data do not allow to discriminate among different models of X-ray continuum, or to reliably constrain the parameters of the Comptonization model. We tested, however, using a variety of different spectral models, that the choice of the continuum alter, only marginally the overall value of our fits and the determination of the local features parameters, which is the main objective of the present Letter.
Superimposed to the continuum emission, a few discrete features are always present: a broad emission feature in the Fe K region, a weaker but also broad emission line at 3.9 keV and an absorption edge, whose energy threshold is in the 8.7–9.0 keV range.
We preliminarly investigated the shape of the broad iron line, using the total time averaged PN spectrum (energy range 3-12 keV), excluding only the time interval 5 (see Figure 1) because pile-up affected this part of the observation. Using a Gaussian profile to fit the line emission, resulted in a line position of 6.760.02 keV, 0.240.02 keV width and (2.00.2)10-3 photons cm-2 s-1 normalization value. Using a relativistically smeared disk-reflected profile (modelled using the diskline profile of Fabian et al. 1989), resulted in a rest frame energy of the line at 6.690.02 keV, an inner radius Rin=133 Rg, an inclination angle 34.61.3 deg and emissivity index 2.50. The Rext has a best fitting value 104 Rg but it is rather unconstrained with no upper limit and a 90% c.l. lower limit at 3000 Rg. The between these two profiles is 25 (+3 dof in the diskline model) indicating the relativistic profile as statistically more favorite than the symmetric Gaussian profile.
We assumed, thereafter, that the 3.9 keV emission line, which we identify with the Ca XIX Ly transition is also produced in the disk reflecting plasma, and we fit it using another diskline component, with Rin 333Inner and outer disk radii in the diskline model are expressed in units of gravitational radii (Rg), which for a 1.4 solar masses NS corresponds to 2.1 km. , Rext, emissivity index and inclination bound to the Fe K diskline component.
We turned, then, to the analysis of the time selected spectra. Because of the high statistics it is possible to well constrain all the diskline spectral parameters, except the outer radius for which we derived the largest uncertainties. We fixed this parameter to the reference value of 104 Rg, after having tested that this value lies extremely close ( 1) to the minimum for each spectrum. We find that the line shape, within the statistical uncertainties, does not significantly change during most of the observation, despite a significant change of the continuum flux and continuum parameters (see Table1) with best fitting values all consistent with the total time averaged values.
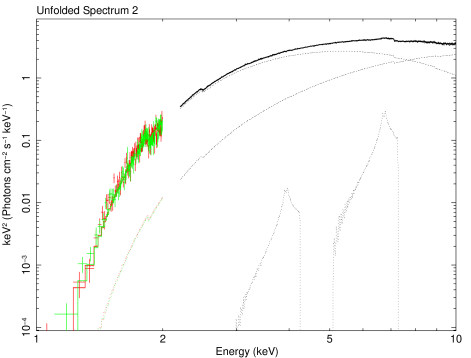
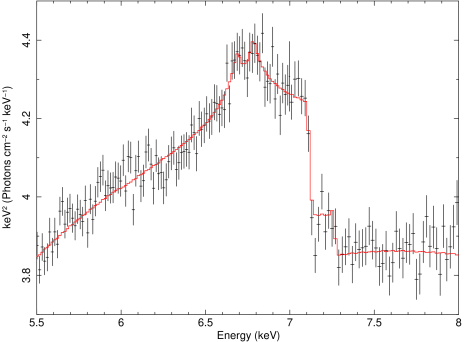
For Spectra 4 and 5, corresponding to the highest luminosities reached by the source during the observation, the temperature of the blackbody component was rather unconstrained by the fit, so that we kept it frozen in the fits to a reference value of 3.5 keV, in order to avoid unphysical higher values due to the lack of high energy spectral coverage. In Table 1 we comprehensively show the fitting results for the five time selected spectra. We representatively show in Figure 3 the unfolded spectrum, with the contribution of the additive components and a snapshot of the iron region, of Spectrum 2.
4 Discussion and Conclusions
In this Letter we report on the first unambiguous determination of the broad disk origin of the iron line in the Z-source GX 340+0. Broad asymmetric iron lines present in the energy range 6.4–6.97 keV have been discovered first in AGNs, and later, in galactic black hole candidates, and very recently also in a NS system (Di Salvo et al., 2005; Bhattacharyya & Strohmayer, 2007; Cackett et al., 2008). The common scenario for the origin of such lines is disk reflection, where the line deformation primarily arises from the high Keplerian velocity fields of the disk reflecting matter and from general relativistic effects produced by the intense gravitational well of the compact object. Our analysis reveals, for the first time in a NS accreting at the Eddington limit that the iron line shape in GX 340+0 is unambigously described by a disk reflection profile, finding also evidence of other reflection signatures (an absorption edge at 8.8 keV and a broad Ca XIX emission line).
During this XMM-Newton observation we can closely follow the spectral evolution of GX 340+0 through all of its horizontal branch. At its leftmost point, corresponding to the lowest count rate and to a frequency of the HBO of 17 Hz, we derive the lowest temperatures both for the disk (1.60 keV) and the hard emission (2.55 keV); as the source moves towards the hard apex, there is a continuum rising of the temperatures and of the X-ray flux; assuming a distance of 113 kpc and an inclination of the disk as inferred from the diskline profile, we derive a change in the source luminosity from (1.670.1) 1038 erg/s (Spectrum 1) to (2.570.2) 1038 erg/s (Spectrum 5). The inner disk radius as derived from the diskbb normalization (see Table 1) gives a value in the 8–11 km range; considering that the inner disk radius can be underestimated by a factor of two (Merloni et al., 2000), we find that these values are in agreement with the ones derived from the diskline line profile.
Despite this remarkable continuum change, the profile of the broad iron diskline does not sensibly change. The rest frame energy of the diskline component present in the iron region indicates that the line is most probably produced by He-like iron ions at a short distance from the compact source. In Spectrum 5, because the inclination angle and the emissivity of the line were bad constrained by the fit, we kept them frozen to the best values of the time averaged spectrum; we noted, therefore, a small shift of the rest frame line energy towards higher energies, possibly indicating a greater contribution from the H-like ions.
The equivalent width of the line decreases from Spectrum 1 ( 60 eV) to Spectrum 5 ( 30 eV), indicating that the line does not respond to the soft X-ray flux, which, on the contrary increases, but presumably to the hard X-ray emission, above 12 keV, which falls out from the observed spectral coverage of the EPIC/PN instrument. The inclination angle of the disk and the emissivity index are very well constrained by our fits, with relative uncertainties of only a few percent. Contrary to what found in galactic black holes, the emissivity index is not very steep, indicating a more extended illuminating corona above the disk; we are not able to identify any significant change in the value of this parameter during the observation, despite a large increase in the temperatures of the continuum components and their related fluxes.
Recently Laurent & Titarchuk (2007) proposed an alternative scenario for the formation of broad iron lines in LMXBs, where extensive red wings could be formed by recoil of line photons in an optically thick medium expanding, or converging, at relativistic velocities. Since a spectral line model, adapted to this scenario, is not yet available for fitting X-ray data, we are not able to test this scenario using our data. However, as pointed in Pandel et al. (2008) for the case of 4U 1636-536, we note that the lack of a narrow core and the presence of a blue wing in the iron line profile of GX 340+0 is a strong indication of the disk reflection origin.
Most theoretical models on the QPO generation in NS LMXB agree to identify the shortest dynamical timescales, i.e. the highest frequency QPO at 1 kHz, with the frequency of the Keplerian motion of matter at the inner rim of an accretion disk. From the HBO frequency and the relation known to exist between this and the upper kHz QPO frequency (Jonker et al., 2000), we can infer the upper kHz QPO to be in the 550–750 Hz frequency range. For a typical 1.4 M⊙ NS this frequency range corresponds to an inner disk radius of 9.8–12.1 Rg. The diskline inferred inner radii for the time selected spectra are all fully consistent within this range, and give support to the identification of highest QPO frequency with the inner disk Keplerian frequency. Our fit results seem also to indicate a decrease in the value of the inner disk radius as the source moves towards higher luminosities. The errors associated to this parameter are, however, still too large to claim a strict correlation and longer exposures are needed to assest the significance of such a relation.
The spectra show, together with the broad Fe K emission line, other reflection signatures, like a broad Ca XIX resonance line and a high-energy absorbtion edge, compatible with the Fe XXV K-edge (8.83 keV energy in the laboratory frame). The extraordinary good quality of the EPIC-PN spectrum of this source will allow to test even more recent theoretical line profiles and fully self-consistent disk reflection models. We aim at expanding this analysis in a forthcoming paper.
References
- Berendsen et al. (2000) Berendsen, S. G. H., Fender, R., Kuulkers, E., Heise, J., & van der Klis, M. 2000, MNRAS, 318, 599
- Bhattacharyya & Strohmayer (2007) Bhattacharyya, S., & Strohmayer, T. E. 2007, ApJ, 664, L103
- Cackett et al. (2008) Cackett, E. M., Miller, J. M., Bhattacharyya, S., Grindlay, J. E., Homan, J., van der Klis, M., Miller, M. C., Strohmayer, T. E., & Wijnands, R. 2008, ApJ, 674, 415
- Di Salvo et al. (2005) Di Salvo, T., Iaria, R., Méndez, M., Burderi, L., Lavagetto, G., Robba, N. R., Stella, L., & van der Klis, M. 2005, ApJ, 623, L121
- Fabian et al. (1989) Fabian, A. C., Rees, M. J., Stella, L., & White, N. E. 1989, MNRAS, 238, 729
- Hasinger & van der Klis (1989) Hasinger, G., & van der Klis, M. 1989, A&A, 225, 79
- Jonker et al. (2000) Jonker, P. G., van der Klis, M., Wijnands, R., Homan, J., van Paradijs, J., Méndez, M., Ford, E. C., Kuulkers, E., & Lamb, F. K. 2000, ApJ, 537, 374
- Laurent & Titarchuk (2007) Laurent, P., & Titarchuk, L. 2007, ApJ, 656, 1056
- Lavagetto et al. (2004) Lavagetto, G., Iaria, R., di Salvo, T., Burderi, L., Robba, N. R., Frontera, F., & Stella, L. 2004, Nuclear Physics B Proceedings Supplements, 132, 616
- Makishima et al. (1986) Makishima, K., Maejima, Y., Mitsuda, K., Bradt, H. V., Remillard, R. A., Tuohy, I. R., Hoshi, R., & Nakagawa, M. 1986, ApJ, 308, 635
- Merloni et al. (2000) Merloni, A., Fabian, A. C., & Ross, R. R. 2000, MNRAS, 313, 193
- Oosterbroek et al. (1994) Oosterbroek, T., Lewin, W. H. G., van Paradijs, J., van der Klis, M., Penninx, W., & Dotani, T. 1994, A&A, 281, 803
- Pandel et al. (2008) Pandel, D., Kaaret, P., & Corbel, S. 2008, ArXiv e-prints
- Penninx et al. (1993) Penninx, W., Zwarthoed, G. A. A., van Paradijs, J., van der Klis, M., Lewin, W. H. G., & Dotani, T. 1993, A&A, 267, 92
- Schulz & Wijers (1993) Schulz, N. S., & Wijers, R. A. M. J. 1993, A&A, 273, 123
- Ueda et al. (2005) Ueda, Y., Mitsuda, K., Murakami, H., & Matsushita, K. 2005, ApJ, 620, 274
- Verner et al. (1996) Verner, D. A., Ferland, G. J., Korista, K. T., & Yakovlev, D. G. 1996, ApJ, 465, 487
- Wilms et al. (2000) Wilms, J., Allen, A., & McCray, R. 2000, ApJ, 542, 914

 |
 |
| Spectrum 1 | Spectrum 2 | Spectrum 3 | Spectrum 4 | Spectrum 5 | |
|---|---|---|---|---|---|
| HBO freq. (Hz) | 17.70.2 | 25.70.2 | 29.4 0.2 | 34.60.4 | 37-40AAQPO not resolved in the PSD, value inferred to be in this range from Jonker et al. (2000). See also Fig.2 |
| 0.5-2.0 keV FluxBBUnabsorbed flux in units ergs cm-2 s-1. Reported values have a 10% relative error. | 2.69 | 2.99 | 3.22 | 3.55 | 4.17 |
| 2.0-10.0 keV FluxBBUnabsorbed flux in units ergs cm-2 s-1. Reported values have a 10% relative error. | 9.38 | 10.45 | 11.51 | 12.77 | 14.82 |
| CCIn units of atoms cm-2. | 9.42 | 9.84 | 9.89 | 10.23 | 10.51 |
| Iron Abundance | 0.84 | 0.75 | 0.64 0.07 | 0.72 0.08 | 0.68 0.13 |
| (keV) | 1.60 | 1.850.09 | 1.880.08 | 2.06 | 2.070.3 |
| RDBBDDInner disk radius in km, as derived from the normalization parameter of the diskbb component: ; for the calculation we assume a distance () of 11 kpc and an inclination angle () of 35 deg. (km) | 9.7 | 7.8 | 7.6 | 8.00.4 | 10.5 |
| (keV) | 2.55 | 2.89 | 2.980.20 | 3.5 | 3.5 |
| Fe Eline (keV) | 6.70 | 6.72 | 6.67 | 6.720.03 | 6.78 |
| Rin (Rg) | 16 | 13 | 142 | 13 | 7 |
| RextEEFrozen parameter during the fitting procedure.(Rg) | 104 | 104 | 104 | 104 | 104 |
| Incli. (deg) | 40 | 33 | 36.2 | 35.71.7 | 35EEFrozen parameter during the fitting procedure. |
| Betor FFIndex of the emissivity power law, that scales as r-(Betor). | 2.38 | 2.46 | 2.520.07 | 2.470.07 | 2.50EEFrozen parameter during the fitting procedure. |
| Fe Norm.GGNormalization values of the diskline component in units of photons cm-2 s-1. | 5.5 | 5.11.0 | 5.70.5 | 4.00.6 | 5.6 |
| Line Equivalent Width (eV) | 60 | 43 | 43 | 33 | 33 |
| Ca Eline (keV) | 3.870.07 | 3.93 | 3.940.05 | 3.940.06 | 3.920.07 |
| Ca Norm.GGNormalization values of the diskline component in units of photons cm-2 s-1. | 0.550.06 | 0.630.1 | 1.50.3 | 1.4 | 3.7 |
| Line Equivalent Width (eV) | 4.2 | 2.2 | 3.0 | 4.1 | 6.0 |
| Edge E (keV) | 8.85 | 8.97 | 8.94 | 8.80 | 8.91 |
| Edge () | 4 | 3 | 3 | 3.0 | 3.71.6 |
| () | 0.974 (674) | 1.083 (771) | 1.244 (908) | 1.186 (866) | 1.090 (663) |
Note. — Best-fitting values and associated errors for spectra 1-5. Errors quoted at .